Conventional digital cameras as a tool for assessing leaf area index and biomass for cereal breeding
2014-11-22JaumeCasadesandDolorsVillegas
Jaume Casadesús and Dolors Villegas
Institute of Food and Agricultural Research and Technology,Lleida 25198,Spain.*Correspondence:jaume.casadesus@irta.cat
INTRODUCTION
Cereal yield may be expressed as the product of biomass at maturity and harvest index(Van den Boogaard et al.1996).During the last century,yield increases were associated to improvements in harvest index(Álvaro et al.2008),achieving values close to the theoretical maximum which has been estimated to be 0.60(Austin 1980).Thus,future significant yield improvements will have to rely on biomass increases while maintaining the current harvest indices.For this reason,assessment of biomass has a great importance in cereal breeding programs,and reliable estimations of this target trait are needed.
One particular application of biomass estimation is the measurement of early vigor,which is critical in some environments because it reduces direct evaporation from soil,increases radiation interception by the crop,and brings a competitive advantage against weeds(Loss and Siddique 1994;Jacobsen et al.2012),and ultimately may be related to grain productivity(Preuss et al.2012).Early vigor has also been pointed out as a critical trait for adaptation strategies to climate change(Ludwig and Asseng 2010)and is dependent on both biomass and leaf area index(LAI),which are interrelated(Baret and Guyot 1991;Lawlor 1995).
Direct methods for measuring biomass and LAI consist of harvesting the samples in the field,transporting them to the laboratory,determining the area of the leaves to obtain LAI and/or oven-drying and finally weighing the sample to measure biomass(Villegas et al.2001;Royo et al.2004).The labor involved implies that it can be too costly or unfeasible for a large number of breeding plots.In addition,it is destructive and consumes part of the crop,which can be a problem given the small size of some breeding plots.
In this context,non-destructive optical methods have been proposed.Several studies have analyzed the applicability of vegetation indices based on spectral reflectance(Aparicio et al.2002;Royo et al.2003;Haboudane et al.2004;Liu et al.2007;Prasad et al.2007).One of those indices is the normalized difference vegetation index(NDVI).These indices have been proved useful with certain limitations(Royo and Villegas 2011),such as the environmental influence,the noise associated to the sensors,and the cost of the equipment,although some recent models are of lower price than previous versions.The assessment of biomass or LAI by spectral reflectance methods provides better results in early stages of development,as the presence of spikes and overlapping of leaves can disturb measurements(Aparicio et al.2002).Regarding the source of light,the equipment used in those methods can be classified as either passive or active.Passive instruments depend on sunlight and often consist of a generalpurpose spectroradiometer measuring a number of wavelengths in visible and near-infrared,whereas active instruments target well-defined markets and are equipped with lightsources emitting in specific waveband regions(Erdle et al.2011).
The requirement for such specialized equipment may be a bottleneck for a widespread use of spectral reflectance indices in breeding programs.Conventional digital cameras could provide a more convenient method since they are more affordable,portable,and easy to use.Digital photography has been used for quantifying plant traits such as leaf area(Baker et al.1996;Lukina et al.1999;Campillo et al.2008,Lati et al.2011)as well as senescence of leaves(Adamsen et al.1999;Ide and Oguma 2010)or grassland coverage(Li et al.2005).Besides,the images are multiuse.Once they have been used for assessing biomass they can also be useful for checking other traits,such as presence of disease,plant density,and distribution.
In this context,conventional cameras have been proposed as a selection tool for cereal breeding(Casadesús et al.2007;Mullan and Reynolds 2010).In breeding programs,photographic sampling can be cost-efficient because a large number of samples can be obtained with minimum effort.Calculations from those images can also be cost-effective because they are based on rather simple methods that can be automated for application to a large number of images.An additional aspect that may determine the practical interest of the method is its sensitivity to the weather conditions because restricting its use to days with clear skies would limit its utility.
In this work,we evaluate a protocol for photographic sampling and image analysis aimed at providing low-labor yet robust indices of biomass.The goal is to characterize how phenology and weather conditions affect the performance of several vegetation indices derived from digital photography.The experimental trial included different genotypes of barley,durum wheat,and tritordeum,which at different phenology stages were sampled destructively for biomass and at the same dates by digital photography.
RESULTS
The protocol described here allowed sampling of a large number of plots with a conventional digital camera and having the corresponding vegetation indices calculated the same day without much effort.The typical sampling session conducted in this work consisted of at least 125 pictures in a single day,which involved approximately 22 min in the field for taking the pictures and another 28 min in the office for downloading them from the camera,associating each picture to a breeding plot and calculating the indices.
Examination of the output images,where the software marked what it considered vegetation(Figure 1),showed that errors in classifying pixels were minimal(<1%).These corresponded to portions of leaves appearing with too much contrast in the photographs,either almost white or almost black,with a saturation component of color so low that they were not always classified as green.
Consecutive measurements on the same plots showed good repeatability and consistency of the diverse indices.This allowed us to easily distinguish the particular growing pattern of the different plant materials(Figure 2A).Even differences between elementary plots of the same material could be distinguished(Figure 2B).
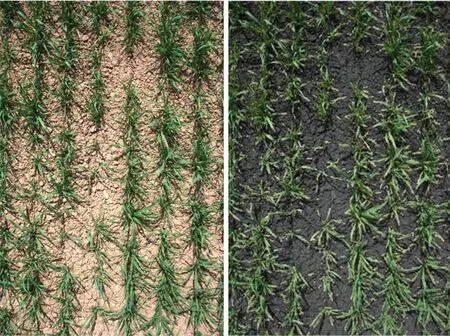
Figure 1.Example of an input image(left),as obtained by the camera,and the corresponding output image(right)after the custom-made software BreedPix version 1.0 calculated the diverse indices and marked in green the pixels counted as green fraction and in gray those considered background
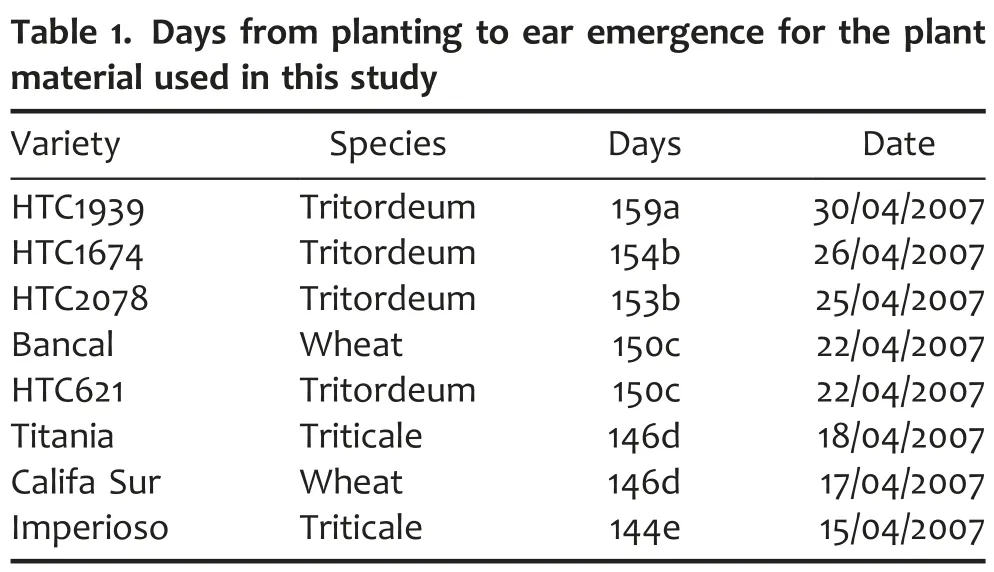
The time of ear emergence is shown in Table 1.The calculated indices showed significant correlations with the variables determined by destructive sampling(Table 2).Considering the whole growing season,LAI showed a coefficient of determination(R2)with each of the proposed indices equal to or greater than 0.64.However,the relationship was not the same for growing canopies before anthesis than for senescing canopies after anthesis(Figure 3).If analyzed separately,R2before anthesis was in the range of 0.8–0.9,while after anthesis it remained approximately 0.65.Presumably,the difference may in part be attributed to the impact of spikes in the zenithal view of the canopy.The relationship with green area index(GAI)—which includes the surface of stems and spikes—shows a hysteresis even greater than that of LAI.Considering the pre-anthesis samples,the coefficients of determination were better for GAI than for LAI,especially for the stage of stem elongation.This may be because a significant part of the “greenness” of the canopy corresponded to stems.On the other hand,after anthesis,the relationships of the indices with GAI were much poorer than with LAI,which may be because much of the green structures included in the GAI have a vertical orientation and were barely visible in a zenithal view of the canopy.Regarding biomass,before anthesis the crop dry weight(CDW)was positively correlated with all the studied indices,with R2in the range 0.78–0.88.The relationship of CDW with green area(GA)before anthesis is shown in Figure 4.As expected,the slope between CDW and each of the indices became negative after anthesis,because the indices decreased as a consequence of senescence of leaves while CDW was maintained or accumulating(data not shown).
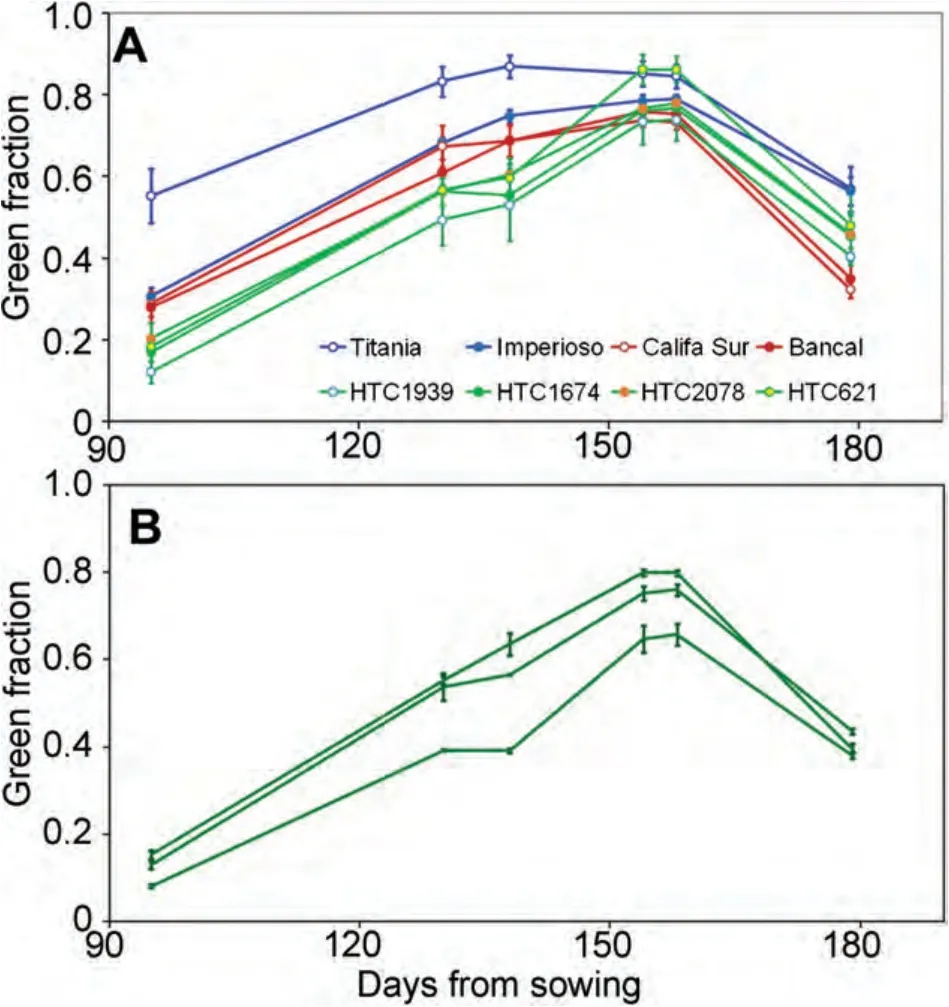
Figure 2.Seasonal evolution of the green fraction measured through photographic sampling at different dates(A)For each of the different genotypes,where triticale is represented in blue,bread wheat in red and tritordeum in green.The error bars are the SE of the mean for n=3 plots per genotype.(B)Example of the green fraction measured at different plots of a given genotype,HTC1939,where the different lines represent different plots and the error bars are the SE of the mean for n=5 pictures per plot.
Levels not connected by same letter are significantly different according to Student’s t-test(P < 0.05).
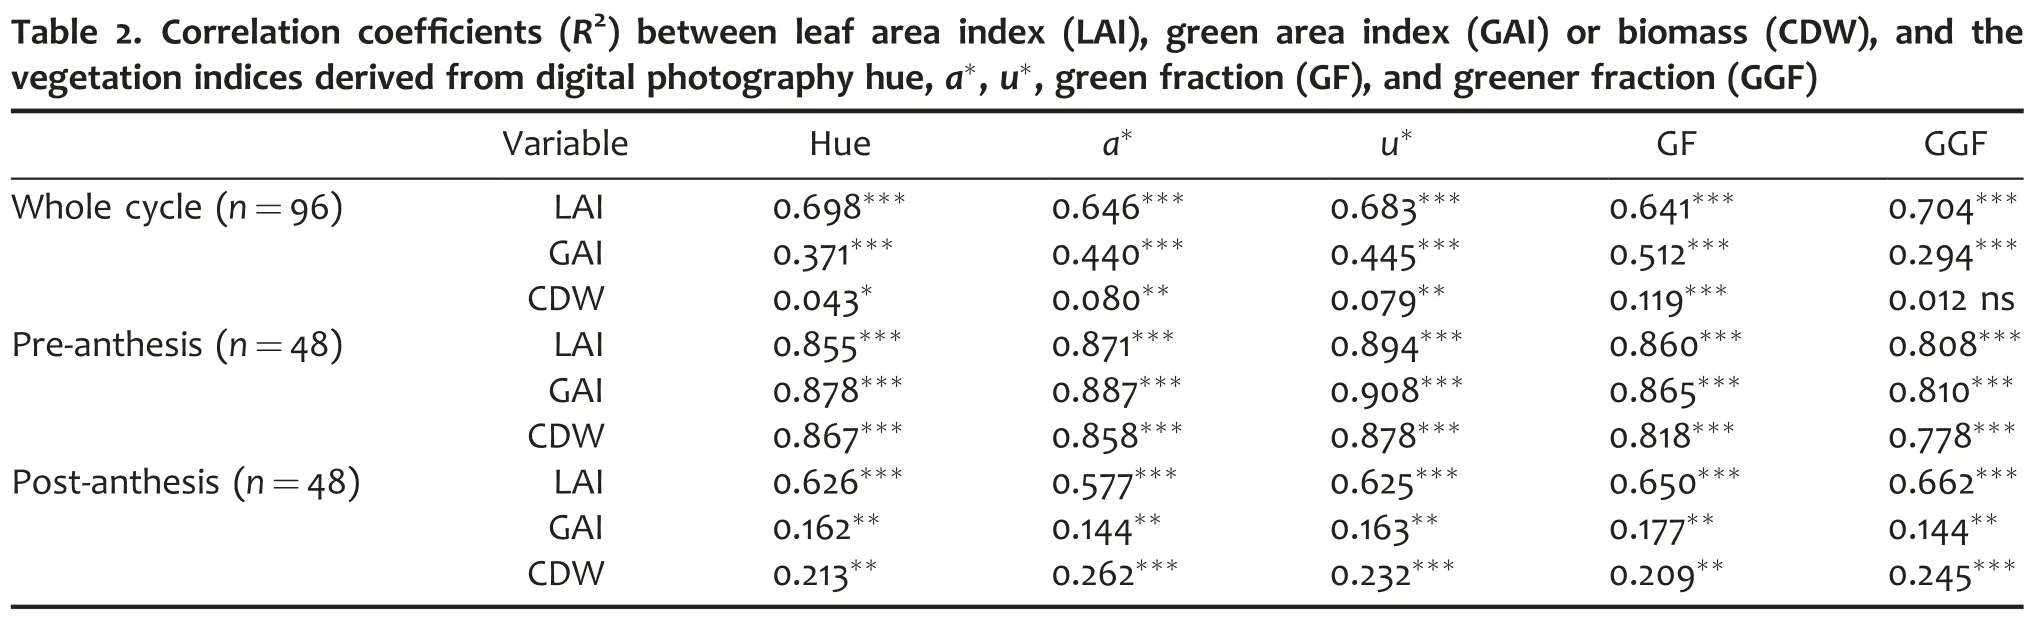
n,number of data points;*P<0.05;**0.01<P<0.05;***P<0.001.
In general,the best relationships with crop agronomic parameters were observed for the index u*,which for each sampling date prior to anthesis showed R2higher than 0.88 with LAI,GAI,and CDW(data per sampling date not shown).The index u*rates the average color of the image between green and red and it would depend on ground cover by the canopy,and also on canopy color.The performance of the index green fraction(GF)was almost as good as that of u*and it has the additional advantage of a more direct agronomic interpretation,because during the phases of canopy growth GF corresponds with the fraction of ground covered by the canopy.
Regarding the robustness to lighting conditions associated with weather,the results show some small but consistent differences between the diverse indices calculated.Overall,the effect of overcast conditions could be detected in all indices(Table 3).Nevertheless,when the pictures were taken on overcast days using a flash,then the differences with measurements under bright sunlight were not significant,except for a*.For instance,hue under overcast conditions was shifted slightly away from red—that is,towards values that correspond to more vegetation—compared with pictures of the same samples taken in bright sunlight(Figure 5).In the case of GF,the effect of overcast conditions,though statistically detectable was rather small.
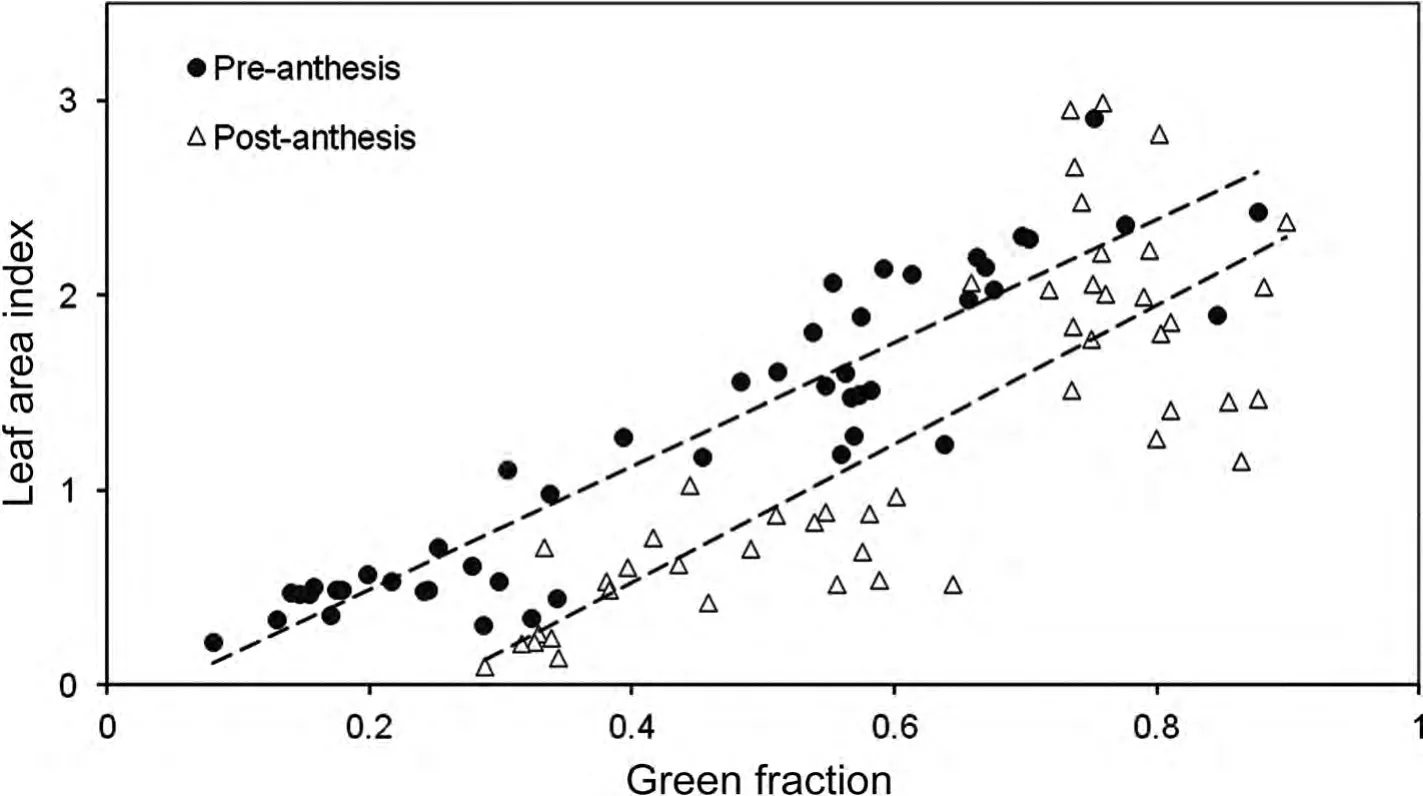
Figure 3.Relationships before and after anthesis between the green fraction determined through the photographic procedure and the leaf area index determined by destructive sampling
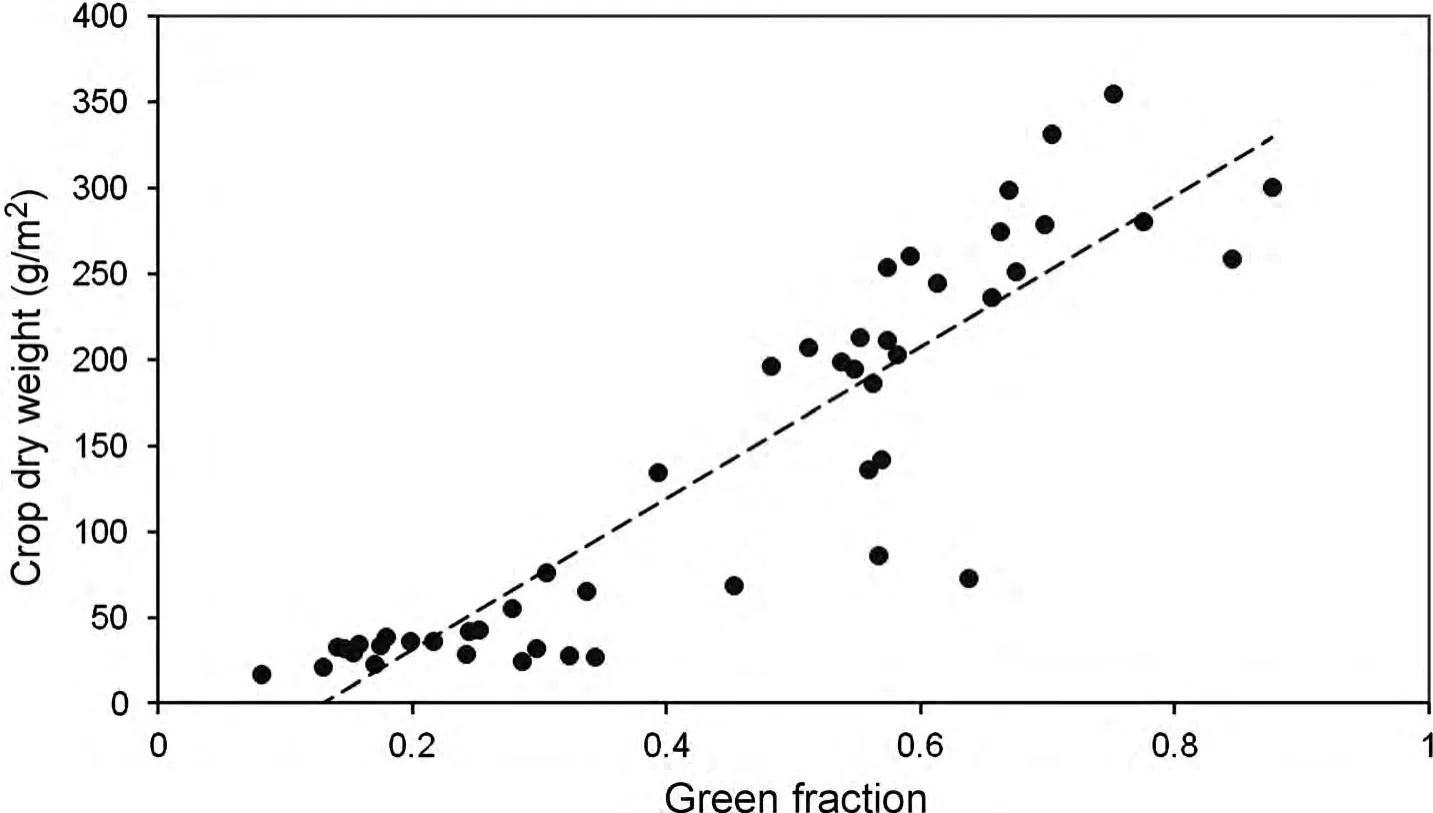
Figure 4.Relationship before anthesis between the green fraction determined through the photographic procedure and the crop dry weight determined by destructive sampling
DISCUSSION
The calculated indices were significantly correlated with the measured LAI and biomass,though these relationships varied with phenology.More precisely,the sensitivities of the indices to the actual LAI and biomass are higher for growing canopies before anthesis than for mature or senescent canopies aging after anthesis.This loss of sensitivity of vegetation indices to the actual crop biomass and LAI has long been observed in spectral reflectance indices.In particular,NDVI typically shows a good sensitivity for LAI values between 0 and 2 but reaches an asymptotic response at approximately LAI 3(Curran 1983;Sellers 1987;Aparicio et al.2000;Mistele and Schmidhalter 2010).Besides the effect of saturation,phenology may affect the optical properties of the canopy through the impact of structures such as the spikes(Jackson and Pinter 1986;Zipoli 1994;Aparicio et al.2002).Alternative spectral indices proposed to overcome the saturation problem in contexts of high biomass include the red edge inflection point(Guyot et al.,1988)and indices based on the NIR range(Heege et al.2008;Mistele and Schmidhalter 2010).However,to date,such alternative reflectance indices are not included in the instruments most suitable for routine use in terms of price and ease of use(Erdle et al.2011).
The diverse vegetation indices analyzed show some differences regarding their sensitivity to the weather conditions during sampling.Overcast conditions tend to produce a slight increase in the vegetation indices because colors appear slightly shifted towards blue.This can be minimized either by using flash under overcast conditions or by choosing indices,like GF,which are almost unaffected by lighting conditions.Comparing the performance of the diverse indices calculated,the index GF showed good correlations with all biomass variables,is the most robust to lighting conditions and it also offers the easiest interpretation.Limitations in the performance of GF in canopies of high LAI are similar to those of NDVI.Indeed,a close correlation between GF and NDVI in wheat canopies has been reported(Casadesús et al.2007).None of the studied photographic indices can be proposed as a surrogate of the alternative vegetation indices that seem to overcome the saturation problem,such as those related to the red edge.
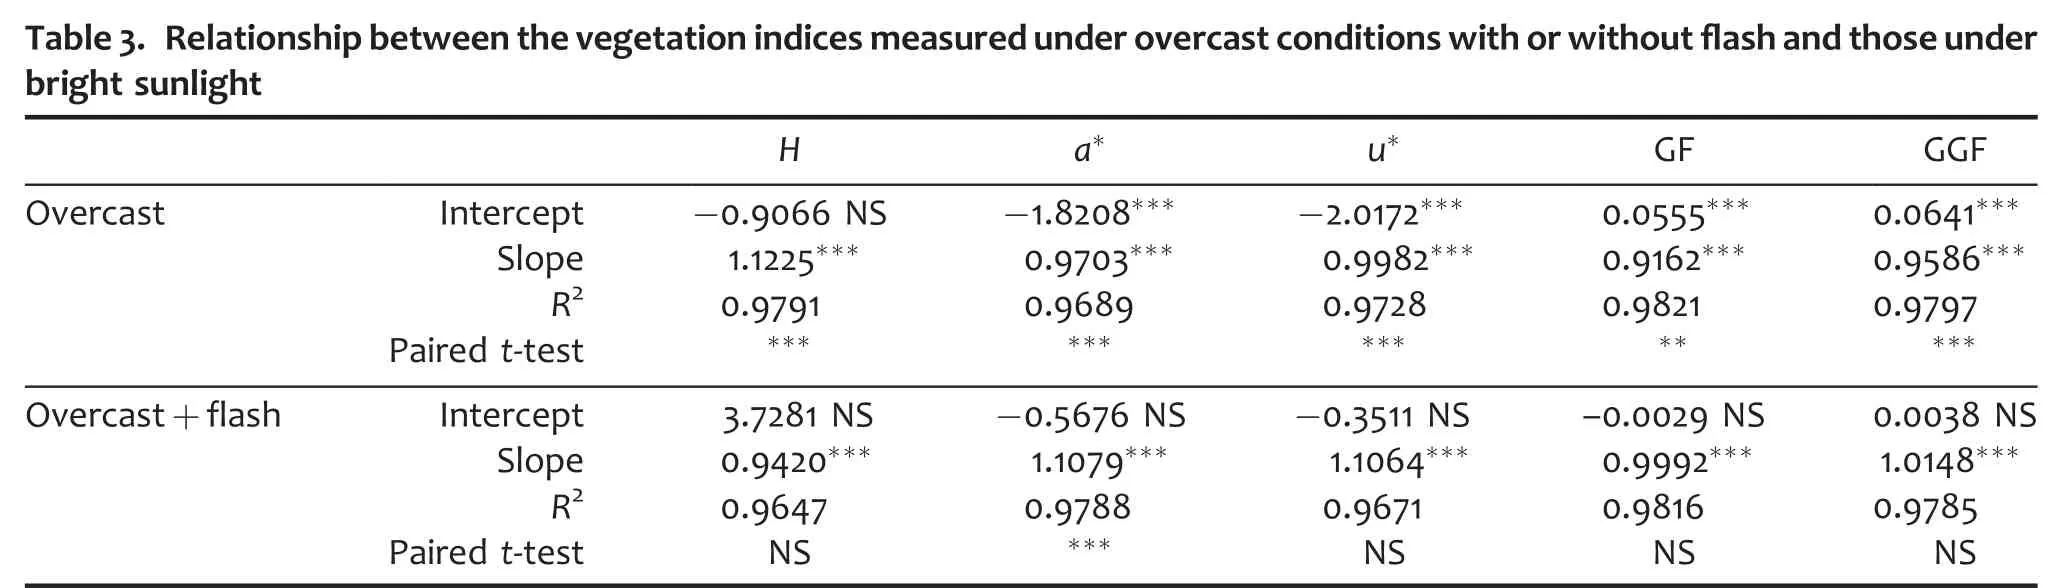
n=24;**0.01<P<0.05;***P<0.001.Intercept,slope,and R2 correspond to the regression with measurements under bright sunlight as the independent variable.Student’s paired t-test compares the measurements with those under bright sunlight.NS,not significant.
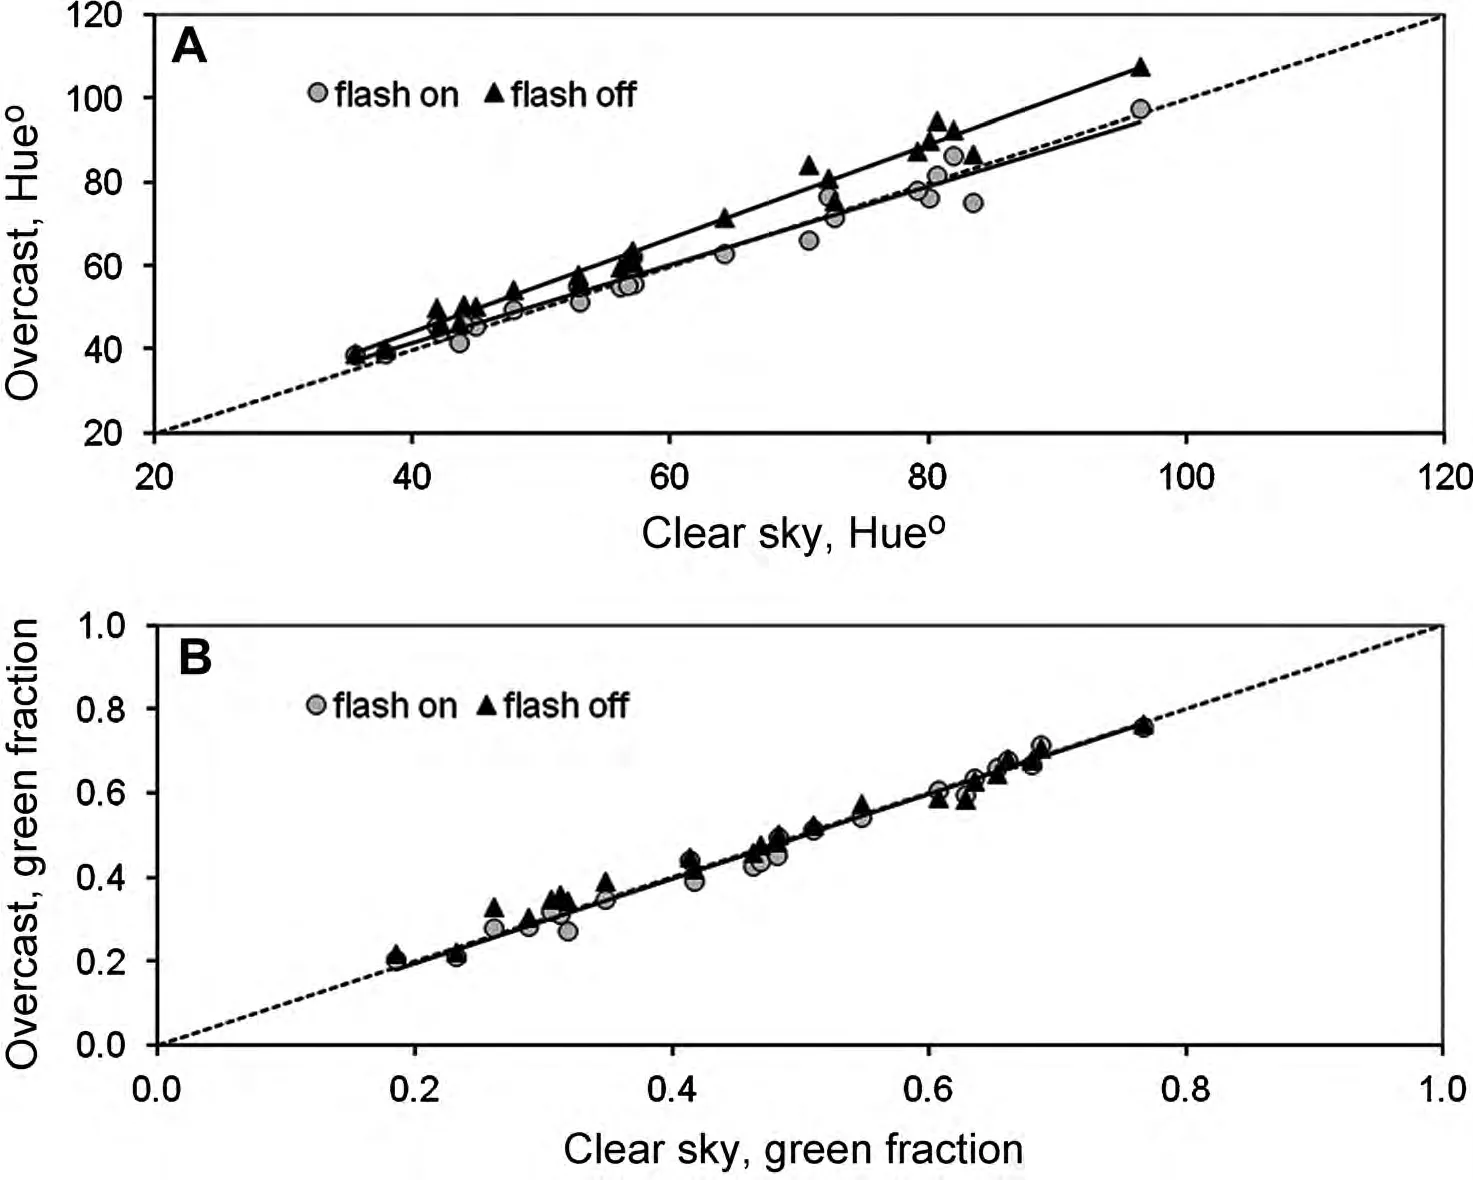
Figure 5.Relationships between measurements under bright sunlight of hue or green fraction and those obtained a few hours apart under overcast conditions,with or without flash
The photographic samplings conducted in this study show that assessment of biomass and LAI with conventional cameras is easily affordable in terms of equipment and labor.A large number of plots can be sampled and processed in a single day without specialized equipment.In addition,photographic assessment may overcome some problems related to spatial heterogeneity within the plots.Given that the cost of acquiring and processing the pictures is so low,several pictures can be taken per plot in order to increase the representativeness of the sample.In this study,the whole undisturbed area of the plot was sampled and processed at approximately the same speed required for walking beside all the plots.This example also illustrates how a collection of genotypes can be easily sampled at different times in the growing cycle,providing data that can allow characterizing different patterns of development.This study shows that photographic assessment of LAI and biomass is affordable,presents good repeatability,and also can be used under overcast conditions.
MATERIALS AND METHODS
Plant material
Plant material consisted of two widely grown bread wheat varieties(Bancal and Califa Sur),two triticale varieties(Imperioso and Titania),and four genotypes of hexaploid tritordeum(HT621,HT374,TH376,and THC2078),the tritordeum being obtained from the CSIC of Córdoba,Spain,by Antonio Martín.
Field experiments
Field experiments were conducted in Gimenells(41°40′N,0°20′E,Lleida province,North-East Spain)during 2006/2007 and 2007/2008 seasons.The soil classification was Mesic Calcixerolic Xerochrept and texture was fine-loamy.Experiments consisted of a randomized complete block design with three replications and plots of 12 m2,with eight rows,0.15 m apart.Seed rate was adjusted to 400 viable seeds m-2,and sowing took place on 23 November 2006 and 20 November 2007,the usual planting date in the zone.Experiments were rain-fed and the total water received from sowing to maturity was 208 mm in 2006/2007 and 266 mm in 2007/2008.The accumulated reference evapotranspiration from sowing to harvest was 571 mm in 2006/2007 and 1,091 mm in 2007/2008.Suitable agronomic practices were performed in order to maintain the crop free from weeds,diseases,and pests.The grain yield obtained in the 2006/2007 experiment,which was used for most of the calculations presented in this paper,ranged between 3,580 and 4,159 kg/ha in bread wheat,between 3,654 and 4,603 kg/ha in triticale,and between 1,053 and 2,414 kg/ha in tritordeum.Yield values of the experiment of 2008 have already been published(Villegas et al.2010).
Data collection
Photographic sampling consisted of walking across the field following the elementary plots according to their spatial arrangement along a pre-established path.Pictures were obtained while walking,without stopping,with the camera held by hand above the canopy at shoulder height,with the photographer’s arm extended towards the center of the plot.The camera position was then at approximately 150 cm height,approximately 70 cm from the border of the plot and oriented downwards.The field of view was approximately 180 cm per 120 cm of ground.Five pictures were obtained per plot,covering the part of the plot not disturbed by destructive methods.Sampling was conducted in 2007 on the days of year(DOY)57,92,100,116,120,and 141,which corresponded to the phenology phases of tillering,jointing,anthesis,and milk grain.Sampling all plots was typically done in less than 30 min.
An additional photographic sampling was conducted in 2008,on DOY 99,with the plants at booting stage.The weather conditions were announced to change and within the same day one sampling of the 24 plots was performed under bright sunlight and,a few hours later,repeated twice under overcast conditions,once without flash and once with flash.
The camera used was a NIKON D70 with an objective NIKKOR of 18–70 mm set at the minimum focal length,focusing at infinity and configured to a fixed aperture of F3.5 and automated exposure time,which ranged between 1/400 and 1/250.The images were 1 504×1 000 pixels.Unless indicated,pictures were taken without flash.
Image processing
After each sampling day,the pictures were downloaded to a PC and processed with custom-made software,BreedPix version 1.0,which can be obtained free of charge from the authors and is based on that described in Casadesús et al.(2007).In the software,the user had to select the folder where the images had been downloaded from the camera and assign each thumbnail to a breeding plot from a list previously defined by the user.Next,the software processed the whole list of images without further need of interaction with the user.The main output from the program was a table with one row per picture and the corresponding columns for the diverse indices and other data such as the identification of the plot.In addition,for each picture the program saved an output image representing how the pixels had been classified between canopy and background.
The procedures for calculating the vegetation indices are the same as those described in Casadesús et al.(2007)with the difference that the former indices green area(GA)and greener area(GGA)have been renamed green fraction(GF)and greener fraction(GGF).Basically,the indices are based on either the average color of the entire image,in diverse units related to its“greenness”,or on the fraction of pixels classified as green canopy relative to the total number of pixels of the image.The first group includes hue,in degrees,which is the H component in the HIS color space(for hue,intensity,and saturation),and the parameters a*and u*defined by the Commission Internationale de l’Éclairage(CIE)in the color spaces CIELAB and CIELUV,respectively(Trussell et al.2005),where both a*and u*rate a color in an axis from green to red in terms of sensitivity by the human visual system,and the difference between them lies in the formulas used in the calculation.The second group includes the GF,which corresponds to the proportion of green pixels in an image,where a pixel is considered green if its hue is within the range 60–180°.The GGF was aimed at quantifying the fraction of fully functional green cover,excluding yellowish pixels that may correspond to senescent leaves,and was calculated as the proportion of pixels whose hue is within the range 80–180°.
Biomass determinations
Plots were split in two halves,one of them being used for destructive biomass sampling,leaving the other half intact for digital imaging.Biomass sampling dates were within 1 d of the corresponding digital imaging sampling date.On each sampling,plants contained within a randomly selected portion of 0.5 m length in a central row were pulled out.Roots were cut at the ground level and yellow or dead leaves were discarded.The area of the green leaves(one side laminae),stems including the leaf-sheaths,and spikes if present were measured separately using a leaf-area meter(DIAS II;Delta-T Devices,Cambridge,UK).All portions were oven-dried at 70°C for 48 h and weighted.LAI was computed from leaf area of the whole sample,and GAI included the area of leaves,stems,and spikes.CDW was calculated from the weight of the whole sample.
Statistical analysis
For each index,the average from the five pictures per plot and date was compared with the destructive measurements at that plot and date.Pearson correlation coefficients were calculated with raw data with the JMP statistical package(JMP version 8;SAS Institute,Cary,NC,USA;1989–2007).
ACKNOWLEDGEMENTS
This work was funded by the Spanish Ministry of Science and Innovation,project AGL2005-07257-C04-03 and by the Spanish Ministry of Agriculture,projects RTA2010-00007-00-00 and RTA2012-00011-00-00.
Adamsen FJ,Pinter PJ,Barnes EM,LaMorte RL,Wall GW,Leavitt SW,Kimball BA(1999)Measuring wheat senescence with a digital camera.Crop Sci 39:719–724
Álvaro F,Isidro J,Villegas D,García del Moral LF,Royo C(2008)Breeding effects on grain filling,biomass partitioning,and remobilization in Mediterranean durum wheat.Agron J 100:361–370
Aparicio N,Villegas D,Casadesús J,Araus JL,Royo C(2000)Spectral vegetation indices as non-destructive tools for determining durum wheat yield.Agron J 92:83–91
Aparicio N,Villegas D,Araus JL,Casadesús J,Royo C(2002)Relationship between growth traits and spectral vegetation indices in durum wheat.Crop Sci 42:1547–1555
Austin RB(1980)Physiological limitations to cereals yields and ways of reducing them by breeding.In:Hurd R.G,Biscoe P.V,Dennis C,eds.Opportunities for Increasing Crop Yields,Pitman,Boston.pp.3–19
Baker B,Olszyk DM,Tingey D(1996)Digital image analysis to estimate leaf area.J Plant Physiol 148:530–535
Baret F,Guyot G(1991)Potentials and limits of vegetation indices for LAI and APAR estimation.Remote Sens Environ 35:161–173
Campillo C,Prieto MH,Daza C,Monino MJ,Garcia MI(2008)Using digital images to characterize canopy coverage and light interception in a processing tomato crop.Hortscience 43:1780–1786
Casadesús J,Kaya Y,Bort J,Nachit MM,Araus JL,Amor S,Ferrazzano G,Maalouf F,Maccaferri M,Martos V,Ouabbou H,Villegas D(2007)Using vegetation indices derived from conventional digital cameras as selection criteria for wheat breeding in water-limited environments.Ann Appl Biol 150:227–236
Curran PJ(1983)Multispectral remote sensing for the estimation of green leaf area index.Phil Trans R Soc Lond 309:257–270
Erdle K,Mistele B,Schmidhalter U(2011)Comparison of active and passive spectral sensors in discriminating biomass parameters and nitrogen status in wheat cultivars.Field Crops Res 124:74–84
Guyot G,Baret F,Major DJ(1988)High spectral resolution:determination of spectral shifts between the red and the near infrared.Int Archiv Photogramm Remote Sens 11:750–760
Haboudane D,Miller JR,Pattey E,Zarco-Tejada PJ,Strachan IB(2004)Hyperspectral vegetation indices and novel algorithms for predicting green LAI of crop canopies:Modeling and validation in the context of precision agriculture.Remote Sens Environ 90:337–352
Heege HJ,Reusch S,Thiessen E(2008)Prospects and results for optical systems for site-specific on-the-go control of nitrogen-top-dressing in Germany.Precision Agric 9:115–131
Ide R,Oguma H(2010)Use of digital cameras for phenological observations.Ecol Info 5:339–347
Jackson RD,Pinter PJ(1986)Spectral response of architecturally different wheat canopies.Remote Sens Environ 20:43–56
Jacobsen SE,Jensen CR,Liu F(2012)Improving crop production in the arid Mediterranean climate.Field Crops Res 128:34–47
Lati RN,Filin S,Eizenberg H(2011)Robust methods for measurement of leaf-cover area and biomass from image data.Weed Sci 59:276–284
Lawlor DW(1995)Photosynthesis,productivity and environment.J Exp Bot 46:1449–1461
Li XB,Chen YH,Yang H,Zhang YX(2005)Improvement,comparison,and application of field measurement methods for grassland vegetation fractional coverage.J Int Plant Biol 47:1074–1083
Liu ZY,Huang JF,Wu XH,Dong YP(2007)Comparison of vegetation indices and red-edge parameters for estimating grassland cover from canopy reflectance data.J Int Plant Biol 49:299–306
Loss SP,Siddique KHM(1994)Morphological and physiological traits associated with wheat increases in Mediterranean environments.Adv Agron 52:229–276
Ludwig F,Asseng S(2010)Potential benefics of early vigor and changes in phenology in wheat to adapt to warmer and drier climates.Agric Syst 103:127–136
Lukina EV,Stone ML,Rann WR(1999)Estimating vegetation coverage in wheat using digital images.J Plant Nutr 22:341–350
Mistele B,Schmidhalter U(2010)Tractor-based quadrilateral spectral reflectance measurement to detect biomass and total nitrogen in winter wheat.Agron J 102:499–506
Mullan DJ,Reynolds MP(2010)Quantifying genetic effects of ground cover on soil water evaporation using digital imaging.Funct Plant Biol 37:703–712
Prasad B,Carver BF,Stone ML,Babar MA,Raun WR,Klatt AR(2007)Potential use of spectral reflectance indices as a selection tool for grain yield in winter wheat under great plains conditions.Crop Sci 47:1426–1440
Preuss PP,Huang CY,Louhaichi M,Ogbonnaya FC(2012)Genetic variation in the early vigour of spring bread wheat under phosphate stress as characterised through digital charting.Field Crops Res 127:71–78
Royo C,Villegas D(2011)Field measurements of canopy spectra for biomass assessment of small-grain cereals.In:Matovic D,ed.Biomass—Detection,Production and Usage,Darko Matovic,InTech:Rijeka,Croatia.Available from:http://www.intechopen.com/articles/show/title/field-measurements-of-canopy-spectra-for-biomass-assessment-of-small-grain-cereals
Royo C,Aparicio N,Villegas D,Casadesús J,Monneveux P,Araus JL(2003)Usefulness of spectral reflectance indices as durum wheat yield predictors under contrasting Mediterranean conditions.Int J Remote Sens 24:4403–4419
Royo C,Aparicio N,Blanco R,Villegas D(2004)Leaf and green area development of durum wheat genotypes grown under Mediterranean conditions.Eur J Agron 20:419–430
Sellers PJ(1987)Canopy reflectance,photosynthesis,and transpiration.II.The role of biophysics in the linearity of their interdependence.Remote Sens Environ 21:143–183
Trussell HJ,Vrhel MJ,Saber E(2005)Color image processing.IEEE Signal Process Mag 22:14–22
Van den Boogaard R,Veneklaas EJ,Lambers H(1996)The association of biomass allocation with growth and water use efficiency of two Triticum aestivum cultivars.Aust J Plant Physiol 23:751–761
Villegas D,Aparicio N,Blanco R,Royo C(2001)Biomass accumulation and main stem elongation of durum wheat grown under Mediterranean conditions.Ann Bot 88:617–627
Villegas D,Casadesús J,Atienza SG,Martos V,Maalouf F,Karam F,Aranjuelo I,Nogues S(2010)Tritordeum,wheat and triticale yield components under multi-local mediterranean drought conditions.Field Crops Res 116:68–74
Zipoli G(1994)Panicle contribution to bidirectional reflectance factors of a wheat canopy.Int J Remote Sens 15:3309–3314