Approach to estimating non-point pollutant load removal rates based on water environmental capacity: a case study in Shenzhen
2014-09-06LiuLiangLiuAnGuanYuntao
Liu Liang Liu An Guan Yuntao,3
(1Graduate School at Shenzhen, Tsinghua University, Shenzhen 518055, China)(2School of Environment, Tsinghua University, Beijing 100084, China)(3State Environmental Protection Key Laboratory of Microorganism Application and Risk Control, Tsinghua University, Beijing 100084, China)
Approach to estimating non-point pollutant load removal rates based on water environmental capacity: a case study in Shenzhen
Liu Liang1,2Liu An1Guan Yuntao1,3
(1Graduate School at Shenzhen, Tsinghua University, Shenzhen 518055, China)(2School of Environment, Tsinghua University, Beijing 100084, China)(3State Environmental Protection Key Laboratory of Microorganism Application and Risk Control, Tsinghua University, Beijing 100084, China)
An innovative approach based on water environmental capacity for non-point source(NPS) pollution removal rate estimation was discussed by using both univariate and multivariate data analysis. Taking Shenzhen city as the study case, a 67% to 74% NPS pollutant load removal rate can lead to meeting the chemical oxygen demand (COD) pollution control target for most watersheds. In contrast, it is hardly to achieve the ammonia nitrogen (NH4-N), total phosphorus (TP) and biological oxygen demand (BOD5) pollution control target by simply removing NPS pollutants. This highlights that the pollution control strategies should be taken according to different pollutant species and sources in different watersheds, rather than “one-size-fits-all”.
environmental capacity estimation; non-point source(NPS)pollution; removal rate; control strategy
In recent decades, the Chinese government has made a lot of efforts to improve urban water quality, but the deterioration of the urban water environment has progressively become a serious problem in many cities[1-4]. This can be attributed to the lack of knowledge regarding urban water pollutant source identification and ineffective pollution control strategies.
Point and non-point sources(NPS) are the two primary sources of urban water environment pollution. Generally, the point source pollution such as municipal sewage and industrial wastewater has been treated as a major concern for many years. However, non-point source pollution has not received sufficient attention even though it is also among the most important contributors of water environment deterioration in China[5]. Especially in recent years, with the development of point source pollution control technology, NPS pollution has played an increasingly prominent role in influencing urban water environment pollution[6]. Contrary to point source pollution, NPS is characterized by random and intermittent occurrence, complex mechanisms and processes, and difficulties in monitoring, simulation and control[7]. It comes from many diffuse sources such as agriculture, stormwater runoff and deposition of atmospheric pollutants. Among them, stormwater runoff plays a dominant role[8]. The runoff can pick up significant loads of pollutants accumulated on the surface and transport them into the receiving water body. As early as in 1995, the US EPA has classified urban stormwater runoff as the third largest source of water environment pollution[9]. This highlights the immediate need to develop an effective NPS pollution control strategy for urban areas. In this regard, how to estimate the removal rate of the NPS pollution in order to meet a planned water quality objective is an essential step during the control strategy development.
In this research, we provide an innovative approach to estimating the removal rate of NPS pollutant load based on the water environmental capacity. The water environmental capacity represents a threshold, namely how much pollutant loads the water environment can receive without leading to water quality deterioration[10]. Based on this concept, the removal rates of pollutant loads from different pollution sources (point source and NPS) can be estimated. Taking Shenzhen city as the study case, NPS pollutant removal rates based on the water environmental capacity concept were estimated. Appropriate control strategies for different pollutants in each watershed were also investigated using both univariate and multivariate data analysis technique. Although this research study was based on Shenzhen city, the created knowledge can contribute to the development of NPS pollution control strategies in other rapidly urbanizing cases in China.
1 Material and Methods
1.1 Study site selection
The study site, Shenzhen city, is located in the Pearl River estuary, close to Hong Kong. All the 74 main rivers in the city are rain source typed[11]. According to the distribution of these rivers, Shenzhen city has been divided into nine river basins. In this research, the five major terrestrial basins are focused on. They are Maozhou watershed, Longgang watershed, Shenzhen watershed, Guanlan watershed and Pingshan watershed (see Fig.1). Each of the five watersheds covers more than 100 km2and is located away from coasts.
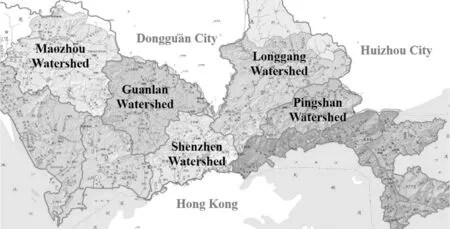
Fig.1 Location map of the study sites
1.2 Study approach
The research study was undertaken in the following steps. First, for each watershed, the annual pollutant loads exported from point source, NPS and the watershed background were estimated based on the data obtained from a broad literature review, and the total annual pollutant loads can be obtained by adding these three types up. Secondly, the water environmental capacity was estimated by a one-dimensional water quality analytical model based on “Environmental Quality Control Planning of Shenzhen City” (2006—2020)[12]. Accordingly, pollution emission thresholds were determined for total annual pollutant loads, and then the removal rate of each pollutant load was obtained. Finally, the relationship among pollutants, pollution sources and watersheds was investigated using both univariate and multivariate data analysis techniques. Visual PROMETHEE software[13]was used in this research to undertake multivariate data analysis. PROMETHEE (preference ranking organization method for enrichment evaluations) is a non-parametric method providing ranking for objects on the basis of a range of variables while graphical analysis for interactive assistance (GAIA) visually shows the results of PROMETHEE using principal component analysis (PCA). A detailed discussion of PROMETHEE is provided by Keller et al[14-15]. The analysis process for estimating NPS pollutant load removal rates is shown in Fig.2.
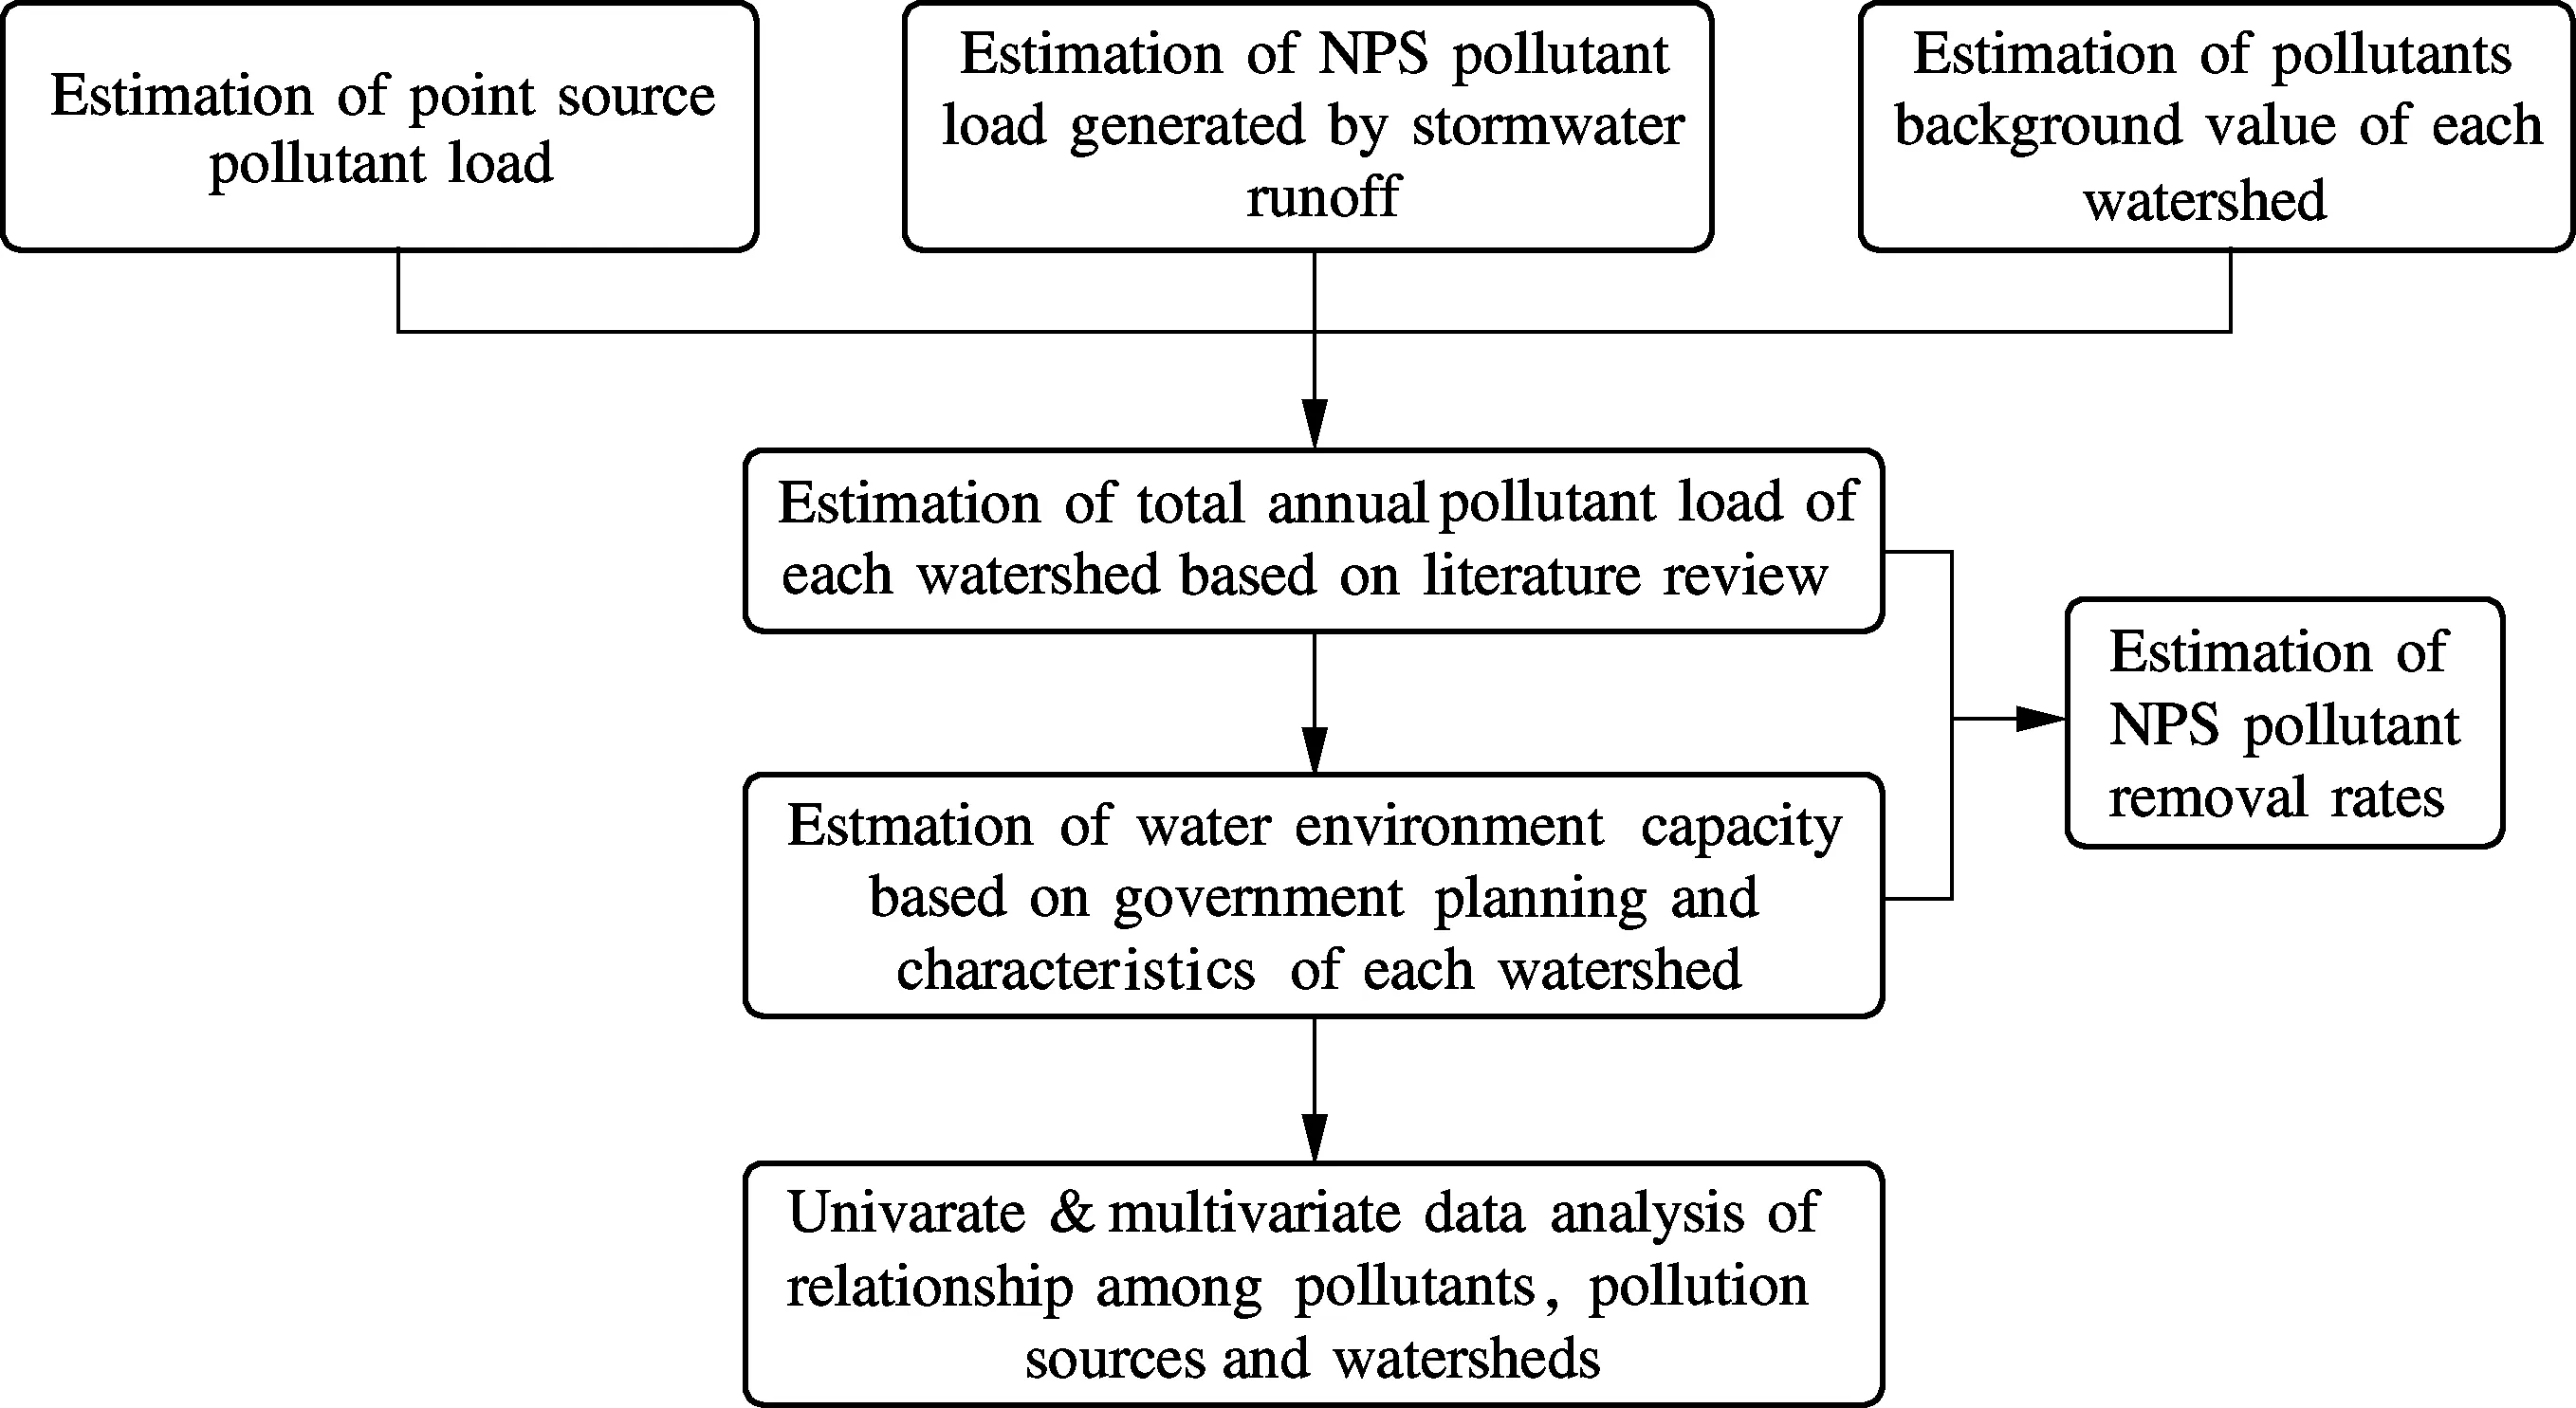
Fig.2 Flow chart for estimating NPS pollutant load removal rates
It is noteworthy that in this research, the estimation of point source pollutant load was undertaken without considering industrial wastewater because of its much lower pollution emission load compared with municipal wastewater. From 2007 to 2010, the COD pollution generated from industrial wastewater decreased from 5592 to 3582 t/a. By contrast, the COD pollution generated from municipal wastewater ranged from 49 625 to 31 134 t/a, which is almost ten times larger than that of industrial wastewater[16]. In addition, this was supported by the research objective of developing an approach to estimating the NPS removal rate rather than estimating total pollutant loads. In this context, only municipal wastewater was considered during the estimation of point source pollutant loads in this research.
1.3 Mathematical models
As rivers are the main receiving water bodies in Shenzhen city, a one-dimensional water quality analytical model for estimating environmental capacity is used based on river self-purification as follows:
(1)
whereCis the planned water quality, mg/L;C0is the threshold of pollution emission, mg/L;kis the attenuation coefficient, 1/d;xis the river length, km;uis the flow velocity, km/d.
As the river water is considered to be evenly mixed, the uniform mixture model is applied in this research. In addition, taking into account the planned water quality, the summation of pollutant loads from point source, NPS and watershed background should be smaller than the thresholdC0mentioned above. The water environmental capacity calculation model is
(2)
whereLis the annual pollution emission threshold of each watershed, t/a;Q0andC0are the total quantity of surface water in a watershed, m3, and the threshold of pollution emission, mg/L, respectively;QB,CBare the river flow volume without wastewater inflow, m3, and the background value of river pollution, mg/L;QM,CMare the quantity of wastewater generated from point source pollution, m3, and the pollutant concentration of wastewater generated from point source pollution, mg/L;QN,CNare the quantity of wastewater generated from NPS pollution, m3, and the pollutant concentration of wastewater generated from NPS pollution, mg/L, respectively.
Based on this concept, the removal rates of the NPS pollutant load can be obtained in the combination of Eq.(1) and Eq.(2).
2 Results and Discussion
2.1 Environmental capacity estimation
2.1.1 Quantity estimation
The stormwater runoff volume from the five watersheds were estimated based on land use information and fractions of surface types data provided by “Land use planning of Shenzhen city” (2006—2020)[17]. The surfaces were categorized into two types, namely grass surfaces (pervious surfaces) and impervious surfaces, which are two important surface types in terms of runoff volume estimations. Areas of grass and impervious surfaces in each watershed are shown in Tab.1.
Tab.1 Areas of different kinds of surfaces in each watershed in 2020
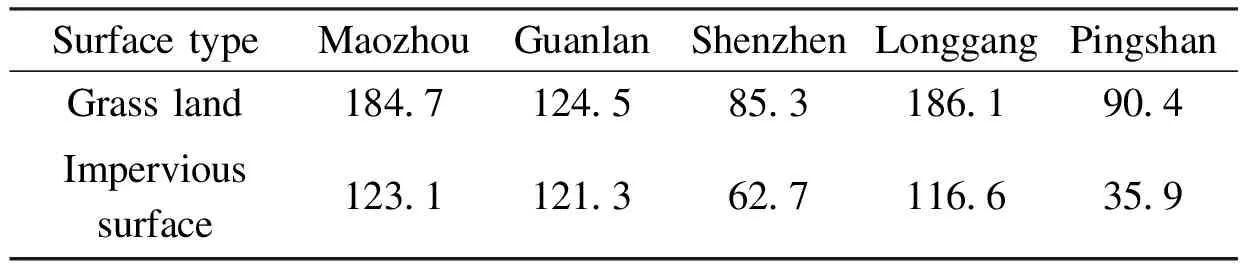
SurfacetypeMaozhouGuanlanShenzhenLonggangPingshanGrassland184 7124 585 3186 190 4Impervioussurface123 1121 362 7116 635 9
Xu and Guo[18]noted that the average runoff coefficient of pervious surfaces such as grassland is 0.15 while the corresponding value can reach more than 0.9 for impervious surfaces. Taking into account the relevant data given by past research studies and “Code for design of outdoor wastewater engineering” (GB 50014—2006)[19], 0.15 and 0.8 were selected for the runoff coefficients for grass surfaces and impervious surfaces, respectively. Accordingly, the estimated runoff volumes are shown in Tab.2.
Tab.2 Estimated water quantities of different pollution sources in each watershed in 2020
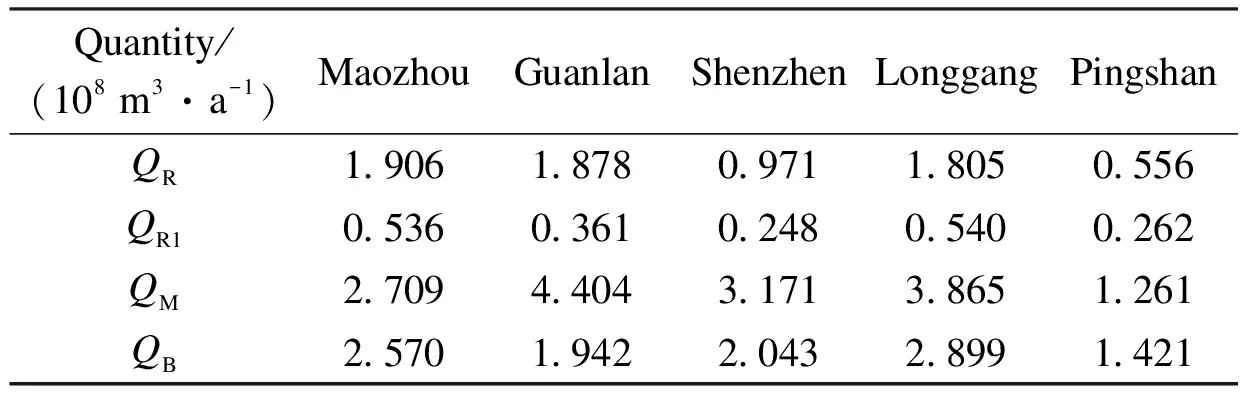
Quantity/(108m3·a-1)MaozhouGuanlanShenzhenLonggangPingshanQR1 9061 8780 9711 8050 556QR10 5360 3610 2480 5400 262QM2 7094 4043 1713 8651 261QB2 5701 9422 0432 8991 421
Note:QRis the quantity of stormwater runoff generated from impervious surfaces;QR1is the quantity of stormwater runoff generated from grass lands.
In terms of municipal wastewater volume estimation, considering the development of sewer systems, the collection efficiency of municipal wastewater would increase to 90% in 2020. Therefore, based on the volume of WWTP effluent, the annual quantity of municipal wastewater in each watershed is obtained. Tab.2 summarizes the results of relevant quantity estimations of municipal wastewater volume. Additionally, river flow volume which is referred to in Zhang’s research outcomes[20]are also included in Tab.2.
2.1.2 Quality estimation
Tab.3 lists the predicted outcomes of each pollutant’s concentration generated by municipal wastewater, NPS pollution and river background in 2020. “Environmental quality standards for surface water” (GB 3838—2002)[21]are also shown in Tab.3. Each pollutant concentration of WWTP enfluent has been identified according to the “Environmental quality control planning of Shenzhen city” (2006—2020). Furthermore, the quality of WWTP effluent was also predicted based on the current water quality of WWTP effluent in Shenzhen.
Taking the “Environmental quality control planning of Shenzhen city” (2006—2020) into account, the surface water quality in Shenzhen city should at least meet Grade Ⅳ of “Code for design of outdoor wastewater engineering (GB 50014—2006)” by 2020. For the five watersheds, Longgang, Pingshan, Maozhou and Shenzhen should meet Grade Ⅳ while Guanlan should meet Grade Ⅲ. As shown in Tab.3, in 2010, the organic pollutants concentration of WWTP effluent (COD and BOD5) met Grade Ⅳ standard while NH4-N and TP were still worse than Grade V. This implies that further treatment needs to be undertaken for NH4-N and TP in order to meet Grade Ⅳ by 2020. Consequently, the effluent concentrations of COD (20.98 mg/L) and BOD5(2.96 mg/L) in 2010 were applied to estimate the removal rates while the concentrations of NH4-N (1.50 mg/L) and TP (0.30 mg/L), which are the values of Grade Ⅳ, were used. For NPS pollution, the pollutant concentrations of stormwater runoff generated by grass lands and impervious surfaces were determined respectively based on data obtained from previous research studies[22-24]. The estimation results are shown in Tab.3.
Tab.3 Prediction of each pollutant’s concentration generated from different sources mg/L
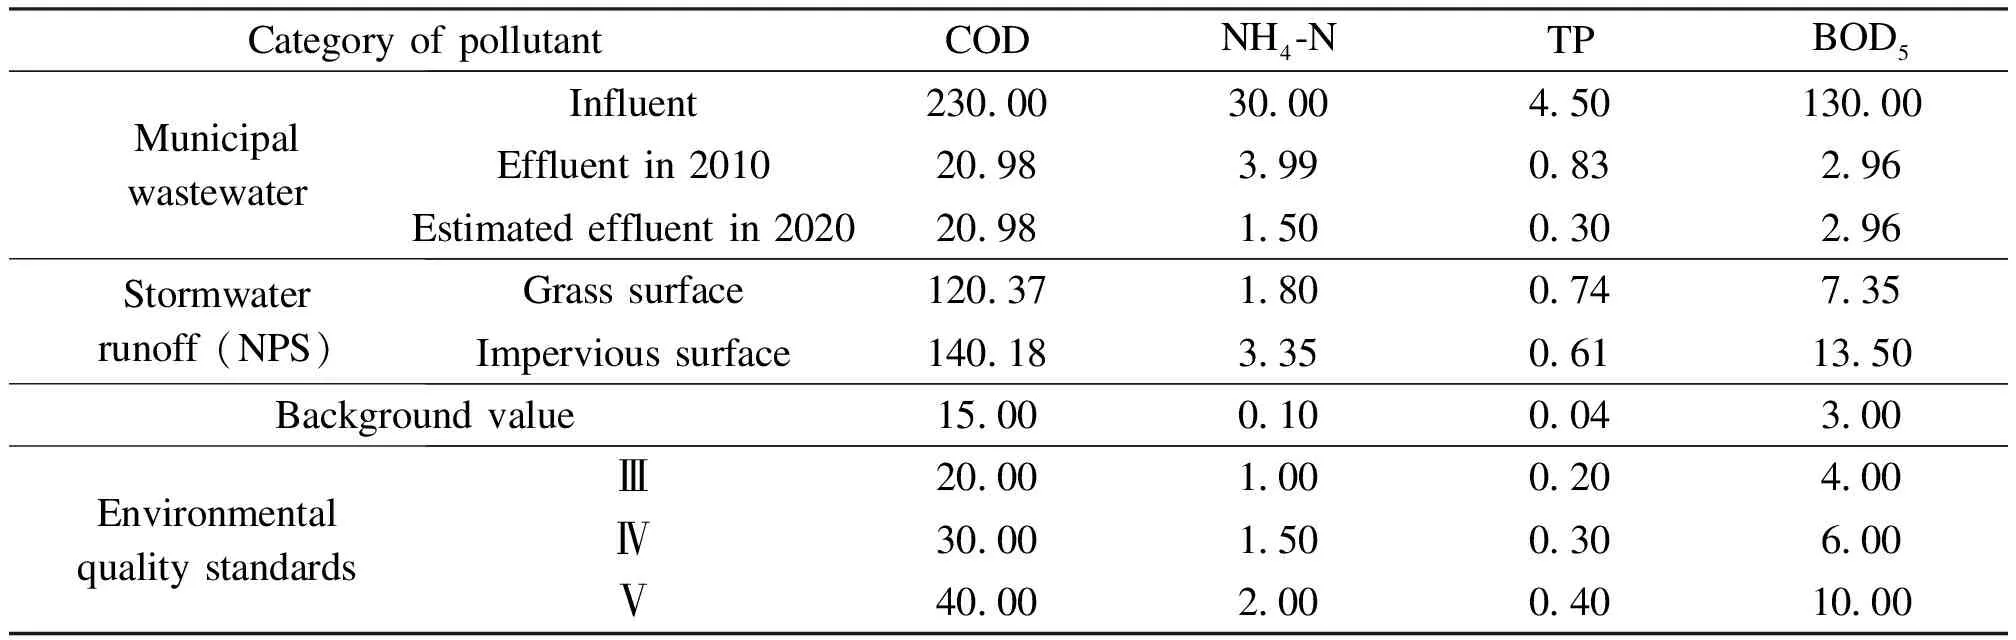
CategoryofpollutantCODNH4⁃NTPBOD5MunicipalwastewaterInfluent230 0030 004 50130 00Effluentin201020 983 990 832 96Estimatedeffluentin202020 981 500 302 96Stormwaterrunoff(NPS)Grasssurface120 371 800 747 35Impervioussurface140 183 350 6113 50Backgroundvalue15 000 100 043 00EnvironmentalqualitystandardsⅢ20 001 000 204 00Ⅳ30 001 500 306 00Ⅴ40 002 000 4010 00
Based on the predicted water quantity and quality results, pollutant loads of each watershed and the environmental capacity can be calculated by using the mathematical models (Eq.(1) and Eq.(2)). As a result, the parameterCin Eq.(1) was determined by referring to the water quality shown in Tab.3;k’s value is set to be 0.2, 0.1, 0.1, 0.3 for COD, NH4-N, TP and BOD5, respectively;u’s value is set to be 1m/s[12]; the river length is considered as 30.9, 22.0, 31.8, 39.3, 23.0 km for Mouzhou, Guanlan, Shenzhen, Longgang and Pingshan river, respectively. Therefore, the parameterC0which indicates the threshold of pollution emission can be obtained.
2.2 NPS removal rates for different pollutants in each watershed
2.2.1 Univariate data analysis
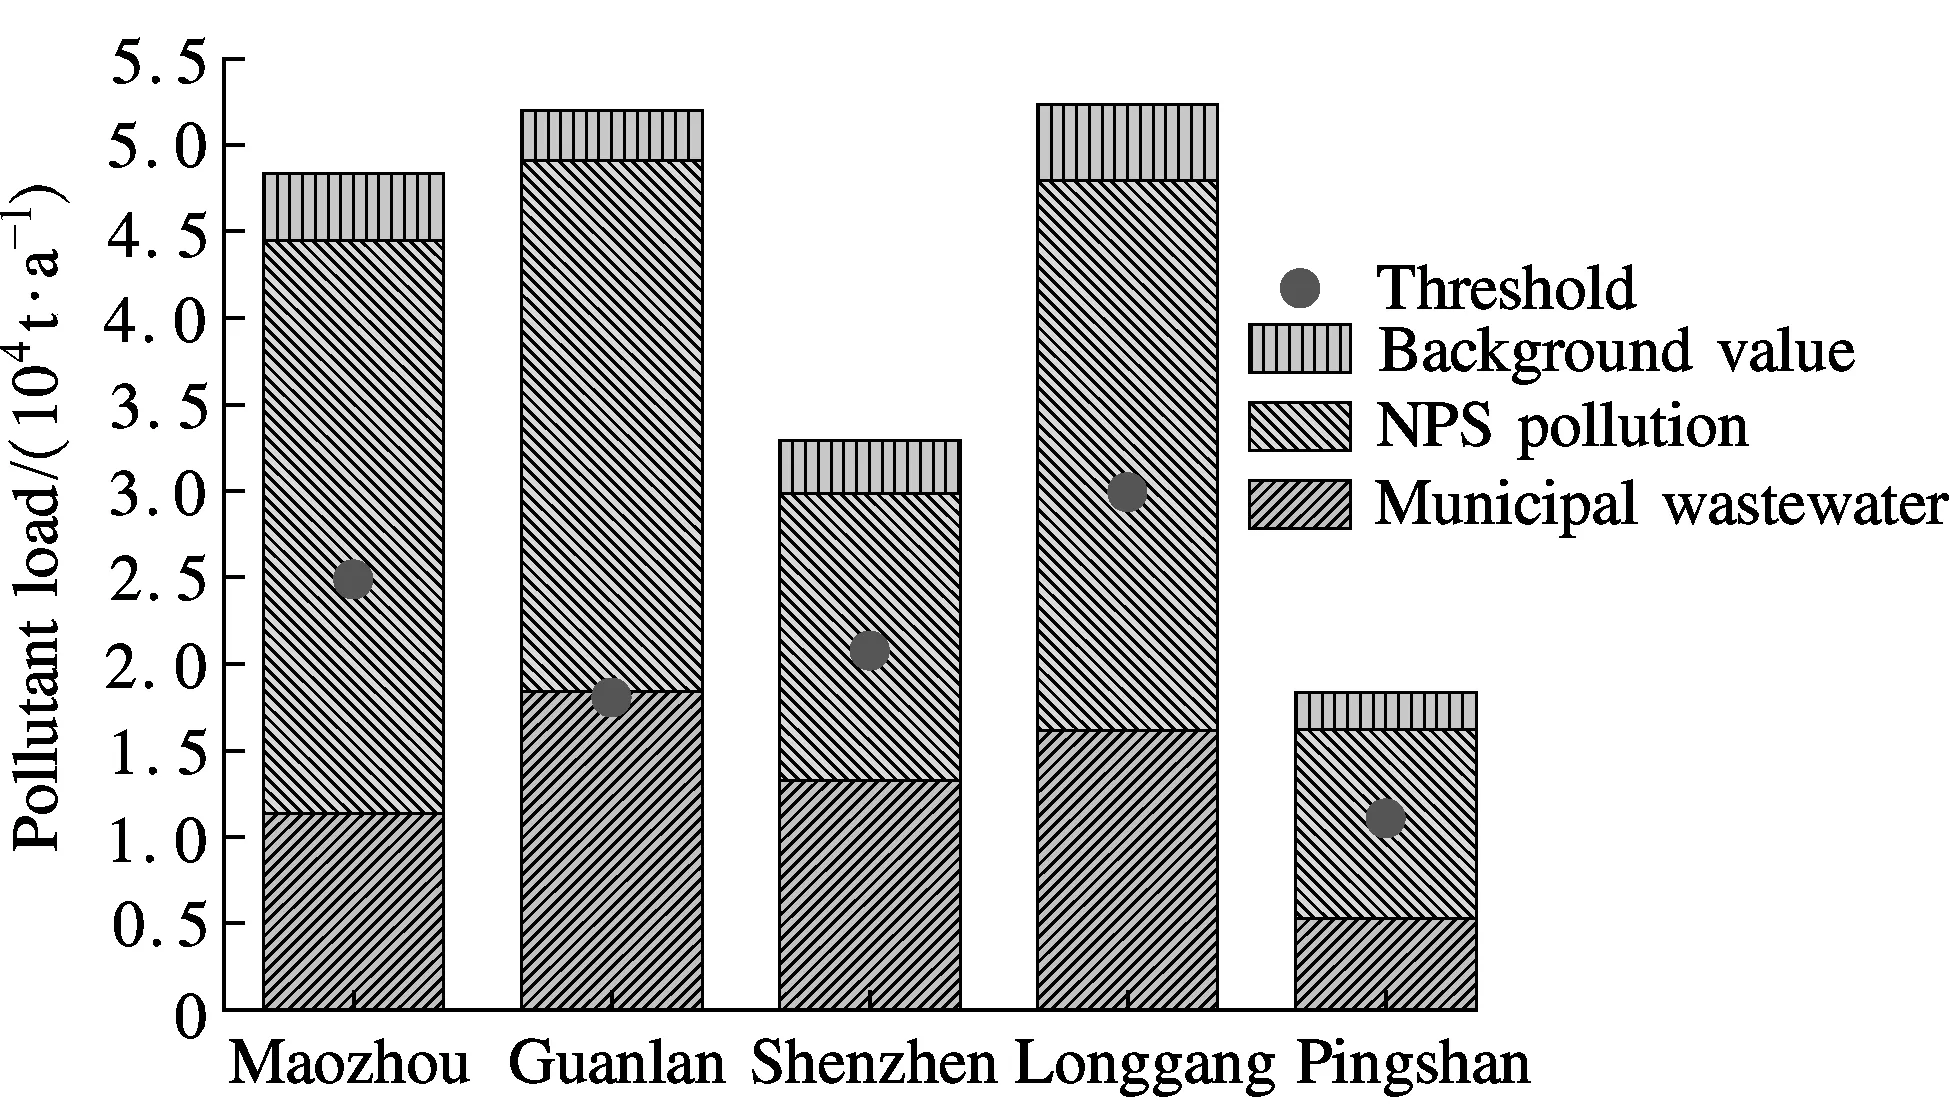
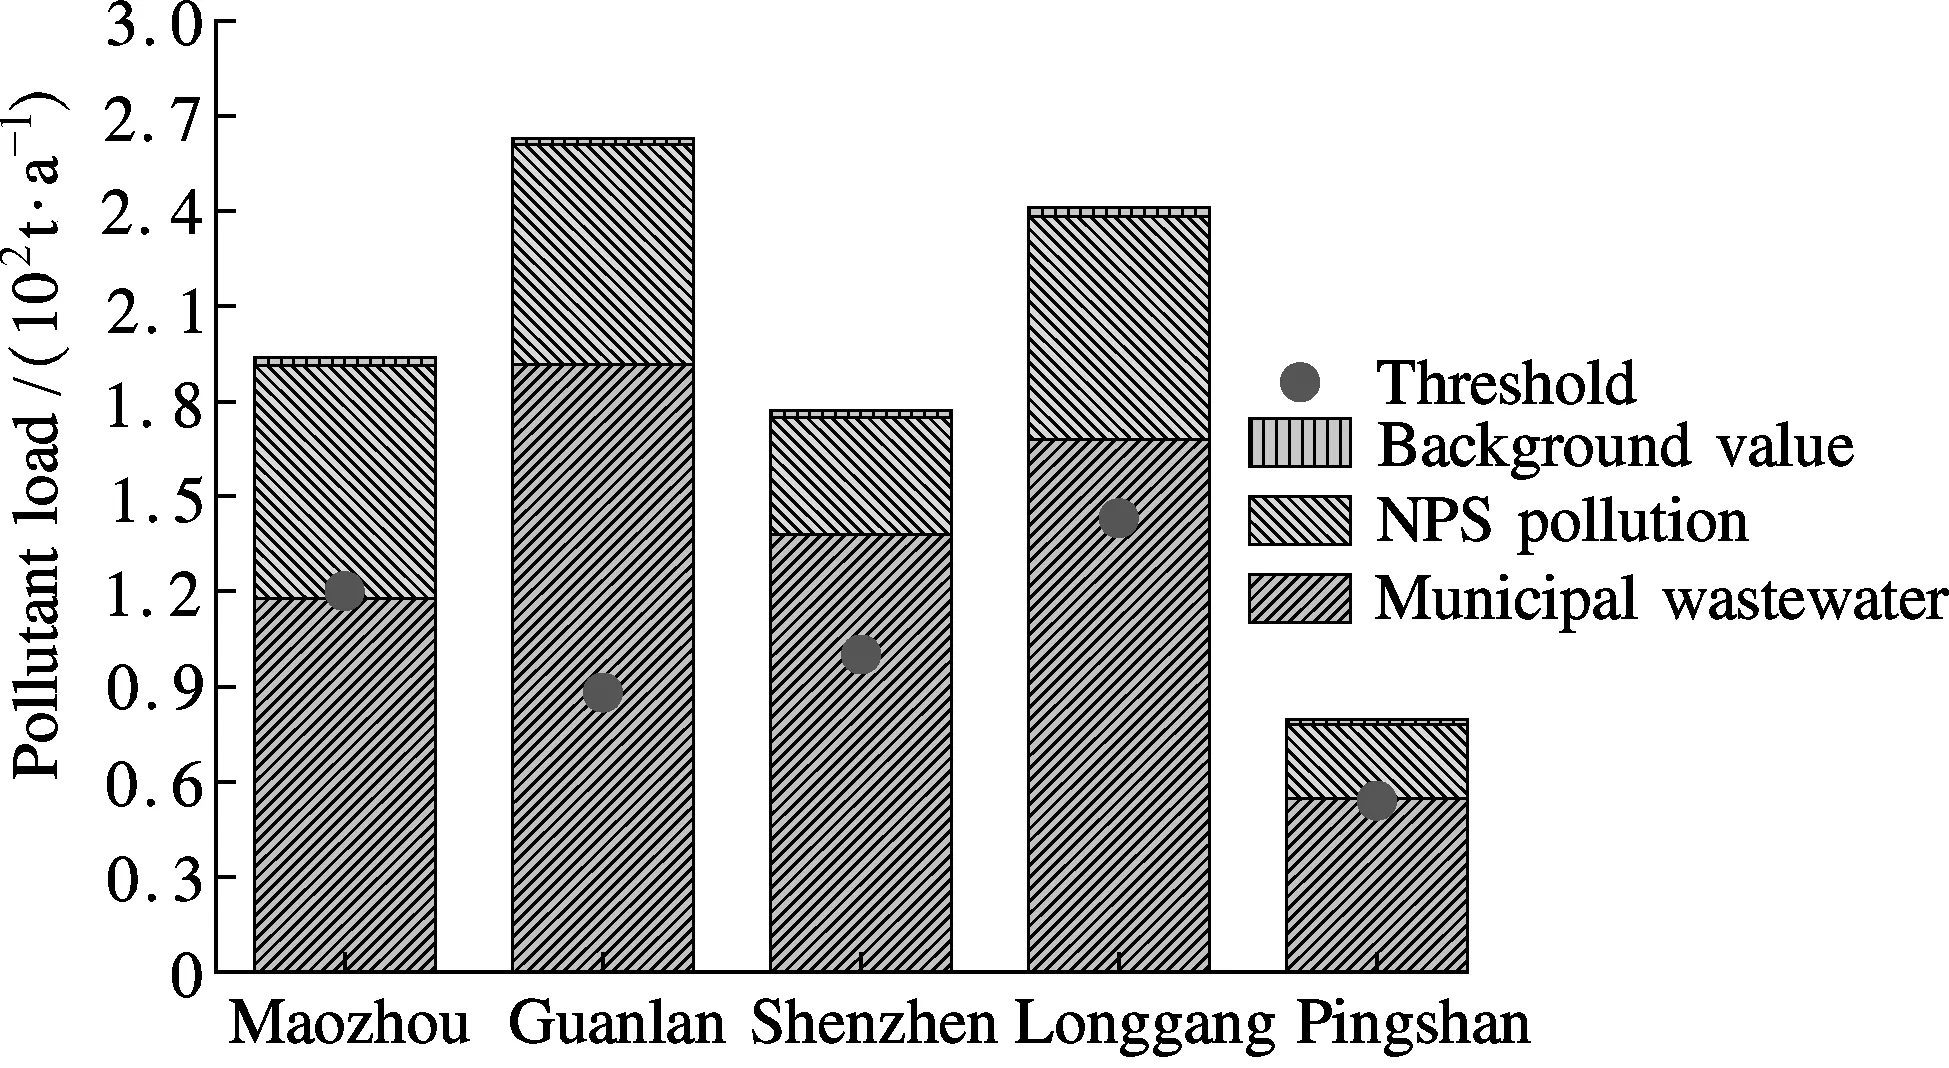
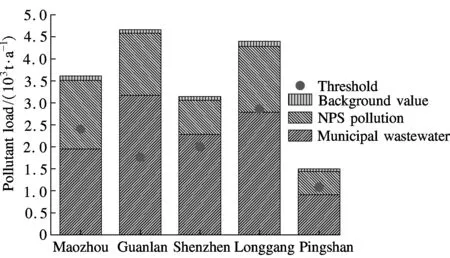
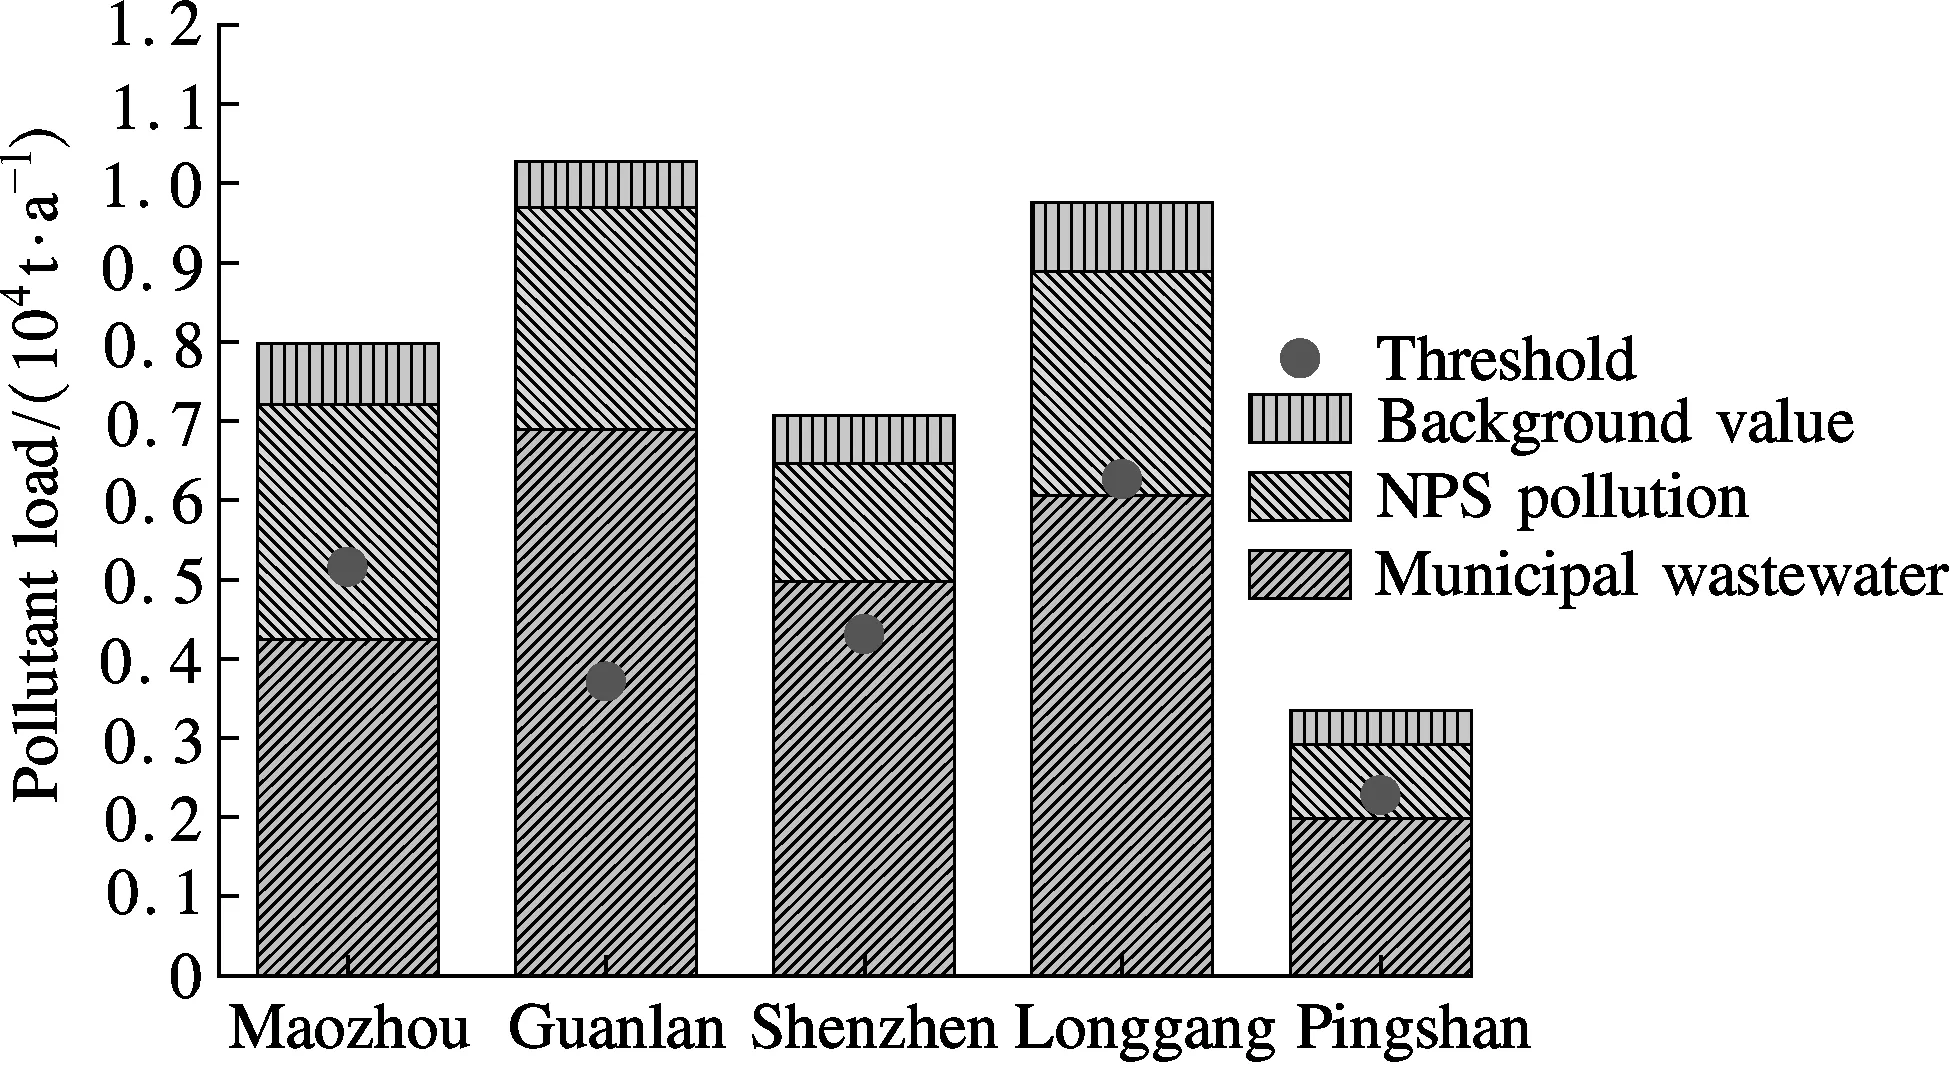
The comparisons of pollutant loads, pollution sources and watersheds are initially investigated using univariate data analysis as shown in Fig.3 and Tab.4.
It is evident from Fig.3 that the contribution of NPS pollution to water environment deterioration cannot be ignored. Especially for COD, the pollutant load generated from NPS has exceeded the municipal wastewater. This indicates that other than strengthening the municipal wastewater treatment efficiency, reducing pollutant loads from stormwater runoff should be also essential in terms of improving water environment quality.
It is noted that although Shenzhen and Pingshan watersheds have a similar size, the pollutant load from both municipal wastewater and NPS in Shenzhen watershed are almost twice as high as than that of Pingshan. This may be due to the frequent anthropogenic influence since Shenzhen watershed is a highly developed area while Pingshan watershed is less developed. This highlights that the anthropogenic activities can lead to more municipal wastewater discharge and accumulation of pollutants on urban surfaces.
(a) (b)
(c) (d)
Tab.4 compares the removal rates of municipal wastewater and stormwater runoff (NPS pollution) for each pollutant species. For COD, except in Guanlan watershed, a 67% to 74% NPS pollutant load removal rate can lead to meeting the threshold of water environmental capacity. In contrast, only Shenzhen watershed can achieve the control target by only removing the municipal wastewater pollutant loads. This further confirms that NPS pollution plays a dominant role in COD pollution. However, NH4-N acted totally contrary to COD, the required NPS pollutant load removal rate under the environmental capacity restriction all exceeded 100%. By contrast, a 47% to 92% removal rate for municipal wastewater was enough, which suggests that municipal wastewater plays a dominant role in NH4-N pollution. For TP, only Maozhou and Pingshan watershed can meet the threshold of water environmental capacity by only removing NPS pollutants. However, the required removal rate for municipal wastewater ranged from 47% to 92%. Similarly, municipal wastewater plays a dominant role in BOD5pollution. This indicates that for the development of NH4-N, TP and BOD5control strategies, improving municipal wastewater treatment processes is an effective way, while for COD, stormwater runoff control measures will play even larger roles. This implies the need to take comprehensive NPS and municipal wastewater control strategies in order to meet the requirement of the water environmental capacity.
Tab.4 Predicting removal rate of each pollutant in five watersheds in 2020 %
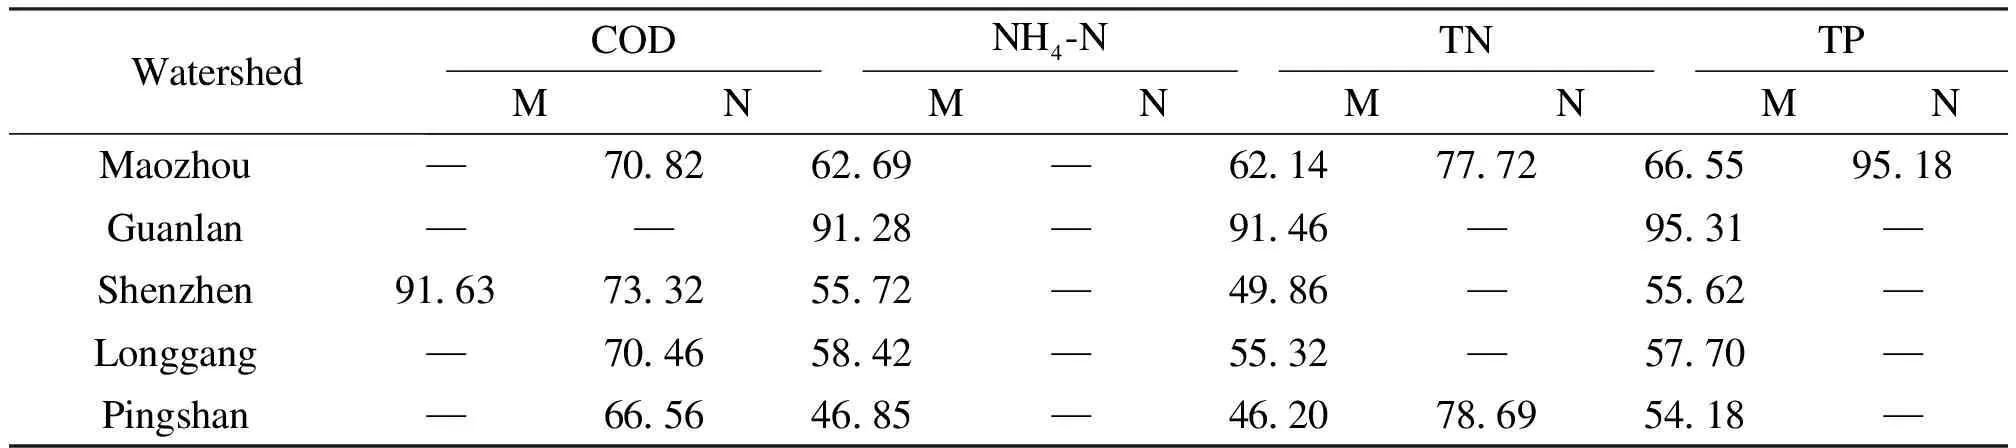
WatershedCODNH4⁃NTNTPMNMNMNMNMaozhou—70 8262 69—62 1477 7266 5595 18Guanlan——91 28—91 46—95 31—Shenzhen91 6373 3255 72—49 86—55 62—Longgang—70 4658 42—55 32—57 70—Pingshan—66 5646 85—46 2078 6954 18—
Note: M is the municipal wastewater pollutant; N is the NPS pollution generated from stormwater runoff; “—” means larger than 100%.
In conclusion, the above outcomes imply that pollution control strategies should be taken based on pollutant species in each watershed and the control strategies should differ in different watersheds rather than “one-size-fits-all”. Additionally, for NH4-N, TP and BOD5, improving the water quality of municipal wastewater discharged from WWTP is an effective way to meet the threshold of water environmental capacity. While for COD, the NPS pollution should be focused on. This highlights that apart from improving wastewater treatment processes, control measures such as LID for stormwater runoff quantity reduction and quality improvement are also important for the improvement of water environment.
2.2.2 Multivariate data analysis
Using PROMETHEE and GAIA, the multivariate data analysis on relationships among pollutant loads, pollution sources and watersheds are investigated. Two pollutant sources (municipal wastewater and NPS pollution) in five watersheds are considered as objects while four pollutant loads (COD, NH4-N, TP and BOD5) are seen as variables. Accordingly, the data matrix (10×4) is submitted to PROMETHEE and GAIA. Fig.4 shows the resulting GAIA biplots.
It is observed from Fig.4 that TP, NH4-N and BOD5vectors show a close relationship with municipal wastewater objects while COD vector indicates a strong correlation with NPS pollution objects, particularly Maozhou, Longgang and Guanlan watersheds. These observations further confirm that the pollutant generations vary highly with pollutant sources and watersheds. For NH4-N, TP and BOD5the primary pollutant source is municipal wastewater while COD is primarily generated from NPS pollution. However, Pingshan watershed does not have a close relationship with either of the pollution sources. This could be due to the lesser quantity of municipal waste water outflow and higher greening ratio in the watershed, which suggests that increasing pervious surfaces could potentially remove a relatively large percentage of the NPS pollution.
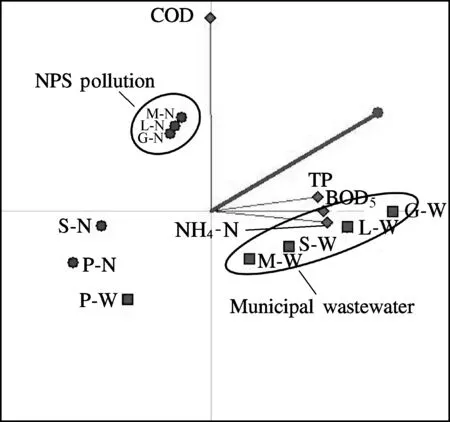
Fig.4 GAIA biplot for relationships among pollutant loads, pollution sources and watersheds (Δ=99.99%). (M—Maozhou; G—Guanlan; S—Shenzhen; L—Longgang; P—Pingshan; W—Municipal wastewater; N—Non-point source pollution; e.g. M-W represents the municipal wastewater pollution in Maozhou watershed)
3 Conclusion
This paper details the outcomes of a research study undertaken to investigate the contribution of point source and NPS pollution of five major watersheds in Shenzhen. An innovative approach to estimating the removal rates of NPS pollutant load based on environmental capacity concepts was presented. In terms of Shenzhen, COD is the primary non-point pollutant for most watersheds and a 67% to 74% removal rate of COD from non-point sources can lead to meeting the threshold of water environmental capacity. In contrast, it is hardly to achieve the NH4-N, TP and BOD5pollution control target by simply removing NPS pollutant loads in most watersheds. This highlights that urban water pollutant loads exported vary highly with pollutant species, pollutant sources and watersheds. In order to keep the water environment from continuing to deteriorate, NPS pollution control strategies should be taken in different watersheds rather than “one-size-fits-all”. Although this research study is based on Shenzhen city, the provided approach can be applied in other rapidly urbanizing cases in order to assist in water quality enhancement.
[1]Zhang J, Erik J S. Modelling of point and non-point nutrient loadings from a watershed [J].EnvironmentalModelling&Software, 2005, 20(5): 561-574.
[2]Peng Shenghua, Yin Kuihao, Liang Yongxian, et al. Study on river water pollution control and storm water utilization in Shenzhen [J].JournalofEnvironmentalEngineeringTechnology, 2011, 1(6): 495-504. (in Chinese)
[3]Yin Z, Walcott S. An analysis of the relationship between spatial patterns of water quality and urban development in Shanghai, China [J].Computers,EnvironmentandUrbanSystems, 2005, 29(2): 197-221.
[4]Li C. Ecohydrology and good urban design for urban storm water-logging in Beijing, China [J].Ecohydrology&Hydrobiology, 2012, 12(4): 287-300.
[5]Li Jinxiu, Ma Wei, Shi Xiaoxin, et al. Determination of allowable total discharge amount of pollutant [J].JournalofHydraulics, 2005, 36(7): 812-817. (in Chinese)
[6]State Environment Protection Administration of China. Report on the state of the environment in China [R]. Beijing: China Environment Science Press, 2000. (in Chinese)
[7]Shen Z, Liao Q. An overview of research on agricultural non-point source pollution modelling in China [J].SeparationandPurificationTechnology, 2012, 84: 104-111.
[8]Ongley E D,Zhang X L. Current status of agricultural and rural non-point source pollution assessment in China [J].EnvironmentalPollution, 2010, 158(5): 1159-1168.
[9]US EPA. National Water Quality Inventory. Report to congress executive summary [R]. Washington DC: US EPA, 1995:344.
[10]Chen Dingjiang, Lü Jun, Jin Peijian, et al. Uncertainty analysis of water environmental capacity in the nonpoint source polluted river [J].EnvironmentalScience, 2010, 31(5): 1215-1219. (in Chinese)
[11]Meteorological Bureau of Shenzhen Municipality. The Year Book of Shenzhen City (2012) [EB/OL]. (2013-03-01) [2013-10-12]. http://www.szmb.gov.cn/article/XinXiGongKai.
[12]Urban Planning Land and Resource Commission of Shenzhen Municipality. Environmental quality control planning of Shenzhen city (2006—2020) [EB/OL]. (2007-07-12)[2013-10-12]. http://wenku.baidu.com/view/550695c758f5f61fb73666e9.html.
[13]Bertrand Mareschal. Operation manual for visual PROMETHEE [EB/OL]. (2013-09-05)[2013-10-12]. http://www.promethee-gaia.net/vpa.html.
[14]Herngren L,Goonetilleke A. Analysis of heavy metals in road-deposited sediments [J].AnalyticaChimicaActa, 2006, 571(2): 270-278.
[15]Keller H R, Massart D L. Multicriteria decision making: a case study [J].ChemometricsandIntelligentLaboratorySystems, 1991, 11(2): 175-189.
[16]Environmental Protection Bureau of Shenzhen Municipality. Report of the environmental quality in Shenzhen city (2006—2010) [EB/OL]. (2011-09-23)[2013-10-12]. http://www.docin.com/p-262454505.html.
[17]Urban Planning Land and Resource Commission of Shenzhen Municipality. Land use planning of Shenzhen city (2006—2020) [EB/OL]. (2013-03-26)[2013-10-12]. http://www.szpl.gov.cn/xxgk/ghjh/td/201303/P020130326414200155682.pdf.
[18]Xu Zhenci, Guo Yongchen. Simulation test of runoff on different underlying surfaces in urban area [J].South-to-NorthWaterTransfersandWaterScience&Technology, 2007(1): 64-66. (in Chinese)
[19]Ministry of Housing and Urban-Rural Development of the People’s Republic of China. GB 50014—2006 Code for design of outdoor wastewater engineering [S]. Beijing: China Planning Press, 2006. (in Chinese)
[20]Zhang Yuying. Analysis on the utilization of the surface water in Shenzhen [J].GuangdongWaterResourcesandHydropower, 2001(5): 26-27. (in Chinese)
[21]Ministry of Environmental Protection of the People’s Republic of China. GB 3838—2002 Environmental quality standards for surface water [S]. Beijing: China Environmental Science Press, 2003. (in Chinese)
[22]Li L, Yin C. First flush of storm runoff pollution from an urban catchment in China [J].JournalofEnvironmentalSciences, 2007, 19(3): 295-299.
[23]Lee J H, Bang K W. First flush analysis of urban storm runoff [J].ScienceoftheTotalEnvironment, 2002, 293(1/2/3): 163-175.
[24]Zheng Jieyuan, Huang Guoru, Wang Zhijun, et al. Analysis of temporal and spatial variation of rainfall in Guangzhou city at recent years [J].WaterResourcesandPower, 2011(3): 5-8. (in Chinese)
基于水环境容量的面源污染削减率估算方法探讨:以深圳市为例
刘 梁1,2刘 安1管运涛1,3
(1清华大学深圳研究生院, 深圳 518055) (2清华大学环境学院, 北京 100084) (3清华大学国家环境保护环境微生物利用与安全控制重点实验室, 北京 100084)
以深圳市为例,采用单元分析与多元分析相结合的手段,探讨了一种基于城市水环境容量估算面源污染负荷削减率的方法在环境规划中的实际应用.计算结果表明:对于COD指标,67%~74%的面源污染负荷削减率即可满足深圳市规划后环境容量的限制;而对于NH4-N, TP和BOD5,仅依靠削减面源污染负荷则无法满足规划要求.因此,在城市水环境质量规划过程中,应针对不同流域及目标污染物种类,制定“量体裁衣”式的水环境控制策略,而非采用一成不变的措施.
环境容量估算; 面源污染; 削减率; 控制策略
X321
s:The National Science and Technology Major Project of China(No.2012ZX07301-001), the Shenzhen Environmental Research Project, China Postdoctoral Science Foundation (No.2013M530642).
:Liu Liang, Liu An, Guan Yuntao.Approach to estimating non-point pollutant load removal rates based on water environmental capacity: a case study in Shenzhen[J].Journal of Southeast University (English Edition),2014,30(2):143-149.
10.3969/j.issn.1003-7985.2014.02.002
10.3969/j.issn.1003-7985.2014.02.002
Received 2013-10-19.
Biographies:Liu Liang (1988—), male, graduate; Guan Yuntao (corresponding author), male, professor, guanyt@mail.tsinghua.edu.cn.
猜你喜欢
杂志排行

Journal of Southeast University(English Edition)的其它文章
- Prediction on effectiveness of road sweepingfor highway runoff pollution control
- A preliminary sustainability assessment of innovativerainwater harvesting for residential properties in the UK
- Potential contributions to Beijing’s water supply from reuse of storm- and greywater
- Characteristics of Hg pollution in urban stormwater runoff in Nanjing city, China
- Rainwater harvesting in the challenge of droughts and climate change in semi-arid Brazil
- Practice and analysis of recycling non-drinking waterfrom air-condition and reverse-osmosis systeminto rainwater collection system