Application of A*Algorithm for Real-time Path Re-planning of an Unmanned Surface Vehicle Avoiding Underwater Obstacles
2014-07-19ThanapongPhanthongToshihiroMakiTamakiUraTakashiSakamakiandPattaraAiyarak
Thanapong Phanthong, Toshihiro Maki, Tamaki Ura, Takashi Sakamakiand Pattara Aiyarak
Application of A*Algorithm for Real-time Path Re-planning of an Unmanned Surface Vehicle Avoiding Underwater Obstacles
Thanapong Phanthong1*, Toshihiro Maki2, Tamaki Ura2, Takashi Sakamaki2and Pattara Aiyarak3
1. Department of Physics, Faculty of Science, Prince of Songkla University, Songkhla 90110, Thailand
2. Institute of Industrial Science, the University of Tokyo 4-6-1, Komaba, Meguro-ku, Tokyo 153-8505, Japan
3. Department of Computer Science, Faculty of Science, Prince of Songkla University, Songkhla 90110, Thailand
This paper describes path re-planning techniques and underwater obstacle avoidance for unmanned surface vehicle (USV) based on multi-beam forward looking sonar (FLS). Near-optimal paths in static and dynamic environments with underwater obstacles are computed using a numerical solution procedure based on an A* algorithm. The USV is modeled with a circular shape in 2 degrees of freedom (surge and yaw). In this paper, two-dimensional (2-D) underwater obstacle avoidance and the robust real-time path re-planning technique for actual USV using multi-beam FLS are developed. Our real-time path re-planning algorithm has been tested to regenerate the optimal path for several updated frames in the field of view of the sonar with a proper update frequency of the FLS. The performance of the proposed method was verified through simulations, and sea experiments. For simulations, the USV model can avoid both a single stationary obstacle, multiple stationary obstacles and moving obstacles with the near-optimal trajectory that are performed both in the vehicle and the world reference frame. For sea experiments, the proposed method for an underwater obstacle avoidance system is implemented with a USV test platform. The actual USV is automatically controlled and succeeded in its real-time avoidance against the stationary undersea obstacle in the field of view of the FLS together with the Global Positioning System (GPS) of the USV.
underwater obstacle avoidance; real-time path re-planning; A* algorithm; sonar image; unmanned surface vehicle
1 Introduction1
The uses of unmanned vehicles in the field of underwater and maritime applications have become increasingly significant in recent years for instance, autonomous underwater vehicles (AUVs) and unmanned surface vehicles (USVs). Much research has been done on AUVs, particularly regarding strategies of path planning, avoidance and control (Gao et al., 2008; Kim and Ura, 2009; McLain and Beard, 1998; Rhoads et al., 2010; Spangelo and Egeland, 1994). However, USVs have become an important tool for several missions including: intelligence surveillance ofcoasts, port and border security, autonomous searching, signals transmission between air and underwater vehicles, and submarine protection. The challenges posed by USVs include how to increase the efficiency of path planning and obstacle avoidance to allow capable navigation for the USVs in complicated environments (Campbell et al., 2012; Steimle and Hall, 2006; Yan et al., 2010).
Path planning for an USV can be divided into two types of missions: path planning off-line in known environments, and real-time path planning for the USVs in unknown environments. For the first type, the trajectory should be globally optimized, and the algorithm is used off-line. Alternately, for the second type, the trajectory should probably be locally near-optimized, and the software architecture and sensors should be addressed inside the USV. In this paper, we study the second type of the missions. Despite the fact that the A* algorithm is a global path planning technique that needs complete details of the whole field of view of the workspace, however, it can search an optimal solution extremely fast and most efficiently (Dechter and Pearl, 1985; Svec et al., 2012). Therefore, the A* algorithm can be adopted in real-time missions instead of using a local path planning technique.
For obstacle avoidance, the Space and Naval Warfare Systems Center, San Diego developed the obstacle avoidance platform for the purpose of a high level autonomous navigation system for USVs. The USV obstacle avoidance system was being developed first by the team creating a world model based on various sensors such as visions, radars, and nautical charts (Ebken, 2005). The USV can avoid obstacles with the use of far-field deliberative obstacle avoidance and near-field reactive obstacle avoidance systems (Larson et al., 2007). The underlying path planning technique of the USV far-field deliberative obstacle avoidance system using a radar was an A* algorithm (Larson et al., 2006). By the time that Larson et al. had published their paper in 2006, a near-field reactive control was not yet implemented on the USV.
As previously mentioned, the USVs can avoid above-water obstacles that include: watercrafts or aircrafts by use of active sensor systems such as a camera or radar.However, it should have the ability to autonomously avoid obstacles that include: submerged obstacles such as piers, reefs, rocks, or submerged mines by use of an active acoustic sensor such as a multi-beam FLS. Unfortunately, at the current state of art of USVs, reliable methods that can avoid the submerged obstacles and accurate obstacle detection sonar sensors are still lacking. Much research has been done on the USV’s avoidance system using a camera or radar, but not as much research has been much on done on the multi-beam FLS.
With the recent reliable sonar technologies, most underwater obstacle avoidance platforms particularly use a high resolution multi-beam FLS. Petillot et al., (2001) described the framework for segmentation of sonar images, tracking of underwater obstacles (for AUVs). This framework was still applied to the design of obstacle avoidance and path planning systems for underwater vehicles based on a multi-beam FLS, although their obtained paths on real sonar images were very smooth and could handle changing workspaces. However, the path planning of this work was still performed in the vehicle reference frame and not in the world reference frame. Additionally, sonar serving, real-time motion estimation and vehicle localization for actual vehicles of this research were not studied.
The main contribution of this paper is to present a combination of an efficiency of an A* algorithm with the accuracy of an actual multi-beam FLS to serve as an advanced tool for the underwater obstacle avoidance platform. The underlying idea behind our path re-planning algorithm is an A* algorithm. However, an A* algorithm on its own does not have a re-planning ability that has to be used in real-time true unknown environment applications which include moving obstacles. Therefore, many consistent modifications and adjustments for the actual multi-beam FLS need to be developed and fully implemented. In addition, we have proposed a new concept constructing real-time pixel-based protection geometric shapes around the detected obstacles on the segmented sonar images in the field of view of the FLS, enabling safety motion of the USV along with a GPS. The performance of the proposed method has been verified through simulations and sea experiments.
2 Path re-planning algorithm
A well known and efficient path planning algorithm is the A* algorithm. It is an optimization algorithm with a modified best-first-search (BFS) strategy which uses heuristic cost estimations (Dechter and Pearl, 1985). In this paper, we used the pixel-based representation for each obstacle, and used the optimal circular shape fitting algorithm for each obstacle. Each obstacle in the sonar image is a constraint that the path planner must not cross the obstacle while minimizing the distance to the goal. We have represented the obstacle as a circle (only simulation) in the field of view of the sonar; it is called the “sonar view” in this paper. Our optimal circular shape fitting algorithm is applied to accomplish the represented obstacles. The start and goal pixels can be then assigned at any point within the sonar view. Beginning at the start pixel, an A* algorithm chooses one of the adjacent pixels surrounding the start pixel excluding obstacle pixels and previously moved ones. Anyhow, the question is which pixel does it select? The answer is the one with the lowest F(n) cost. The vital key to determine which pixels that have been generated to be the path is the following equation (Lester, 2005):

G(n) is the cost moving from a start pixel to a given pixel(n) within the sonar view. We have assigned G(n) cost as 1.0 (pixel) to each horizontally or vertically moved, and 1.4 (pixel) for diagonally moved, in the sonar view. H(n) is the estimated cost moving from that given pixel(n) to the goal pixel in the sonar view, this cost is often referred to as a heuristic. Our paths are generated by repeatedly going to goal based on the method of the open list and closed list (Lester, 2005) and selected the pixel with the lowest F(n) cost. In our assignment, each angle of a movement cost is 45 degrees and that is called the 4-geometry configuration (Jan et al., 2005). For real-time path re-planning with the 4-geometry, the running time for computation is fast, even though the path is only near-optimal. However, it can be acceptable in our system. In the near future, we will develop our system to the 8-geometry configuration that each node has 24 related neighbors. However, we have to consider a good compromise between performance and the computational time a priori.
The main aim of the development of our path re-planning algorithm is to particularly perform with the moving obstacle. The brief flowchart of our algorithm is shown in Fig.1. Before discussing this algorithm, the concept of transformations between the world and the vehicle frames should be explained. Fig. 2(a) shows the notation for goal-following control on a horizontal plane. X-Y is the world frame and Xv-Yv is the vehicle frame. Let X be the position vector of the vehicle on the world frame. S is the start point, G is the goal, for simplification we have defined G on the Y-axis, thus ψrapproaches zero, and GW is the position vector of the goal with respect to S, both on the world frame. The angles ψ, ψhand ψrcan be given as follows:

where ψris defined as the angular displacement reference of the ahead waypoint with respect to the Y-axis, ψℎis the heading of the vehicle that is calculated from the angle between the Y-axis and the forward speed of the vehicle (U0), also see Fig. 2(b), in the world frame, ψ is the deviation from ψr. As in Fig. 2(b), if the position of each waypoint; Pi-2, Pi-1, Piand so forth on the path does not change, it is called “planning mode”, therefore the sets of angles ψrof those waypoints are constant. If the position of eachwaypoint; Pi-2, Pi-1, Piand so forth on the path does change, this is caused by our re-planning algorithm, so we call this the “re-planning mode,” thus the sets of angles ψrof those waypoints are redefined every 1.6 s. Therefore, the yaw angle of the vehicle is controlled to follow ψrthat is:

Additional details of our path re-planning algorithm as a brief flowchart (Fig. 1), or pseudo-codes for our procedures are explained in the following steps:
1: Define the goal and start point on the world frame.
2: Calculate the result vector of the GW – X, that is the GV on the world frame; see Fig. 2(a).
3: Calculate the angle ψ, in this case; ψr= 0.
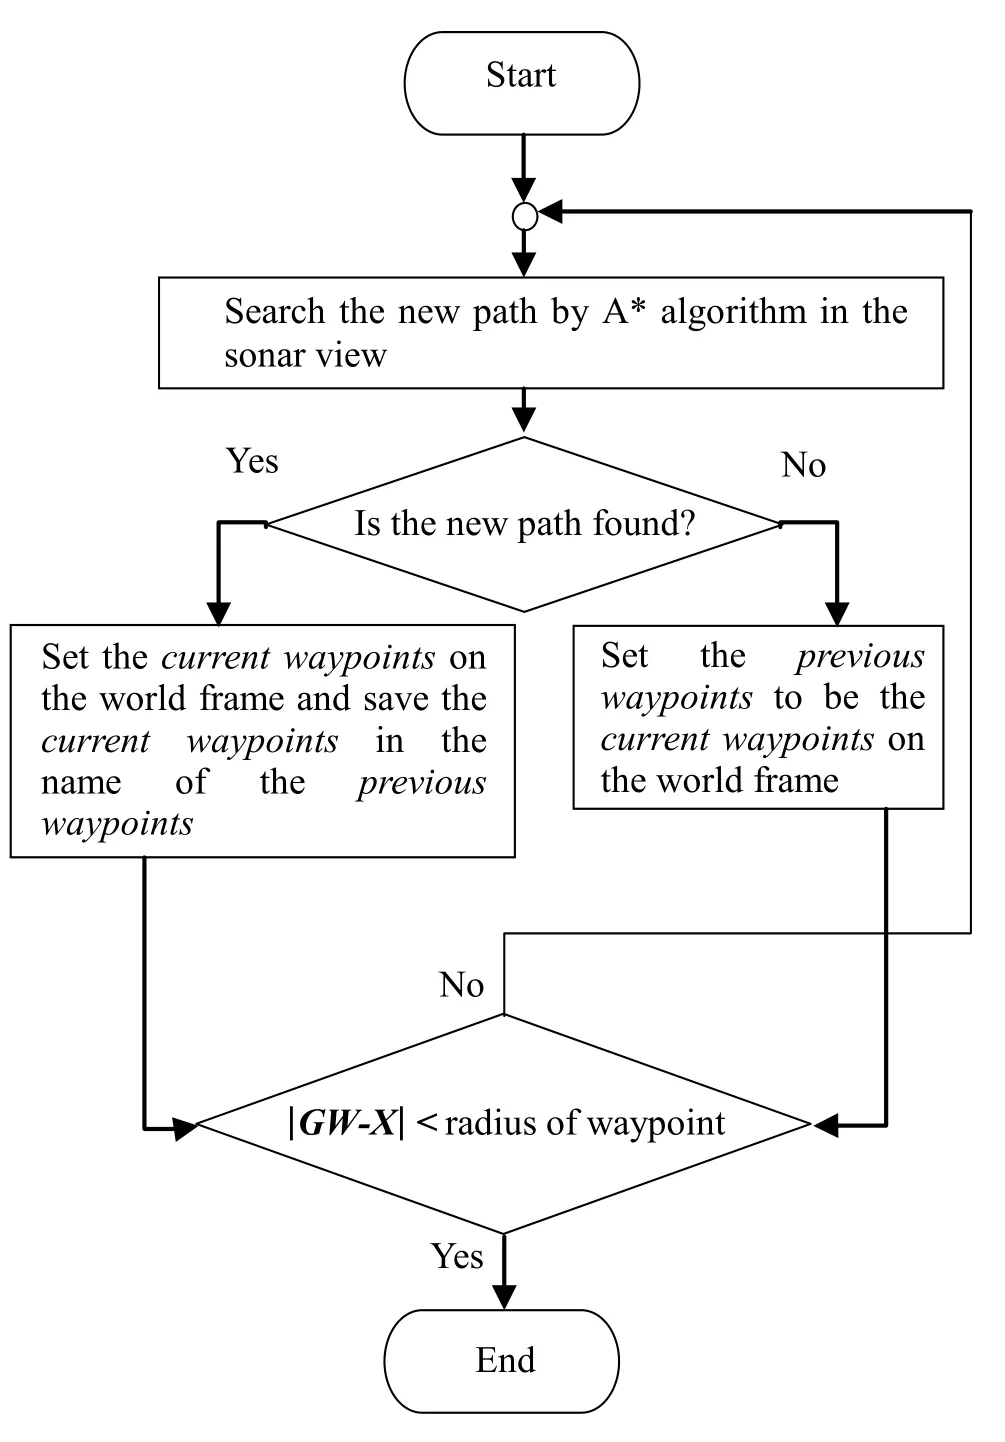
Fig. 1 Real-time path re-planning algorithm
4: Calculate the position vector of the goal on the vehicle frame (the sonar view); GV by this equation:

where RTis a transpose of the 2-D rotation matrix, that is: world frame.

6: Send a central position of the obstacle(s) from the world frame to the vehicle frame.
7: Simulate the obstacle(s) and the protection circle on the Image Processing Library (IPL) image (500×866 pixels) on the sonar view.
8: Define the region of the sonar view, which has a 120-degrees wide beam in a fan-shaped area, and a 30 meter range (the region of the sonar view is a constraint for an A* algorithm to search the path within this area of interest).

Fig. 2 The goal (a) and the traced waypoints (b) on the transformed coordinate
9: Set the goal and start points for an A* search within the sonar view.
10: Search the optimal path by an A* algorithm within the sonar view. If the path is found then display that path in the sonar view.
11: If the path is found, send the path information from the vehicle frame to the world frame. At the same time, define the distance interval between the waypoints (the found path) on the world frame as shown in Fig. 2(b).
12: On the world frame, if the path is found, calculate the position vector of the waypoint (Pi) for tracking; that is the PW by this equation;

5: Simulate the obstacle and the protection circle on thewhere PV is the position vector of the waypoint on the vehicle frame. X is the current position vector of the vehicle on the world frame, and R is the 2-D rotation matrix, that is:

12.1 : Count the number of the waypoints.
12.2 : Save the position of the current waypoints in the name of the previous waypoints (also see Fig. 1).
12.3 : Show the position of the current waypoints.
12.4 : If the path is not found:
12.4.1 : Set the position of the previous waypoints to be the position of the current waypoints.
12.4.2 : Show the position of the current waypoints.
13: Show the position of the obstacle(s) and the vehicle on the world frame.
3 Simulations of USV model avoidances
3.1 Software Architecture
The operating system of the main platform is Windows XPTM. The application software for the graphic user interface (GUI) and dynamic controls of the USV model are implemented with Visual C++, MicrosoftTMVisual Studio 2005. The software architecture consists of three levels:
High Level; this simulates a dynamic motion of the USV model. By the model-based simulation, the P controller is tuned to easily perform the controlled response with sufficient stability, without a derivative or an integral compensation. The optimal paths are updated every 1.6 s, or more and that depends on the optimization. As the application that will be operated in sea trials, the latitude and longitude of the USV model have been simulated and transformed to the Cartesian coordinates (world frame) and displayed in our GUI program.
Mid Level; this part includes shared memory segments between the High Level and the Low Level.
Low Level; this part consists of several threads that run with real-time multi-threads: the DeltaT Thread simulates the obstacle(s) in the sonar view and saves sonar images in JPEG format. This thread is ready to adapt to the FLS in the sea trials. The Path Finder Thread uses an A* algorithm to generate the optimal path between the start point and the goal point within the sonar view. The AHRS Thread simulates the heading of the USV model. Lastly, the Thruster Thread simulates thrust commands to control the vehicle model.
3.2 Waypoints tracking
To track waypoints, the USV model controls its dynamic motion with surge and yaw motion control as shown in Fig. 2(b). To avoid the underwater obstacle(s), the USV model independently controls its motion in 2-degrees of freedom, i.e. surge and yaw motion. It is assumed that roll and pitch motions are stable. For surge motion, we have defined the surge reference (SurgeRef) to control the USV model without sensory feedback data that it has been controlled by an open-loop. Our objective is that the surge speed should be constant; therefore the controller for surge motion is set by this relative:

Indeed, SurgeRef is set to be an integer (see in Section 5.3 for details). As for the yaw motion controls, the yaw reference (YawRef) is generated by the following equation, where Ky is proportional gain (Kondo and Ura, 2004);

3.3 Trajectory of the USV model
The A*-generated path has been dealt with on the pixel-based map, the main idea of Fig. 3 that tries to describe the conceptual scheme of our obstacle avoidance and path re-planning that is prepared for the use of USV in sea trials. As for our simulations: we have simulated the circular obstacle, the protection circle and the circular USV model with radius of robs, rproand rUSV, respectively. Furthermore, the multi-beam FLS has been assumed to be equipped in front of the USV model, and scans forward with a 120ºbeam width and 30 meters range.

Fig. 3. The conceptual scheme of obstacle avoidance and path re-planning
The position accuracy threshold of the GPS must also be considered in simulations and prepared for sea trials. In Fig. 3, it is not necessary to measure the curvature interval (S) at the centimeter level in the world frame by the GPS receiver. To easily adapt to the actual GPS, all pixels (1 pixel = 6 cm)from the A*-generated path should have been represented by some points to be sets of waypoints Pi-2, Pi-1, Pi, etc., then the curvature S between the waypoints Pi-1and Pietc., are adequately long, and then, the angle θ(s) is quite wide; these curvature intervals and these angles are optimal with the accuracy threshold of the GPS receiver. Consequently, the center of the USV model will enter the protection circle, or the actual trajectory will be generated inside of the protection circle. However, this concept still reduces a memory and time consumption. On the other hand, if all the pixels from the A*-generated path are taken to be sets of waypoints Pi-2, Pi-1, Piand so forth, and then the curvatures S between the waypoints Pi-1and Piand so forth are very short, and the angle θ(s) are very small, then the actual trajectory will not be generated on the inside of the protection circle. These settings are not optimal with the accuracy threshold of the GPS receiver. Therefore, we have approximately defined the curvature S between each waypoint as shown in Fig. 3, and we can approximately calculate the angle θ by the definition of the radian as:

Also, we have a cosine function of:

The safety distance (SD) in a case of both the centre of the USV model is on the inside and the outside of the protection circle and can approximately be calculated by this relation:

3.4 Obstacle avoidances
As with Fig. 4(a), the simulated static circular obstacle (denoted as red spot), and the protection circle (light-blue circular region) are shown in the sonar view, the radii of the obstacle and protection circle are 0.5 m, 3.5 m, respectively. An A* algorithm has generated the path denoted as a yellow line linked between the start and the goal points in the sonar view.
For simulation, the geographic latitude and longitude of the USV have been simulated and transformed to the X−Y coordinate (the world frame). Then, we have defined the start and goal points at (X, Y) = (0, 0) and (X, Y) = (0, 20 m), respectively, and their radii of waypoints of 0.50 m. The static circular obstacle has been simulated and its centre is located at (X, Y) = (0, 10 m). The curvature S has been approximately defined as 1.3 m (see Fig. 3). Fig. 4(e) has shown the path with multiple waypoints between the start and goal points; for this scenario, the sets of waypoints have been generated in the world frame, at 3 s. The USV model is denoted as a blue circle (rUSV= 0.5 m).
In Fig. 4(b), at 26 s, with the sonar view, the new position of the goal and the obstacle with respect to the vehicle is computed and set. The result is that they have been moved forward with the sonar head with respect to the vehicle frame. At the same time; in the world frame, as with Fig. 4(f), the (new) current waypoints are found and shown (light-blue circles) on the right side of the obstacle that unlike with the previous waypoints that were shown on the left side of the obstacle. Now, the USV model tracks those current waypoints by turning right to avoid the obstacle with 27.3 degrees heading.
In Fig. 4(c): with the sonar view, at 35 s, an A* algorithm attempts to find the new path; but the new path cannot be found because the USV model’s current position is within the region of the protection circle (see Fig. 3). The start point in the sonar view is concealed by the protection circle area, so an A* algorithm does not know its own start point; the result is the new path does not exist. At the moment, in Fig. 4(g), there is no path, therefore the previous waypoints have been set to be the position of the current waypoints as our path re-planning algorithm (Fig. 1) and are shown as magenta circles.
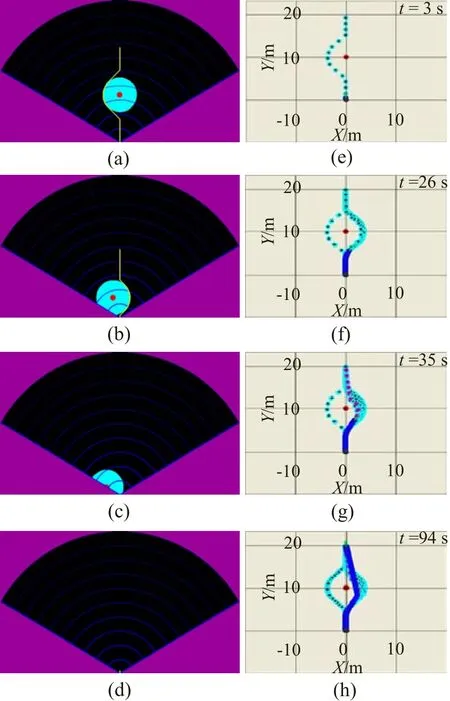
Fig.4 Example of paths generated on a sequence of segmented sonar images to avoid the static circular obstacle in the sonar view, (a) at 3 s, (b) at 26 s, (c) at 35 s and (d) at 94 s. Their waypoints and trajectories generated in the world frame, (e) at 3 s, (f) at 26 s, (g) at 35 s and (h) at 94 s
In Fig. 4(d), with the sonar view, having been released from the region of the protection circle, there is no obstacle.At 94 s, an A* algorithm has generated a very short path; it means that the USV model has arrived at the goal point already. At the moment as in Fig. 4(h), in the world frame, the USV model also has reached the goal at (X, Y) = (≈ 0 m, 19.68 m). Compared with its defined goal (X, Y) = (0.0 m, 20.00 m), it has a position error less than 0.5 m (radius of waypoint), because the waypoint hit condition has been defined as the equation in Maki et al., (2007) using the radius of the waypoint to be a constraint for its terminal condition of the vehicle. The trajectories of the USV model have been depicted as shaded blue lines.
To clarify the limitation and applicability of the proposed path re-planning method: the time history of the SD of the different size of static obstacles has been added for the simulation results. Fig. 5 shows the time history of the SD that was calculated from (12); the different size of static obstacles. With the position of the USV model at the start and goal points, position of the obstacle, radii of the protection circle and the USV model are specified as before, and the average surge speed of the USV model: U0is assigned as 0.22 m/s. With these assignments, if the radius of the obstacle;

Fig. 5 SD with different sizes of obstacles
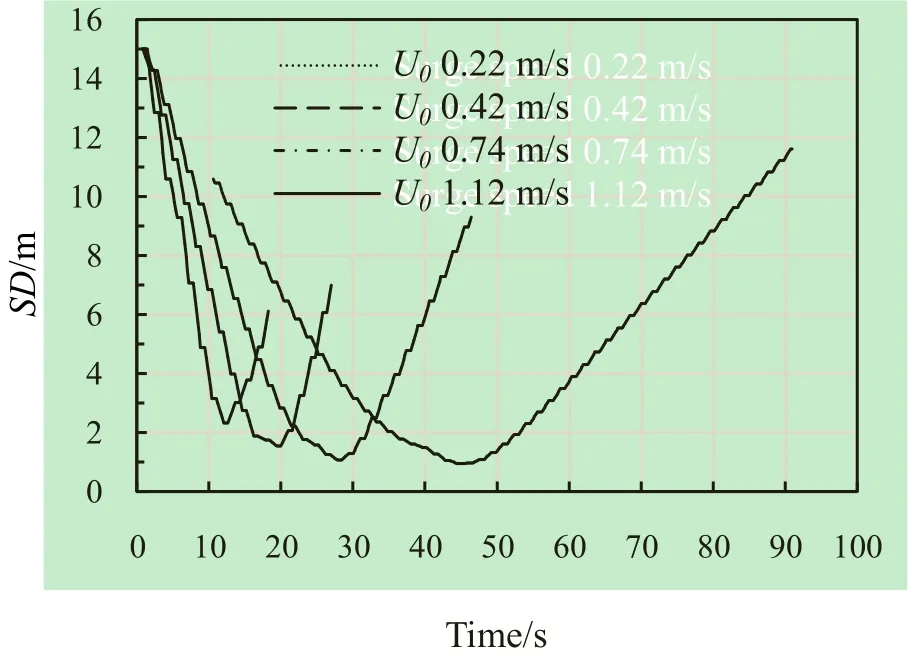
Fig. 6 SD with different surge speeds of the USV model
robsis enlarged to 1.5 m, the USV model will increase the risk of obstacle collision, especially at (approx.) 50 s. Figure 6 shows the time history of the SD of different average surge speeds of the USV model, U0, meanwhile the obstacle head-on moves to the USV model with U0= 0.11 m/s. Also, the radii of the obstacle, the protection circle and the USV model are specified as 0.5 m, 3.5 m and 0.5 m, respectively, and the USV model's position at the start and goal points are specified as before. This demonstrates that the minima SD(s) has been less affected by the surge speed variation at low speeds, however, at a high surge speed (approx. 1.12 m/s), the heading of the USV model has been more fluctuated, and therefore, it does have an effect on the stability and performance of the vehicle, this is the limitation.
To enhance the effectiveness of the proposed algorithm, we have dealt avoidances with multiple static obstacles and a moving obstacle. Fig. 7 and 8 show their overall avoidance trajectories, respectively. For moving obstacle avoidance that is consistent with meeting head on; rules of the road (Larson et al., 2006).
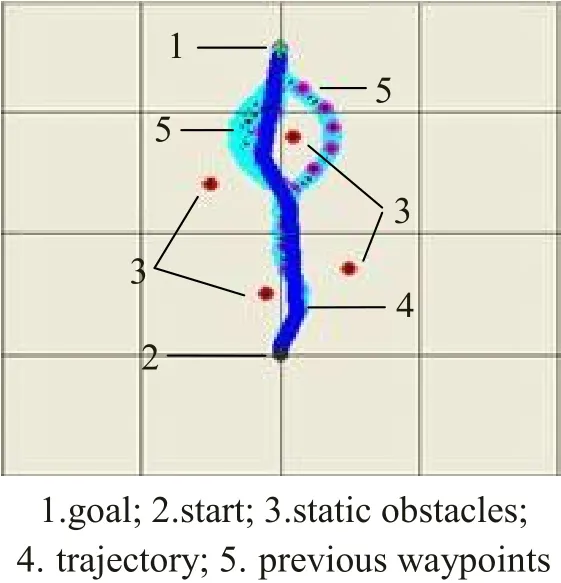
Fig. 7 Avoidance trajectory of the USV model with multiple static obstacles

Fig. 8 Avoidance trajectory of the USV model with a moving obstacle
To verify the effectiveness of the proposed method with a challenge, the environment with the local minimum has been carried out. In the sonar view, Fig. 9(a), the protection circles have been adapted to the protection ellipses, each ofthe obstacles’ positions has been assigned at close range, and then, their protection ellipses are overlapped and formed to be the local minimum region, also the goal point of the USV is assigned to the local minimum region. Fig. 9(b) shows its overall avoidance trajectory of the USV for the local minimum environment in the world frame.
4 Sonar images processing and noises
This step is a maneuver used with actual multi-beam FLS in our pool, which has been prepared for detection of actual obstacle(s) at undersea environments. We have collected sonar images of a cubic pool wall (each side of a cubic is 8 m long) that are taken by the ImagenexTMDeltaT multi-beam sonar (Imagenex Technology Corp., 2011). It has the following characteristics; number of beams: 120, and 500 range bins per beam; vertical beam-width: 3º; operating frequency: 260 kHz; weight in water: 3.8 kg; range scales: 5-100 m; sector size: 120º; file format for beam data: *.83B; interface to PC: 10 Mbps Ethernet (10Base-T) using TCP/IP.

Fig. 9 Protection ellipses are overlapped to build the local minimum region in the sonar view (a) and the avoidance trajectory for the local minimum in the world frame (b)
The intensities of the beams data (yellow shades) of the pool’s wall are shown in Fig. 10(a) (sonar scanned downward; range scale of sonar: 10 m). A common segmentation for the sonar image consists of filtering and thresholding (Petillot et al., 2001). Our filtering is in charge of the ImagenexTMDeltaT sonar functions; in this sonar, various filter settings could be used depending on the bottom type or in the water column. We have chosen to use the remove short outliers filter technique described in Imagenex Technology Corp., (2011) to remove noises, or unwanted targets above the bottom and in the water column which yields good results. Moreover, practically, workspace representation has been added in segmentation; we have decided to represent the obstacles as ellipses from the real obstacles contours based on the pixel representation and our optimal elliptic matching algorithm, see Fig. 10(b). For thresholding; the threshold value is derived with the fixed thresholding; this technique is used in our sonar images. Therefore, the intensities of the beams have been represented and fixed with red ellipses on the segmented image; also see Fig. 10(b). Then, protection ellipses (adapted from the protection circle) have been built as boundaries (light-blue shades) enclosing red ellipses (obstacles) on the segmented image in Fig. 10(c). The pool’s wall has been used to represent obstacles; however, these steps are just meant to exhibit our sonar image processing. Anyway, noises still remained in the pool test, because sonar images in the pool were significantly degraded by multipath interference, therefore, the sonar head had been tested to scan horizontally a cylindrical obstacle (piling) in the sea to reduce short outliers above the bottom and multipath interferences. A very clear segmented sonar image had been obtained as a result as shown in Fig. 10(d); it still showed the obstacle (red ellipse) and the protection ellipse (light-blue) with a range of 10 m.
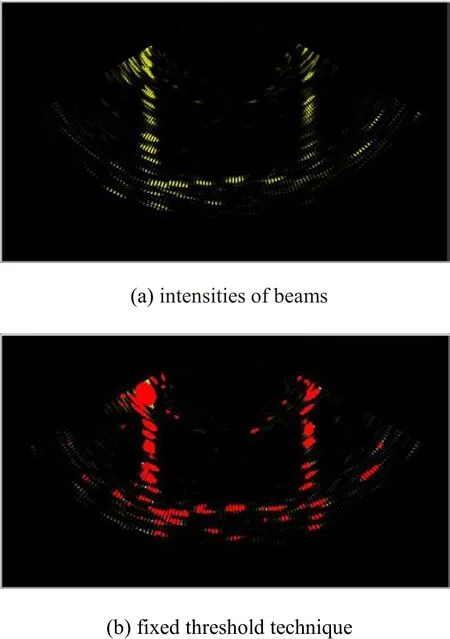
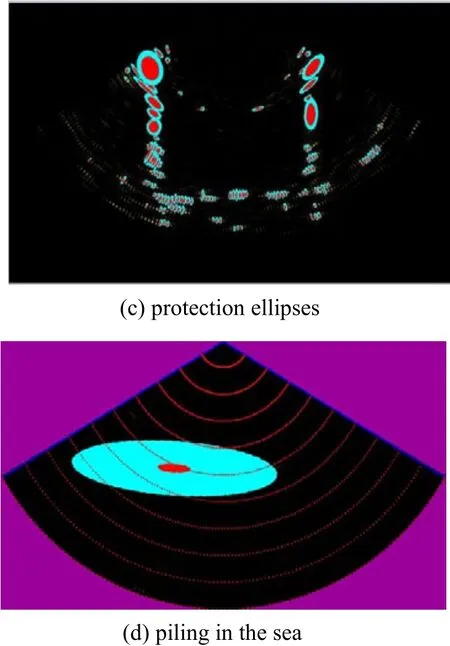
Fig. 10 The intensities of the beams sonar data of the pool’s wall (a), the fixed threshold technique on the segmented sonar image (b), protection ellipses on the segmented sonar image (c) and the piling in the sea on the segmented sonar image (d)
5 Sea experiments
After simulations, in order to verify the performance of the proposed method, the real undersea obstacle avoidance of the USV has been carried out at the port of Abu-ratsubo, Misaki marine biological station, the University of Tokyo, Kanagawa, Japan. The depth of the sea at this port is around 6 m and it also has a pier. Then, the square pier (4 m × 4 m) at this port was chosen to test our USV.
5.1 The USV
Surge and yaw motions of our catamaran USV can be independently controlled by two thrusters. The USV consists of a hull for computers, sensors, electronics devices and batteries. The USV is equipped with CrossbowTMNAV440CA-202 that it is a fully-integrated combined GPS navigation and GPS-aided Attitude and Heading Reference System (AHRS), and provides yaw angle and GPS positioning, along with the computed velocity of the USV. The ImagenexTMDeltaT multi-beam sonar has been equipped and submerged at 0.23 meters below sea level, in front of the USV to scan an undersea obstacle with a 120º horizontal beam-width, 3º vertical beam-width and 30 m range. The appearance and specifications of the USV are shown in Fig. 11 and Table 1, respectively.
5.2 Hardware and software system
The core of the USV hardware is the main computer interfaced with the FLS, AHRS, thruster controller and the wireless LAN adapter. The wireless LAN is used to send a start command to the USV from the port. A thruster controller box and the CrossbowTMNAV440CA-202 are connected to the main computer via USB cables. The Hardware diagram of the USV is shown in Fig. 12. For software, we still use the architectural concept model of three programs, the same as the simulations to perform with the actual USV. We have adapted from the Low Level for real-time dynamics of the USV. Therefore, 3 threads have been adjusted for sea trials that include: The AHRS Thread, it has been adapted for actual AHRS to measure the real-time actual heading of the USV. The Thruster Thread has been adapted to control the actual thrusters of the USV to track the GPS-based waypoints in real time. And, the DeltaT Thread that sends the external control (EC) commands to the beam-forming computer via TCP/IP and receives the 83B (range/angle) datagram message for each real-time ping, these datagram are used for segmentations (filtering, thresholding and workspace representation) in the sonar view. These procedures have been used instead of the steps; 5-7 (which the obstacle(s) was simulated) in the path re-planning algorithm, in Section 2.
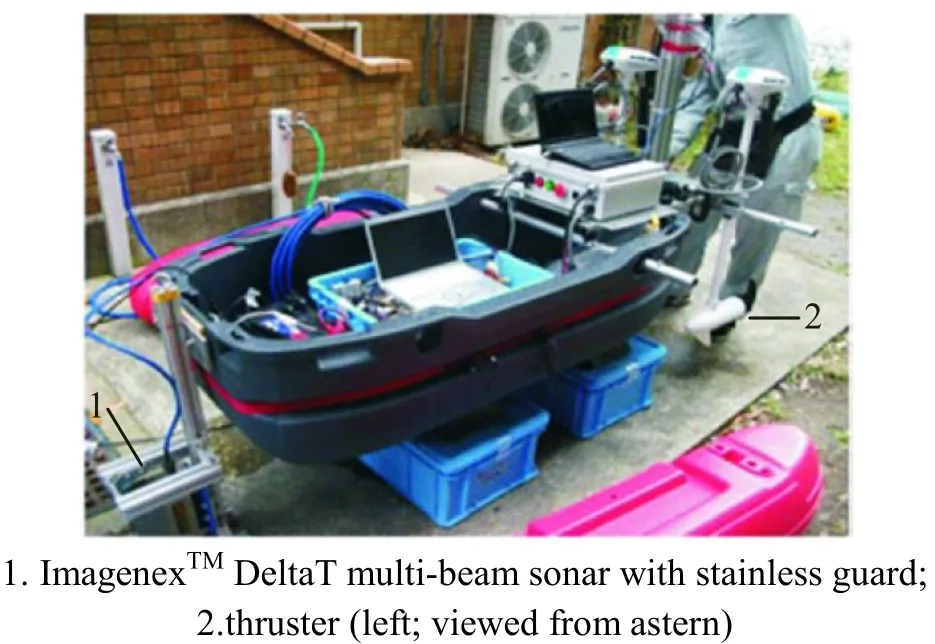
Fig.11 The USV was being verified and assembled with all the components before the sea trials
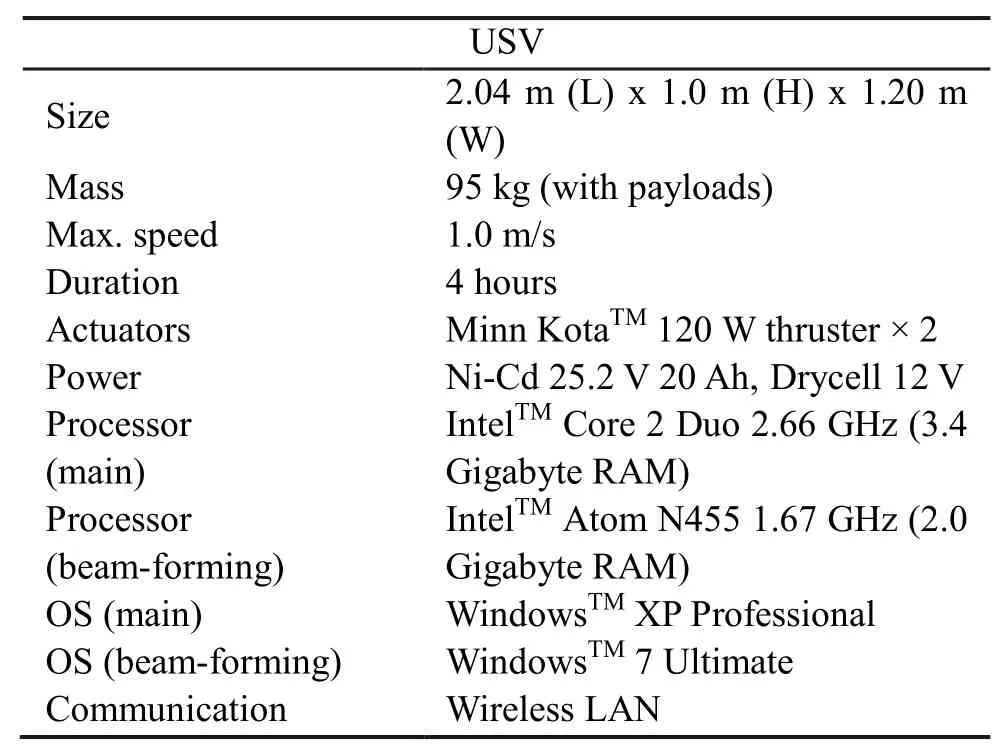
Table 1 USV specifications

Sensors Heading, position, velocity CrossbowTMNAV440CA-202 Multi-beam sonar ImagenexTMDeltaT
5.3 Control scheme
To track the GPS-based waypoints (generated path) for the undersea obstacle avoidance of the USV, it is controlled in 2-degrees of freedom (surge and yaw) independently. The P controller for the yaw motion controls the yaw output by YawRef as defined in (9); also see in (2) and Fig. 2(b). The angular feedback data from CrossbowTMNAV440CA-202 (AHRS) are added into the yaw motion control as shown in Fig. 13. Figure 14 shows as an example of the control result of the yaw control.
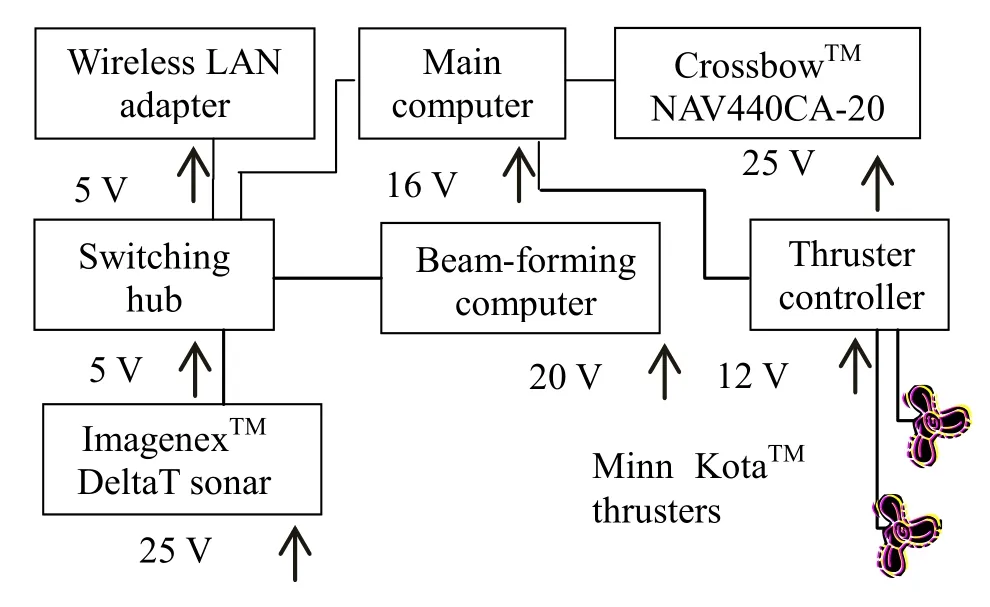
Fig. 12 Hardware diagram of the USV

Fig. 13 Block diagram of the yaw control of the USV
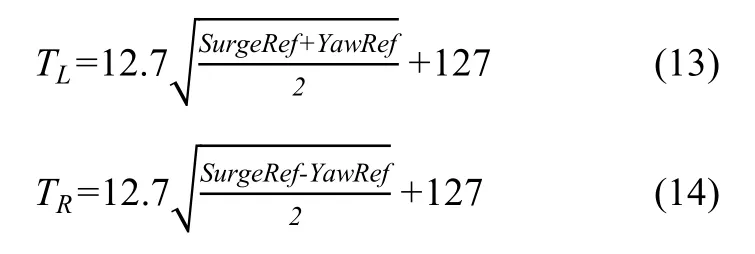
For the thruster control scheme of the USV, we have defined the thrust command (integers; 0-255) of each thruster that is calculated by the following equations:
where TLand TRare the thrust command for the left and the right thrusters, respectively. The SurgeRef is set as a constant in the sea experiments as (8). The YawRef is deviated in the sea experiments as (9) The SurgeRef and the YawRef are both integers that have been defined as a range of -100 to 100. To avoid square roots of negative numbers that are they have been redefined as TL,R= -12.7The thrust commands have been transformed to the percentage of the duty cycles of the pulse-width modulation (PWM) technique control for two thrusters, such as thrust commands; 0-126 request 0 % to 49 % duty cycles (propeller rotates anticlockwise to propel the vehicle backward when viewed from astern, see Fig. 11; 129-255 request 51% to 100% duty cycles (propeller rotates clockwise to drive the vehicle forward). For optimization in practice, if the thrust command is set to the range of 127 and 128, the propeller will be stopped. For instance, we define SurgeRef = 50 and YawRef = -60, then TL= 98(98.6) (left propeller rotates anticlockwise) and TR= 221 (right propeller rotates clockwise), and then the vehicle is turned to the left with a constant surge speed. The non-linear relation between the thrust command and the resulting thrust force for each propeller is shown in Fig. 15. Indeed, our USV can move backward by setting the range of SurgeRef to be from −100 to +100, however, the vehicle has been tested in only a forward motion. Although on the test date, the USV was disturbed by winds and currents, it still was controlled automatically with the less drift based on the highly accurate built-in GPS of the CrossbowTMNAV440CA-202: position accuracy < 3.0 m with a measurement of circular error probability, CEP; velocity accuracy with 1PPS ±50 ns.
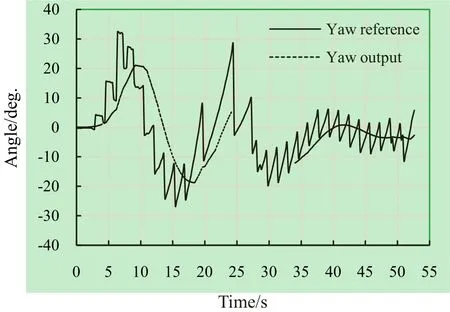
Fig. 14 Example of yaw output with feedback control
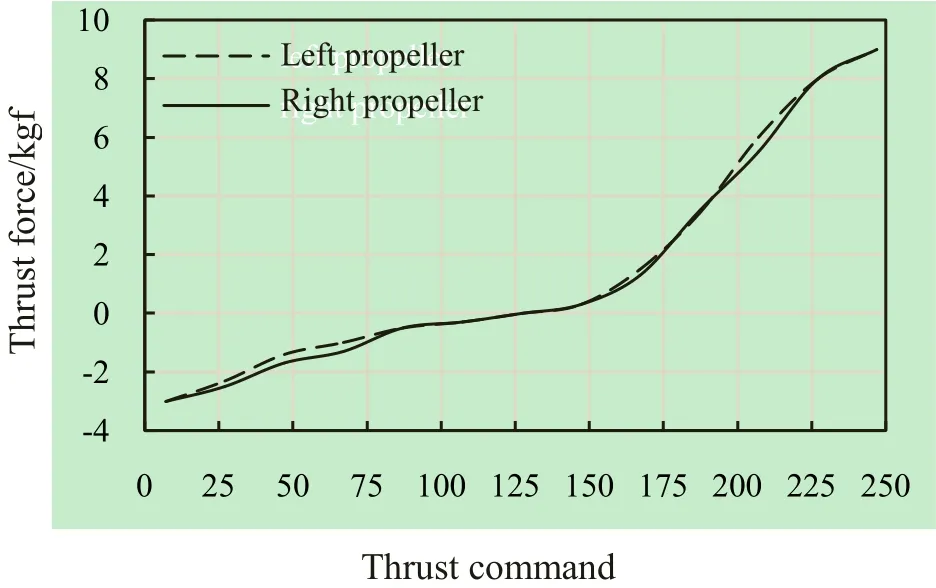
Fig. 15 Relation between thrust command and thrust force
5.4 Straight line cruising
Firstly, we examined or not the USV could cruise a straight line without any undersea obstacle. Unfortunately, on the trial date, the wind blew from North-East to South-West with a speed of approximately 10 km/h, there were also small wavelets. However, we needed to ensure its validation and verified that all of the USV components worked properly.
The USV was specified to move from the start (S) at (X, Y) = (0 m, 0 m) to the target; G at (X, Y) = (11 m, 0 m), with a radius of waypoints of 0.65 m. The near-optimal trajectory is illustrated in Fig. 16 (the radius of the start and goal points were shown as dotted-circles, and the arrow showed the wind direction).

Fig. 16 Near-optimal straight line trajectory of USV
As illustrated in Fig. 16, the average value of the trajectory (in the Y direction) is 0.17 m, and the standard deviation (1-σ) is 0.44 m. As these values indicate, the resulting trajectory can be fairly accepted, while the fluctuations of winds and currents are so strong. We also have recorded the thrust commands of this trial, and then the thrust commands for the left and the right thrusters are shown in Fig. 17. Fig. 15. Thus the average thrust forces acting on the left propeller and the right propeller are approximately 0.4 and 0.2 kgf, respectively. This is consistent with the velocity of the USV in the East-West direction (the X-axis) and the North-South direction (the Y-axis) that is measured by the built-in GPS receiver of the CrossbowTMNAV440CA-202 as shown in Fig. 18. The average value of the velocity in the EW direction and its standard deviations (1-σ) are 0.31 m/s and 0.14 m/s, respectively, and the average value of the velocity in the NS direction and its standard deviations (1-σ) are 0.02 m/s (scarcely moved) and 0.11 m/s, respectively.
5.5 Undersea obstacle avoidance
As mentioned above, we have chosen the pier to be the undersea obstacle to test the proposed method with the USV. An example of path planning of the segmented sonar image on the vehicle frame is given in Fig. 19.
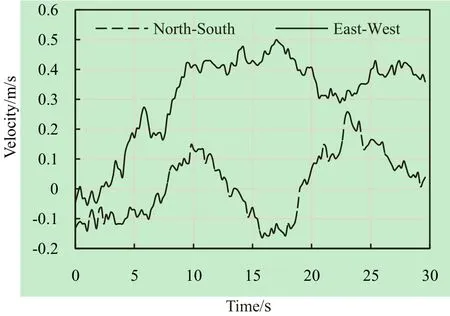
Fig. 18 Velocity of the USV in the EW and NS directions
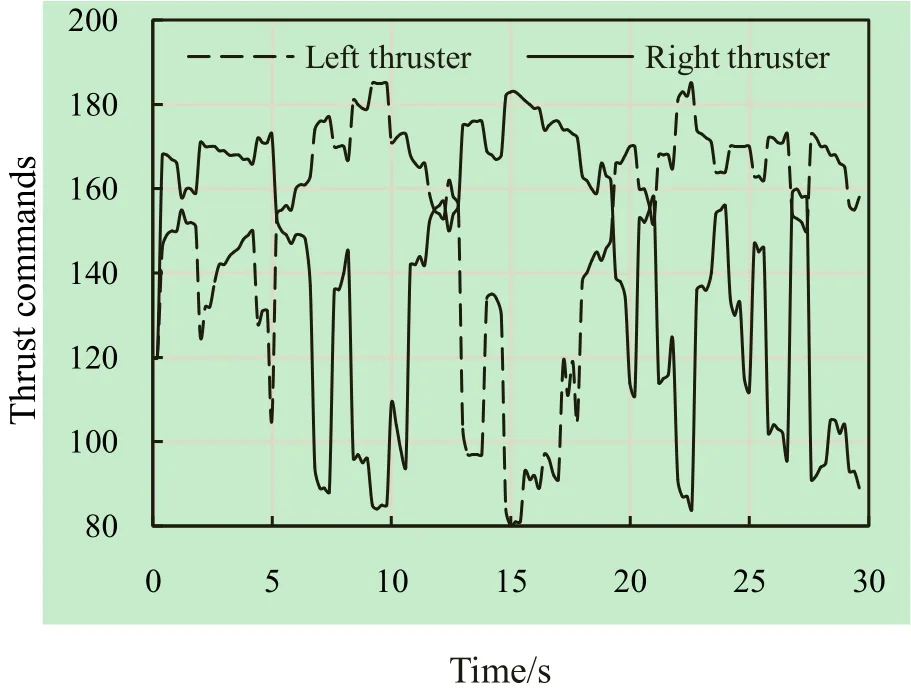
Fig. 17 Thrust commands of USV for straight line cruising.
As shown in Fig. 17, the average values of the thrust commands of the left thruster and the right thruster are 150.42 and 141.03, respectively; and their standard deviations (1-σ) are 26.87 and 30.89, respectively. The relation of the thrust command and thrust force is shown in
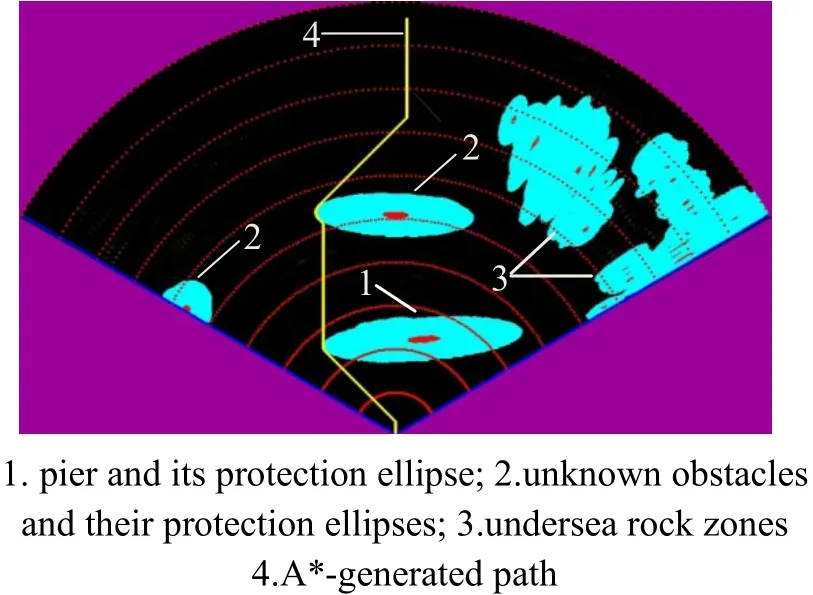
Fig. 19 Example of path planning of segmented image.
As illustrated in Fig. 19, the obstacle image of the pier scanned by the ImagenexTMDeltaT sonar (range: 30 m) that differs from the above-water pier (see Fig. 21). It also has the unknown undersea obstacles that emerge in the sonar image behind the pier spot which cannot be detected above the sea surface.
The positive function of the obstacles (ellipses) and their protection ellipses have been defined (Petillot et al., 2001);

where a and b are the half-major axis and the half-minor axis of the ellipses, respectively, and p is the point of the pixel-based coordinates (x, y) in the area(s) enclosed by the elliptical obstacle(s) within the sonar view and depends on the time t in ℝ3(t is the third dimension). In the case of the sea trials, the values of a and b of the elliptical obstacles acquire from the acoustic ability to identify the obstacles (the red spot in Fig. 19) in the sonar view. Their protection ellipses are chosen and assigned with the optimal values that are consistent with undersea obstacle avoidance for USV in real environments. Unlike simulations as seen in Fig.3 and Fig. 4, we have set: robs= a = b; this is the radius of the circular obstacle, and rpro= robs+ pd; this is the radius of the protection circle as mentioned where pd is the protection distance.
For the undersea obstacle avoidance experiment in the world frame, the USV is assigned the start point: S at (X, Y) = (−15.0 m, 0 m) and the destination (G) at (X, Y) = (13.8 m, 0 m), with the radii of the waypoints of 0.5 m. The sub-optimal avoidance trajectory is shown in Fig. 20; the radii of the start and goal points are shown as tiny dotted-circles, a square is shown to be the pier (above-water), and the arrow is the wind direction.

Fig. 20 Sub-optimal avoidance trajectory of the USV
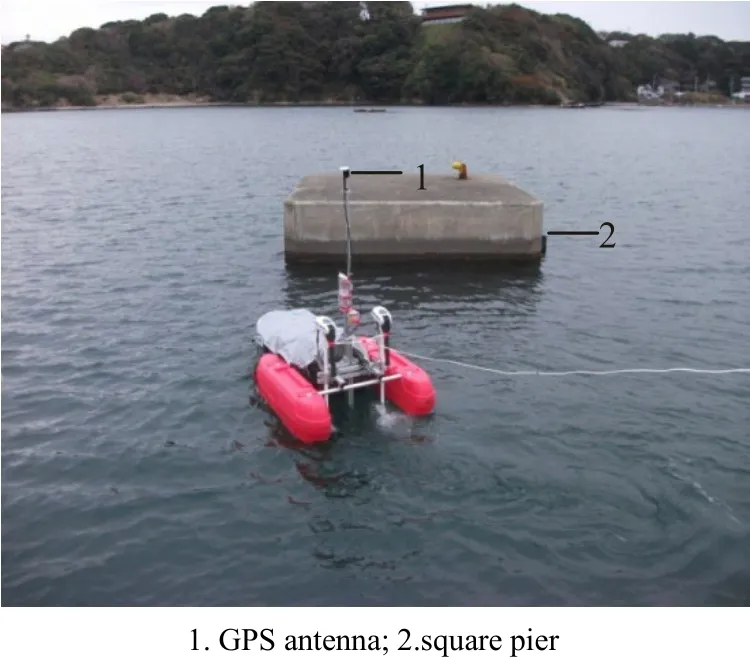
Fig. 21 The USV is avoiding the obstacle (pier) at the sea experiments.
The snapshot of the USV that is automatically avoiding the obstacle (pier) during the sea trials is shown in Fig. 21. Notice that a rope is tied to the USV in case of emergency, and all computers and electronics devices are enfolded by a plastic cloth to protect them from the sea water during the experiments.
6 Conclusion
In this paper, an A* algorithm has been adopted to show that it can be applied in frameworks for real-time performing 2D underwater obstacle avoidance and path planning for the USV based on a multi-beam forward looking sonar that has been successfully completed in simulations. For sea experiments, the proposed method was implemented with the actual USV. The USV was automatically controlled and succeeded in its real-time avoidance against the stationary undersea obstacle that the sonar images were captured in the field of view of the FLS together with the GPS attached on the USV.
Acknowledgements
The authors thank the Ura laboratory members, especially Dr. Kangsoo Kim at the Institute of Industrial Science, the University of Tokyo for their help in theories and experiments. The authors also thank Prof. Hayato Kondo, Dr. Jin-Kyu Choi, Mr. Takeo Hotta and students at the Kondo laboratory, Tokyo University of Marine Science and Technology for their invitation and assistance. The authors would like to thank Mr. Kevin Marshall of the Language Center, Songkhla Rajabhat University for his proofreading. This research has been supported by the Ministry of Science and Technology of Thailand.
Campbell S, Naeem W, Irwin GW (2012). A review on improving the autonomy of unmanned surface vehicles through intelligent collision avoidance maneuvers. Annual Reviews in Control, 36, 267-283.
Dechter R and Pearl J (1985). Generalized best-first search strategies and the optimality of A*. Journal of ACM, 32, 505-536.
Ebken J (2005). Applying unmanned ground vehicle technologies to unmanned surface vehicles. Technical Report, DTIC Document.
Gao J, Xu D, Zhao N, Yan W (2008). A potential field method for bottom navigation of autonomous underwater vehicles. Intelligent Control and Automation, Chongqing, 7466-7470.
Imagenex Technology Corp. (2011). DeltaT multi-beam sonar system model 837/A/B. Port Coquitlam, British Columbia, Canada.
Jan GE, Chang KY, Gao S, Parberry I (2005). A 4-geometry maze router and its application on multi-terminal nets. ACM Trans. on Design Automation of Electronic Systems, 10, 116-135.
Kim K, Ura T (2009). Optimal guidance for autonomous underwater vehicle navigation within undersea areas of current disturbances. Advanced Robotics, 23, 601-628.
Kondo H, Ura T (2004). Navigation of an AUV for investigation of underwater structures. Control Engineering Practice, 12, 1551-1559.
Larson J, Bruch M, Halterman R, Rogers J, Webster R (2007). Advances in autonomous obstacle avoidance for unmanned surface vehicles. AUVSI Unmanned Systems North America 2007, Washington DC.
Larson J, Ebken J, Bruch MH (2006). Autonomous navigation and obstacle avoidance for unmanned surface vehicles. SPIE Proc. 6230: Unmanned Systems Technology VIII, Defense Security Symposium, Orlando, 17-20.
Lester P (2005). A* Path finding for Beginners. http://www.policyalmanac.org/games/AStarTutorial.htm.
Maki T, Mizushima H, Kondo H, Ura T, Sakamaki T, Yanagisawa M (2007). Real time path planning of an AUV based on characteristics of passive acoustic landmarks for visual mapping of shallow vent fields. Proceedings of MTS/IEEE OCEANS2007, Aberdeen, 1-8.
McLain TW, Beard RW (1998). Successive Galerkin approximations to the nonlinear optimal control of an underwater robotic vehicle. Proceedings of the 1998 IEEE International Conference on Robotics & Automation, 762–767.
Petillot Y, Ruiz IT, Lane DM (2001). Underwater vehicle obstacle avoidance and path planning using a multi-beam forward looking sonar. IEEE Journal of Oceanic Engineering, 26(2), 240-251.
Rhoads B, Mezic I, Poje A (2010). Minimum time feedback control of autonomous underwater vehicles. Decision and Control, Georgia, 5828–5834.
Spangelo I, Egeland O (1994). Path planning and collision avoidance for underwater vehicles using optimal control. IEEE Journal of Oceanic Engineering, 19, 502–511.
Steimle E, Hall M (2006). Unmanned surface vehicles as environmental monitoring and assessment tools. MTS/IEEE OCEANS’06, Boston, 1–5.
Svec P, Thakur A, Shah BC, Gupta SK (2012). USV trajectory planning for time varying motion goals in an environment with obstacles. ASME 2012 IDETC and CIE Conference, Chicago, 1-11.
Yan RJ, Pang S, Sun HB, Pang YJ (2010). Development and missions of unmanned surface vehicle. Journal of Marine Science and Application, 9(4), 451–457.
Author biographies
Toshihiro Maki received his Ph.D. in Environmental and Ocean Engineering from the University of Tokyo in 2008. He is an Associate Professor in the Underwater Technology Research Center at the Institute of Industrial Science, the University of Tokyo. His research interests include underwater robotics, platform systems, informatics, and observation strategies. He is a member of IEEE OES.
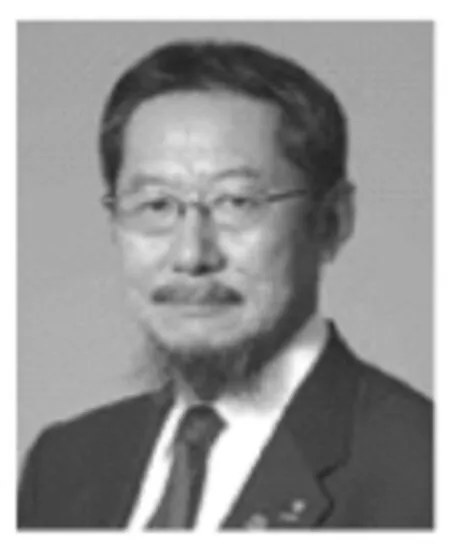
Tamaki Ura received his B.S. and M.S. and Ph.D. degrees in Naval architecture from the University of Tokyo, Tokyo, Japan, in 1972, 1974 and 1977, respectively. He was a Professor of the Institute of Industrial Science (IIS), the University of Tokyo where he also had been the Director of the Underwater Technology Research Center, since 1999. He has developed several AUVs such as‘R-One’ and ‘r2D4’.

Takashi Sakamaki is an Associate Researcher of Maki laboratory at the Institute of Industrial Science (IIS), the University of Tokyo, Tokyo, Japan. He develops and contributes several AUVs such as ‘r2D4’, ‘Tri-Dog 1’, ‘Tri-Ton’, ‘Tuna-San’, etc. His work involves a mechanism and electricity for AUVs and USVs technologies.

Pattara Aiyarak received his B.Sc. in Physics from Prince of Songkla University, Thailand in 1995. He received his Ph.D. in Physics at the University of Essex, United Kingdom in 2000. He is currently an Assistant Professor at the Department of Computer Science, Faculty of Science, Prince of Songkla University, Songkhla, Thailand. His research interests are in artificial intelligences and robotics.
1671-9433(2014)01-0105-12
Phanthong
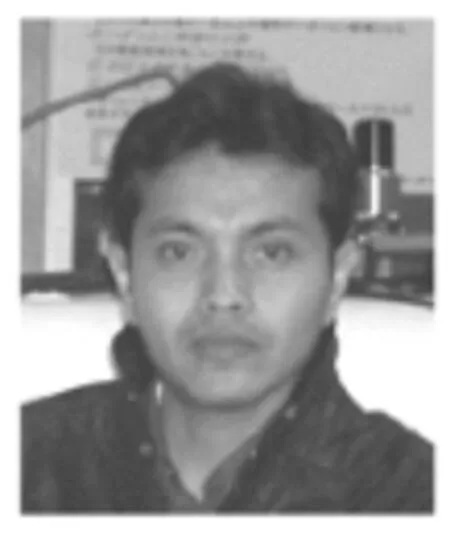
his B.Sc. and M.Sc. degrees both in Physics from Prince of Songkla University in 1995 and 2004, respectively. He is a Ph.D. candidate at Department of Physics, Faculty of Science, Prince of Songkla University, Songkhla, Thailand. His research interests are in sonar image processing, underwater vehicle motion control and obstacle avoidance system.
Received date: 2013-07-08.
Accepted date: 2013-10-19.
*Corresponding author Email: thanapong.phanthong@gmail.com
© Harbin Engineering University and Springer-Verlag Berlin Heidelberg 2014
