Numerieal Prediction of Storm Surge in the Qingdao Area Under the Impact of Climate Change
2014-05-05FENGJianlongJIANGWenshengandBIANChangwei
FENG Jianlong, JIANG Wensheng,, and BIAN Changwei
1) Physical Oceanography Laboratory, Ocean University of China, Qingdao 266100, P. R. China
2) Laboratory of Marine Environment and Ecology, Ocean University of China, Qingdao 266100, P. R. China
Numerieal Prediction of Storm Surge in the Qingdao Area Under the Impact of Climate Change
FENG Jianlong1), JIANG Wensheng1),2),*, and BIAN Changwei1)
1) Physical Oceanography Laboratory, Ocean University of China, Qingdao 266100, P. R. China
2) Laboratory of Marine Environment and Ecology, Ocean University of China, Qingdao 266100, P. R. China
A typhoon-induced storm surge simulation system was developed for the Qingdao area, including a typhoon diagnostic model for the generation of wind and pressure fields and a 2D Advanced Circulation (ADCIRC) model for simulating the associated storm surge with a 200 m resolution along the Qingdao coastline. The system was validated by an extreme surge event Typhoon Mamie (8509) and the parameters of Typhoon Mamie were used to investigate the sensitivity of typhoon paths to Qingdao storm surges with four selected paths: the paths of Typhoons Mamie (8509), Opal, 3921 and 2413, the selection being made according to their relative position to Qingdao. Experiments based on the Typhoon Mamie (8509) storm surge were also conducted to study the possible influences of future climate changes, including the sea level rise and sea surface temperature (SST) rise, on storm surges along the Qingdao coast. Storm surge conditions under both present day and future (the end of the 21st century) climate scenarios associated with the four selected paths were simulated. The results show that with the same intensity, when typhoons follow the paths of 3921 and 2413, they would lead to the most serious disasters in different areas of Qingdao. Sea level and SST affect storm surges in different ways: sea level rise affects storm surge mainly through its influence on the tide amplitude, while the increased SST has direct impact on the intensity of the surges. The possible maximum risk of storm surges in 2100 in the Qingdao area caused by typhoons like Mamie (8509) was also estimated in this study.
storm surge; typhoon path; climate change; Qingdao
1 Introduction
As one of the most serious marine disasters in China’s coastal areas, the storm surge may cause heavy casualties and property losses (Feng, 1982; Yang, 2000). Qingdao, a coastal city with a population of over 8 million, is situated in Shandong Peninsula and facing the Yellow Sea (Fig.1). The city is vulnerable to storm surge. For example, the storm surge caused by Typhoon Mamie (8509) led to a direct economic loss of more than RMB 500 million, together with 29 deaths and 368 injured (Linet al., 1996). Storm surges in Qingdao are mainly caused by typhoons originating from the Northwestern Pacific. Statistics show that about 1.3 typhoons sweep the Qingdao area and induce storm surges causing disastrous damages every 5 years between 1898 and 1994 (Linet al., 1996). Therefore, studies on storm surges in the Qingdao area have important social and economic significance.
The storm surge is a long-period wave induced by extreme winds and air pressure gradients. The intensity of a storm surge and its impact on the coastal regions depend on the intensity and path of the storm, the characteristics of bathymetry and the properties of the water body (Shenet al., 2006a). It has been noticed in recent years that climate change in the future would play a critical role in increasing the intensity of a storm surge (Bengtssonet al., 2007; Dasguptaet al., 2009; Estebanet al., 2009). Several ways of estimating future storm surge levels have been used in recent years. Some researchers ran the regional atmospheric model for the past and future downscaled from a global model and drove the storm surge model to get the possible future storm surge trend (Pirazzoliet al., 2004; Woth, 2005; Karim and Mimura, 2008; Wanget al., 2008; Marcoset al., 2011). This method can predict the change of storm surge caused by extratropical cyclones well. Other researchers identified the most influential factors for the storm surge and drove the storm surge model with independently derived values of the factors (Brownet al., 2010).
It has been noticed that two important climate factors, the mean sea level rise and the sea surface temperature (SST) rise, will significantly influence the peak surge elevation by the end of the 21th century. Sea level rise has far-reaching impacts on low-lying coastal regions around the world and can greatly enhance the occurrence of coastal flooding caused by storm surges (Morriset al.,2002; Nicholls, 2002; Rybczyk and Cahoon, 2002; Tianet al., 2010), so it is very important to study the influences of sea level rise on future storm surges. The sea level began to rise in the middle of the 19th century (Houghtonet al., 2001; Miller and Douglas, 2004; Lombardet al., 2005; IPCC, 2007), with the rise rate ranging between 1.5 and 2 mm yr-1(Miller and Douglas, 2004) during the 20th century. According to two sea level rise scenarios provided by the State Oceanic Administration of China and the Intergovernmental Panel for Climate Change, the range of sea-level rise will be between 22 cm and 88 cm in 2100 (Chen, 1997; IPCC, 2007). The role of the SST in the genesis and intensification of tropical cyclones has been widely studied with the use of sophisticated global climate models, regional climate models and observations, and it is found that the intensity of typhoons increases with the SST rise (Emanuel, 1987; Holland, 1997; Knutson and Tuleya, 2004; Emanuel, 2005; Websteret al., 2005a, b; Elsneret al., 2008; Wu and Wang, 2008; Yanet al., 2012). Therefore the SST increase in the future will be able to strengthen tropical cyclones and then affect storm surges distinctly. A relationship between the SST and the intensity of typhoons (Emanuel, 1987) was used to calculate the change of typhoon wind fields due to the climate change. Studies (IPCC, 2007; Moon and Oh, 2010) show that the range of the SST rise is 2.0℃ to 4.0℃ in China seas by 2100.
Previous studies on the relationship between typhoon and storm surge suggested that the most destructive storm surge happens on the right side of the typhoon path when the path is perpendicular to the coastline (Mcinneset al., 2003; Averkiev and Klevannyy, 2010; Fenget al., 2012). But for a special area the shape of the shoreline will affects the storm surge greatly. Thus for the disaster mitigation in the future the influence of the typhoon paths on storm surge in Qingdao area is worth being studied.
This study first analyzed previous typhoon paths close to Qingdao and then studied their effects on storm surges. The storm surge 8509, which caused disastrous damages in Qingdao, was used as a base case to simulate the typhoon events under future scenarios. The simulated surge results were verified based on observation data in the Bohai Sea and the Yellow Sea. Then the effects of typhoon paths and climate change scenarios in 2100 on the possible maximum risk of storm surges were studied. Results with Qingdao (with a water depth of 18 m), Huangdao District (with a water depth of 5 m) and the top of the Jiaozhou Bay (with a water depth of 4 m) (Fig.2) were selected to analyze the effects of the different paths and two future climate factors on the surge inside and outside the Jiaozhou Bay. We studied the change of storm surges in the future comprehensively, trying to include all the possible scenarios. Because the prediction of the typhoons using the climate model are not accurate enough for the storm surge simulation, so it is nearly impossible to predict the storm surge caused by typhoons in the future with the climate model. In the present paper the climate factors were directly associated with the wind field and water body used in the hydrodynamic model. And comparing to the methods used in the past, this method is much simpler and needs less computing resources. Since only the extreme scenarios of the storm surge caused by the climate change are discussed in this article, this method could not predict the actual inter-annual variability. There are also some uncertainties in the prediction of the sea level rise and SST rise, which can not be quantitatively defined, instead the minimum and maximum of the both values are given in this paper, thus only the minimum and maximum changes of the storm surge have been obtained in this article.

Fig.1 Bathymetry (in meters) of the computational domain, and path of Typhoon Mamie (8509) (in pink line).
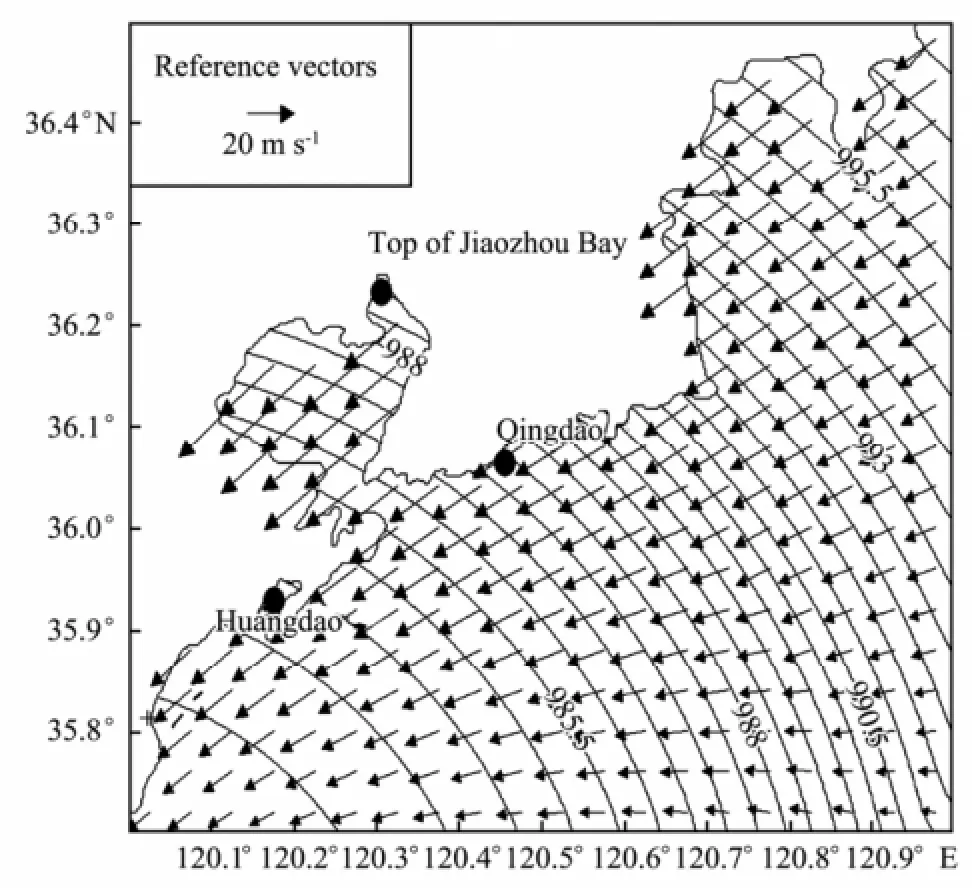
Fig.2 The location of Qingdao, Huangdao District and the top of Jiaozhou Bay and the 10 m wind velocity (m s-1) and pressure fields (hPa) at 8:00 August 19, 1985.
The paper is organized as follows: Section 2 introduces storm surge 8509 and describes the typhoon model which generates the typhoon air pressure and the wind field.Section 3 explores the ADCIRC model, which was applied to compute storm surges in the Qingdao coastal area. Section 4 discusses the impact of different paths and future climate conditions on storm surges and predicts storm surges for different typhoon paths before making the risk prediction of storm surges. Conclusions and discussions are given in Section 5.
2 Meteorological Driving Field
2.1 Surge 8509
Storm surge 8509 induced by Typhoon Mamie (8509) struck the Qingdao area in August, 1985, and caused serious damages. The typhoon arrived in the East China Sea on August 16, 1985 at 8:00 a.m., and then headed north and landed in Qingdao at 8:00 a.m. in August 19, 1985. Its maximum wind speed was more than 30 m s-1and the minimum pressure was less than 980 hPa in Qingdao. The storm-induced high water flowed over the local coastal defense facilities, bringing in the most serious losses since the 1950s. This storm surge event was used as a standard case to investigate how typhoon paths and future climate changes would affect storm surges not only because it ranked as the most serious storm surge disaster since 1950 (Lin et al., 1996) but also because its parameters are more accurate than those of the typhoons happening before 1950. Its path (Fig.1), central pressure and propagation data are taken from the typhoon yearbooks published by China’s State Oceanic Administration (SOA, 1985).
2.2 Typhoon Diagnostic Model
To simulate a typhoon-induced storm surge, data of the air pressure and wind field of the typhoon are needed. Many typhoon wind field models have been built with the development of numerical weather prediction models. Usually, the central pressure, propagation speed, radius of maximum winds and path of the typhoon are necessary to simulate the process of the typhoon. In this study, the Jelesnianski’s circular typhoon model (Jelesnianski, 1965) was employed to estimate the external forcing of the typhoon. The model is composed of a circular wind field and a typhoon moving speed. The computing formulas for the air pressure and wind speed are as follows:
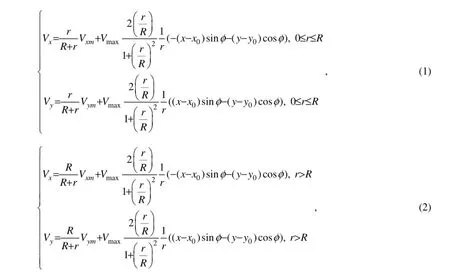

where, Vxand Vyare the wind velocities at a particular point in the x and y directions respectively; r is the distance between a specific point in the field and the typhoon center; Vmaxrefers to the maximum wind speed at a particular place which is a certain distance R away from the typhoon center; Vxm, Vymare components of the moving velocity of the typhoon center in the x and y directions respectively; (x, y) and (x0, y0) denote the position of a particular point in the field and the center of the typhoon, respectively; φ is the flow angle, which in this paper is set to 20˚ when r≤R and 15˚ when r>R; P0is the central pressure of the typhoon; P∞is the peripheral pressure, which is set to 1013 hPa in this study; Pais the pressure of the selected point.
The maximum wind speed is calculated by

The relationship between the central pressure and the maximum wind speed is based on an analysis of 28 years of maximum wind measurements made at the coastal and island stations in the northwestern Pacific (Atkinson andHolliday, 1977).
The radius of the maximum wind is calculated by the formula

whereθrefers to the latitude. This formula was developed based on an analysis of the winds and geopotential heights data, observed during 606 flights into the Atlantic and Eastern Pacific tropical cyclones between 1977 and 2000 (Willoughby and Rahn, 2004). And the formula also takes one factor into consideration that weaker typhoons in higher latitudes tend to have larger eyes (Shea and Gray, 1973). The formula has been successfully used in the Bohai and Yellow Sea (Fenget al., 2012) . The moving velocity of the typhoon center can be calculated according to the typhoon path.
The workflow of the typhoon diagnostic model is as follows: Eq. (4) provides the maximum wind speed for Eqs. (1), (2) and (5); Eq. (5) provides the radius of the maximum speed for Eqs. (1), (2) and (3); and the wind field and air pressure are calculated by Eqs. (1), (2) and (3).
3 Storm Surge Model
3.1 Model Description and Configuration
The ADCIRC model was employed to compute storm surges in Qingdao’s coast area in this study. The ADCIRC is an unstructured grid finite-element hydrodynamic model which allows both high grid resolution where solution gradients are large and low grid resolution where solution gradients are small (Blainet al., 1998; Shenet al., 2006b; Mattocks and Forbes, 2008; Ebersoleet al., 2010; Bacopouloset al., 2012). In the ADCIRC, spurious oscillations associated with a primitive Galerkin finite-element formulation of the continuity equation are avoided by utilizing the generalized wave continuity equation (GWCE). In this study, the depth-integrated ADCIRC 2D model was used and the baroclinic effect was not considered.
The model domain covers the entire Bohai Sea, Yellow Sea and most of the East China Sea (Fig.3), which is large enough to simulate the storm surge accurately in Qingdao. The unstructured triangular grids have a horizontal resolution varying from 10 km at the open boundary of the East China Sea to 200 m along the east coast of the Bohai and Yellow Sea (Fig.4). There are 214258 nodes and 409285 triangular elements in the model. The open boundaries are located along the East China Sea and in the Japan Sea (East Sea).
The model is forced by tide, wind and air pressure. The amplitudes and phases of the tide constituents (M2, S2, K1, O1, K2, P1, N1 and O1) are taken from the OSU Tidal Prediction Software (OTPS). The bottom stress is a quadratic function of the depth-averaged velocity, and the wind stress is a function of wind velocity.
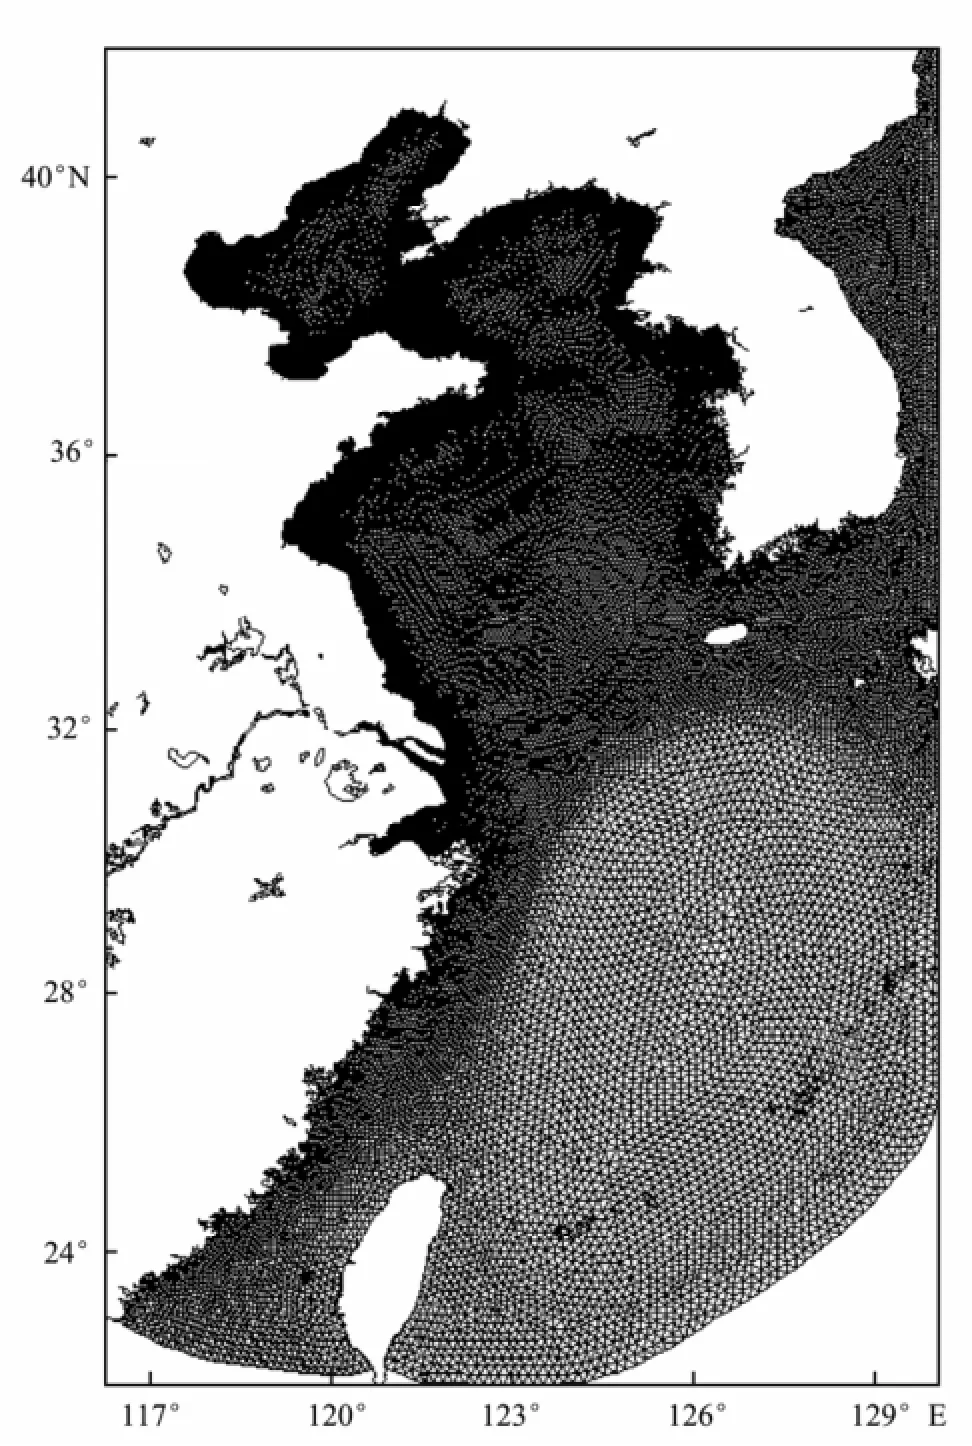
Fig.3 Unstructured grid of the computational domain.

Fig.4 An enlarged view of the unstructured grid off Qingdao.
3.2 Model Validation
In order to examine the feasibility of simulating storm surges with the ADCIRC model, the surge elevations caused by Typhoon 8509 in August, 1985, by Typhoon 7123 in September, 1971, and by cold air outbreak 0310 in October, 2003 were simulated. The comparisons be-tween the measured and simulated storm surge elevations are shown in Fig.5. The observed surge is obtained by subtracting the tide from the observed water elevations. Fig.5 shows that for the process of Typhoon 8509, the simulated storm surge at Qingdao is in good agreement with the observation results. The simulated error of the maximum storm surge is 2.1 cm, and the phase error of the maximum storm surge is almost zero. As for the process at Tanggu, the simulated error of the maximum storm surge is 14 cm and the phase error of the maximum storm surge is less than an hour. The maximum surge height is the most important variable for estimating surge risk, and the model is capable of simulating the maximum surge height in the Qingdao area. For the process of Typhoon 7123, the simulated storm surges are also in good agreement with the observations. The simulated error of the maximum storm surge at Meihua is 10 cm and the error at Mawei is 12 cm; the phase errors of the maximum storm surge at both places are within 2 hours. As for the storm surge process 0310 caused by the cold air outbreak, the simulated storm surges are also in good agreement with the observations. The simulated error of the maximum storm surge at Tanggu is 13 cm and the error at Longkou is 15 cm; the phase errors of the maximum storm surge in both places are within 2 hours. Therefore, this storm surge simulation system is reliable to study storm surge along China’s coast under different scenarios.

Fig.5 Simulated (black solid line) and measured (black dotted line) storm surges at Qingdao and Tanggu for the process of Mamie (1985-8-17), at Meihua and Mawei for the process of Typhoon 7123 (1971-9-21), and at Tanggu and Longkou for the cold air outbreak process 0310 (2003-10-9).
4 Experiments and Results
4.1 The Effect of Typhoon Path on Storm Surge
Fig.6 shows the typhoon paths that passed by Qingdao during the past 100 years. Four typical Typhoons 8509 (Mamie), Opal, 3921 and 2413 were selected for discussion according to their positions relative to Qingdao. The Typhoon 8509 represents those for typhoons which make their landfalls in the coastal area of Jiangsu Province before going north to Qingdao; Opal represents those for typhoons that make their landfalls in Fujian Province andthen go north until they turn east to Qingdao; the path of 3921 stands for those for typhoons that move north from the East China Sea to Qingdao; and the path of 2413 stands for those for typhoons that move northwest to Qingdao. These four typical typhoon paths can represent most of the typhoon cases in the study area. The sensitivity of peak surge heights in the Qingdao area to these four typhoon paths are investigated using the established storm surge simulation system.
To investigate the impact of typhoon paths on storm surges, it is necessary to fix the other typhoon parameters, such as the central pressure and the moving speed of the typhoon center. As described in 2.1, the observed central pressure and moving speed of Typhoon 8509 are used in this study because of its strong influence and accurate observation data. The maximum wind speed and the radius of the maximum wind in Typhoon 8509 are calculated by Eqs. (4) and (5), respectively.
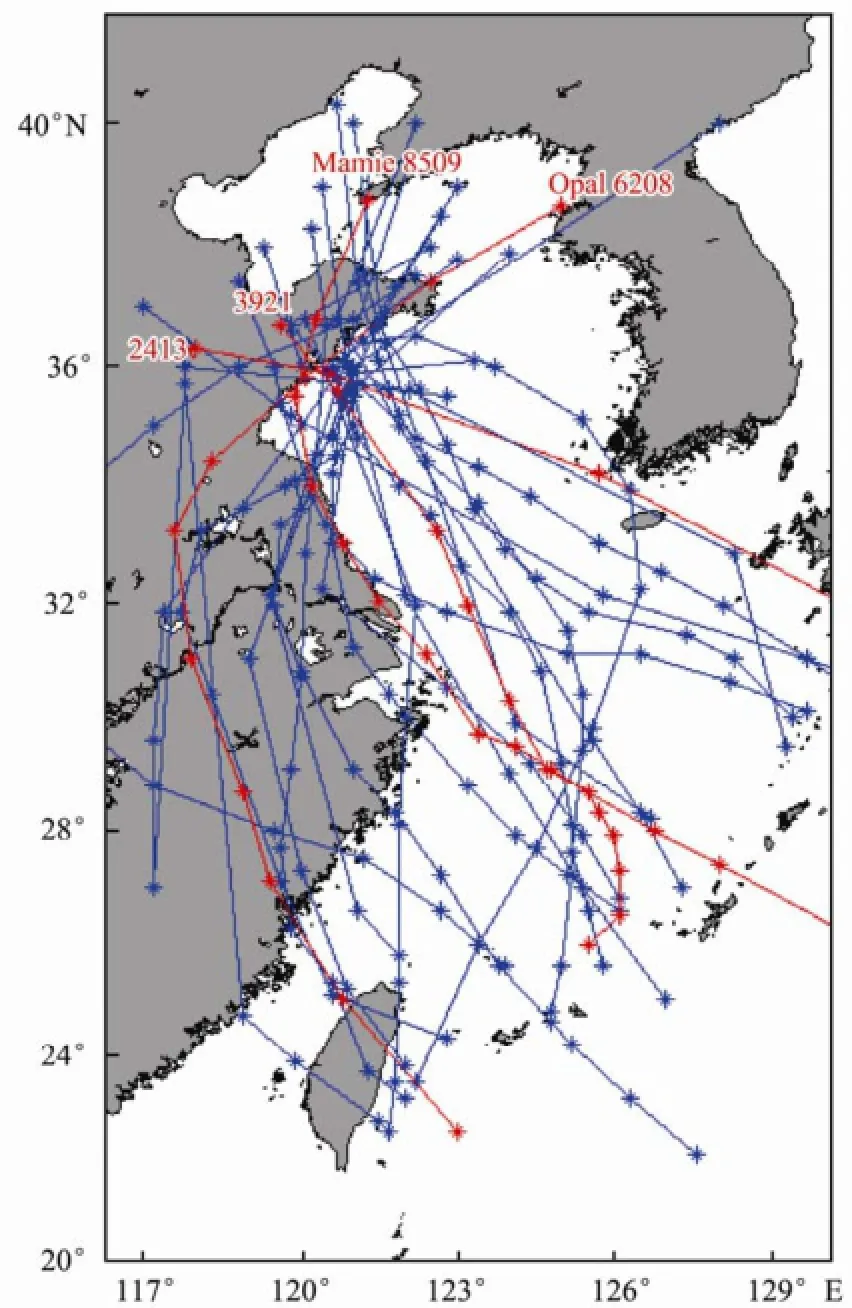
Fig.6 Paths of the 25 typhoons that passed by Qingdao in recent 100 years. The paths are indicated by the blue -*-, and the selected four paths of Typhoon Mamie, Opal, 3921 and 2413 are indicated by red -*-.

Fig.7 Planar views of model-simulated wind vectors and the pressure fields at the time when the surge elevation reaches the maximum in the Qingdao area for typhoons moving along the paths of Mamie, Opal, 3921 and 2413.
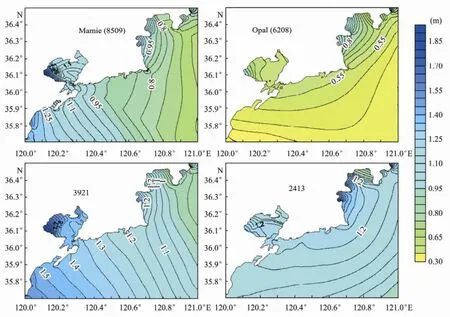
Fig.8 Planar views of model-simulated maximum peak surge elevation during the whole process of the storm surge for typhoons moving along the paths of Mamie, Opal, 3921 and 2413.
Four experiments have been carried out to investigate what happens to the surge elevation when the typhoon moves along the four selected paths with the intensity of Typhoon 8509. In order to clarify the differences caused by the four selected paths, planar views of the wind and pressure fields at the time when the surge elevation reaches maximum in Qingdao are shown in Fig.7. Fig.8 shows the peak surge elevation in the Qingdao area during the four experiments. These 4 selected paths fall into 2 categories, with Typhoon Mamie and Typhoon 3921 in one category, and Typhoon Opal and Typhoon 2413 in the other. The peak surge elevations for the two paths in the first category increase from northeast to southwest, with their isolines nearly perpendicular to the coastline, and such elevations change a lot along the coastline. On the other hand, for the typhoons in the second category, the peak surge elevation increases from southeast to northwest and the isolines are nearly parallel to the coastline. Moreover, the typhoons in the first category cause smaller peak elevations in the central part of the Qingdao area than on both the northeast and southwest sides, while under the influence of the typhoon paths in the second category larger peak surge elevations occur in the central part of the Qingdao area than on both the northeast and southwest sides. These differences result from different wind fields caused by different typhoon paths (Fig.6). The angles between the typhoon paths in the first category and the coastline are bigger than those for the second category. Different typhoon paths lead to different wind fields: there are offshore and onshore direction winds for the second category while the winds for the first category mostly blow along the coast. These differences lead to different distributions of the peak surge elevation in the Qingdao area.
From the results of the four experiments, it can be found that the path of Typhoon Opal leads to the minimum peak surge elevation. The path of Typhoon 3921 results in the most serious risk in the southwest part of the Qingdao area and the path of Typhoon 2413 causes the most serious risk in the northeast part of the Qingdao area. Mcinneset al.(2003) concluded that when the path is nearly perpendicular to the coastline the most serious storm surge will happen. From Fig.8, it can be found that the local coast geometry contributes a lot to the impact of the storm surges. In all the four experiments, the west corner of the Jiaozhou Bay has the largest peak surge elevation, caused by the terrain of the Jiaozhou Bay, and the path of Typhoon 3921 induces the largest peak surge there. Another region which has an obvious large peak surge elevation is the northeast corner of the area, possibly caused by the shape of the coastline.
4.2 The Effects of Climate Changes on Storm Surge Based on Experiment with Typhoon 8509
Eight experiments, based on Typhoon 8509, were conducted in order to study the impact of future climate changes (sea level rise and SST rise) on the surge elevation in the Qingdao area. In this study the sea-level was increased by 22 cm and 88 cm (Chen, 1997; IPCC, 2007). The empirical relationship between the SST and typhoon intensity was used to calculate the change of typhoon wind fields in 2100 due to climate change (Emanuel, 1987). Should the SST in China’s seas increase by the standard of the minimum bound of 2.0℃ and the maximum bound of 4.0℃ by 2100 (IPCC, 2007; Moon and Oh, 2010), the corresponding increases in maximum cyclone wind speed would be 10% and 20% respectively, and the change of the central pressure would follow the maximum wind speed (Emanuel, 1987). In this paper, the increase of the maximum cyclone wind speed was used to represent the increase in the intensity of the typhoons due to the SST rise. The scenarios of the experiments are listed in Table 1. These future scenarios have been simulated to give insights into what might occur in the future.
The same grid and open boundary conditions were used in all experiments.

Table 1 The scenario of each experiment
Three locations, Qingdao, Huangdao and the top of the Jiaozhou Bay were used to study the surge changes along the Qingdao coast. We also simulated the tides in the Qingdao area under three cases: no change in sea-level, 22 cm rise in sea-level and 88 cm rise in sea-level. For calculating the changes in different sea levels and wind speeds, we have de-tided the total water elevation to obtain the surge using the corresponding tide elevation. These experiments allow us to distinguish the increases in surge elevation induced by the tide, storm and tide-surge interaction separately. Brownet al.(2010) de-tided the tide water elevation simulated under the current sea level, but he failed to clearly distinguish the effects of sea level rise on tides and surges.
Figs.9 and 10 show how sea level rise affects storm surges. Fig.9 shows that at all 3 locations the maximum peak surge changes very little (about 1–3 cm), but the changes are different in different locations. And this is more obvious with a sea level rise of 88 cm than with that of 22 cm.
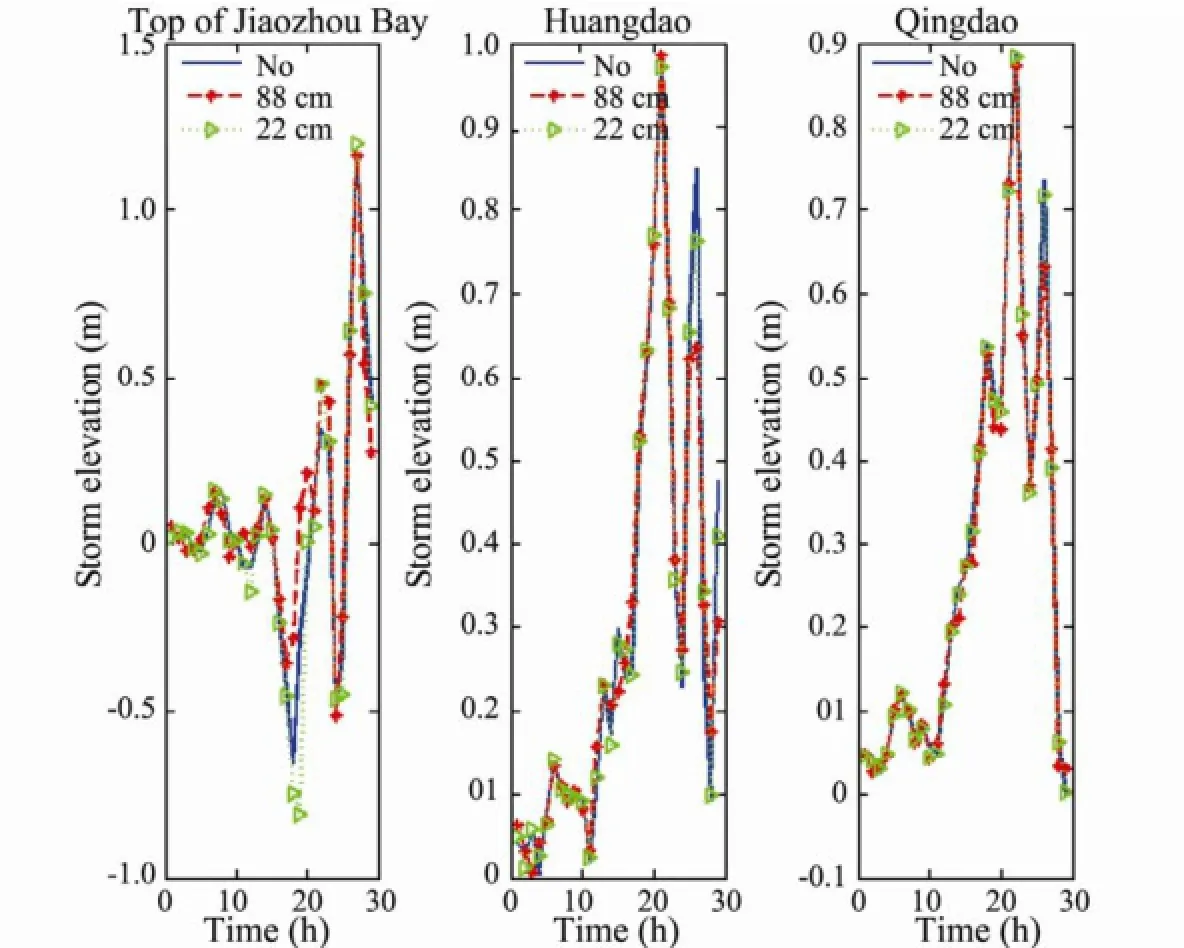
Fig.9 The surge scenarios at the top of Jiaozhou Bay, Huangdao and Qingdao under the present-day conditions (blue line) and with sea level rises of 22 cm (green line) and 88 cm (red line). The time is that after 10:00 August 19, 1985.

Fig.10 Tide changes due to the sea level rises of 22 cm and 88 cm compared to the tide in present-day conditions. The tide change with the sea level rises of 22 cm (green line), and 88 cm (red line), and under the present-day conditions (blue line). The time is that after 10:00 August 19, 1985.
Fig.10 shows the effect on the tides. The sea level rise results in a tide elevation rise during the flood period at all three locations, but the maximum rise does not happen at the high water time. We can also find that the elevation at the time when the variation of the tide reaches its largest is still smaller than the elevation at the high water time when the sea level change was positive but quite small. After that, the elevation decreases during the ebb tide time. At the low water time, the sea level change remains negative, so the elevation becomes lower. Considering the different base levels of the future sea level and current conditions, it is expected that the amplitude of the tide will increase in the future. At the selected locations, when the sea-level rise is 22 cm, the amplitude of the tides increases by 3–4 cm, and when the sea-level rise is 88 cm, the amplitude increases by 4–7 cm, which can make the possible maximum sea level higher during a storm surge period, thus leading to a more serious storm surge disaster. The tide amplitude increase at the top of the Jiaozhou Bay is larger than in Huangdao and Qingdao. The more the sea level rises, the bigger the amplitudes will become.
Fig.11 shows how increasedVmaxaffects the peak surge at the 3 locations. The increasedVmaxcauses the surge to achieve a higher elevation throughout the event,i.e., the curve is shifted to higher elevations in this figure. In the scenario of the 110%Vmax, the peak surge increases from 19% to 27% at the 3 locations; at the top of the Jiaozhou Bay, both the growth rate and the peak surge elevation are the largest, while the surge growth rate in Qingdao is minimum. For 120%Vmax, the peak surge increases from 38% to 48% at these locations, about two times as large as in the case 110%Vmax. There are also some other differences; for example, the largest surge increase rate happens in Huangdao, and the peak surge elevation growth at the top of the Jiaozhou bay seems to be decreasing. In a word, the peak surge elevation is quite sensitive to the rise ofVmax, and the rate of the increase is nearly linear. According to the above-mentioned results, it can be concluded that the peak surge elevation will increase from 19% to 48% due to the SST rise in the Qingdao area in the future.
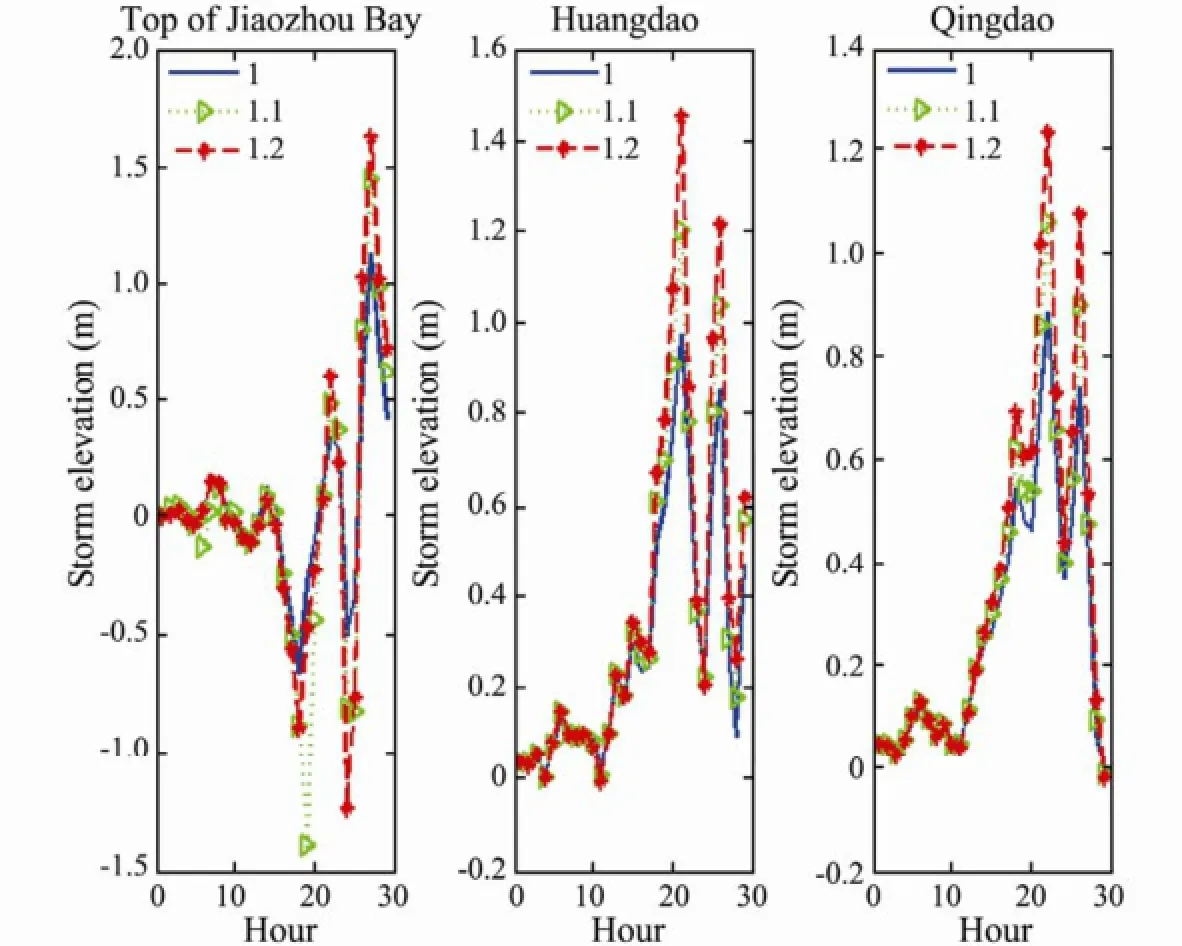
Fig.11 The surge scenarios at the top of Jiaozhou Bay, Huangdao and Qingdao under the present-day conditions (blue line) with 10% rise in Vmax(green line) and 20% rise in Vmax(red line). The time is that after 10:00 August 19, 1985.
Fig.12 shows the impact of tide-surge interaction on surges from the comparison with the tide-surge interaction being considered or not. The results for the top of the Jiaozhou Bay and Qingdao are drawn in Fig.12 and the result for Huangdao is omitted because of the tendency in Huangdao being very similar to that in Qingdao. From the figure we can find that the tide-surge interaction has nonlinear effects on the surge peaks. Figs.12A and B show that the effects of tide-surge interaction change little when the value of the sea level rise is small. Figs.12A and C indicate that the sea level rise has obvious effects on the storm elevation and these effects are more obvious for a higher sea level. Figs.12C and D reveal that the surge reduction does not change much with theVmaxincrease. Fig.12 also shows that the sea-level rise plays a more important role in the tide-surge interaction than the rise ofVmax. However the effect is different at different locations. For example, the modelled peak surge elevation is larger than that with linear calculations at the top of the Jiaozhou Bay, meaning that the tide-surge interaction will induce more serious storm surge disasters in this place. In Huangdao and Qingdao, the tide-surge interaction decreases the increase of the peak surge elevations.
To sum up, storm surges in Qingdao area would be more dangerous due to climate change in the future, but the sea level rise and SST rise work in different ways. The sea-level rise affects storm surges mainly through the tide, which in turn affects storm surges in two ways: first,the sea-level rise increases the amplitude of the tide, meaning a higher high water elevation; second, the sea level rise affects the peak surge elevation, but this effect is smaller than the first one. The sea level increase plays a major role in the tide-surge interaction, with different influences in and out of the Jiaozhou Bay. The SST rise would significantly increase the peak surge elevation by raising the surge elevation, and the increase rate is nearly linear with respect to the increase inVmax. It should be emphasized that the experiments have also been done for the other 3 paths with the same conclusions discussed above. The experiments carried out with the intensity of the other three typhoons also came to the same conclusions, so we do not reproduce the relevant figures here.
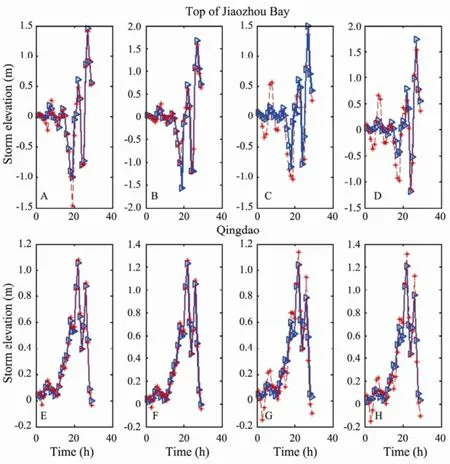
Fig.12 The storm elevation at the top of Jiaozhou Bay and at Qingdao for tide-surge interaction. The blue lines stand for the elevation with the tide-surge interaction being considered, and the red dotted line stands for that with the interaction not being considered. A and E refer to the increase of 10% Vmaxand the increase of sea-level 22 cm; B and F for the increase of 20% Vmaxand sea-level increase of 22 cm; C and G for the increase of 10% Vmaxand sea-level increase of 88 cm; D and H for the increase of 20% Vmaxand sea-level increase of 88 cm. The time is that after 10:00 August 19, 1985.
4.3 Estimation of Future Risk Derived from an Ensemble of Tracks
In order to predict the future risk of storm surges in Qingdao areas, we take into account the effects of both climate change and typhoon paths on the surge disaster estimation. According to the aforementioned studies of the effects of future climate change on the surge elevation, it can be concluded that the scenario which would lead to minimum risk is the case of a 22 cm rise in the sea level and a 2℃ rise in SST, and the scenario which would lead to the maximum risk is the case of an 88 cm rise in the sea level and a 4℃ rise in SST. Eight experiments were conducted to estimate the minimum and maximum storm surge risk for the four different typhoon paths in the future (Fig.13). Fig.14 shows the scenario of the maximum risk in the Qingdao area in the future that would be caused by a typhoon like Typhoon 8509.
The comparison of the characteristics of maximum peak surge elevation between the future (Fig.13) and the present day (Fig.7) shows that the structures of the maximum peak surge elevation distribution for the four selected paths in the future are the same as the structures of the present day. However, the values of the maximum peak surge elevation are increased due to the climate change. The laws of the increase of the maximum peak surge elevation, caused by the climate change for each selected path, correspond well with what was discussed in part 4.2. Fig.13 also shows that the effects of the climate change on storm surge are universal for all typical typhoons in the Qingdao area, indicating that the intensity of storm surges caused by all kinds of typhoons in the Qingdao will increase obviously in the future.
Fig.14 shows the results of the possible maximum peaksurge elevation obtained from this study, which will be useful for the surge defense facilities along the Qingdao coastline. All the scenarios have been considered in the work, including the four typical typhoon paths and several possible combinations of the sea-level rise and SST rise. The figure shows that the west corner of the Jiaozhou Bay has the maximum risk in the Qingdao area, and the risk is greater inside the Jiaozhou Bay than outside it. In general, the central part of the Qingdao area has a smaller surge risk than the other areas. For the three positions we selected, Qingdao has the minimal risk and the risks at Huangdao and the top of Jiaozhou Bay are nearly the same.

Fig.13 Planar views of model-simulated minimum and maximum risk of peak surge elevation in 2100 for the four paths of Mamie, Opal, 3921 and 2413 caused by a typhoon like Mamie, with its actual characteristics. The minimum is on the left side, the maximum is on the right side.

Fig.14 Planar views of model-simulated possible maximum risk of peak surge elevation in 2100 in the Qingdao area caused by a typhoon like Mamie, 1985, with its actual characteristics.
5 Discussions and Conclusions
In this study, the impact of typhoon paths and climate change on storm surges around Qingdao’s coastal area were investigated using numerical model. A typhoon- induced storm surge simulation system was developed for the Qingdao coast. The system includes a typhoon diagnostic model for generating the typhoon wind and pressure fields and a 2D ADCIRC model for simulating the associated storm surge. Storm surge 8509 was used as a base case in the storm surge simulation system. Four typical typhoon paths were chosen from the analysis of previous typhoon data to study the effects of typhoon paths on storm surges. The experiment results show that the typhoons moving north from the East China Sea with paths like that of Typhoon 3921 cause the largest peak surge elevation in the southwest part of the Qingdao area, while typhoons which move northwestern to the Qingdao area with paths like that of Typhoon 2413 lead to the largest peak surge elevation in the northeastern part of the Qingdao area.
Future scenarios in the East China Sea show that both the sea level rise and the sea surface temperature rise would affect the storm surge risks. And the sea surface temperature rise has more impact on the storm elevation than the sea level rise; even with the minximum bound of a 2℃ rise in SST the storm surge elevation would increase from 19% to 27% around the Qingdao coast, and the range of the storm surge change due to the SST rise in the Qingdao area would be from 19% to 48% in 2100. The sea level rise affects the storm surge mainly through two ways: first, the sea-level rise increases the amplitude of the tide, which means a higher high water elevation; second, the sea level rise also affects the peak surge elevation, and this effect is smaller than that in the first case. But for disaster prevention another important element is the sea-level rise itself, which directly threatens the coastal area. The sea level increase plays a major role in the tide-surge interaction, but this influence is different in and out of the bay. Although the surge elevation caused by the sea level rise is smaller than that by the sea surface temperature rise, the sea level rise also plays a very important role in the disaster prevention in the future. In this paper, the model-simulated minimum and maximum risks of peak surge elevations in 2100 for the four typical typhoon paths were calculated, and the possible modelsimulated maximum risks of the peak surge elevation in 2100 in the Qingdao area caused by a typhoon like Mamie, was also studied.
It should be noted that although only 4 typical paths are used in this work, we discuss the minimum sea-level rise of 22 cm, the maximum sea-level rise of 88 cm, the minimum SST rise of 2℃ and the maximum SST rise of 4℃. It must be stressed that this article is not intended to predict the actual inter-annual variability, but only discusses the extreme changes of the storm surge caused by climate change. Neither do we consider in the present study that typhoons may move along other paths and cause serious surge event. In the future study, the Monte Carlo method can be used to produce large ensemble of typhoon paths. And if the actual inter-annual variability of the climate scenarios could be revealed in the future, the more accurate change of storm surge could be predicated.
It is expected that some extreme storms may cause extremely large surges and risks around the Qingdao area in the future. Therefore, marine defence facitities along the Qingdao coastline have to be carefully planned.
Acknowledgements
This work is supported by the Marine Industry Research Special Funds for Public Welfare Projects (No. 200905013). The authors would like to thank the ADCIRC Development Group for their support in the modeling.
Atkinson, G. D., and Holliday, C. R., 1977. Tropical cyclone minimum sea level pressure-maximum sustained wind relationship for western north pacific. Monthly Weather Review, 105: 421-427.
Averkiev, A. S., and Klevannyy, K. A., 2010. A case study of the impact of cyclonic trajectories on sea-level extremes in the gulf of finland. Continental Shelf Research, 30: 707-714.
Bacopoulos, P., Dally, W. R., Hagen, S. C., and Cox, A. T., 2012. Observations and simulation of winds, surge, and currents on Florida’s east coast during hurricane Jeanne (2004). Coastal Engineering, 60: 84-94.
Bengtsson, L., Hodges, K. I., Esch, M., Keenlyside, N., Kornblueh, L., Luo, J. J., and Yamagata, T., 2007. How may tropical cyclones change in a warmer climate? Tellus Series A: Dynamic Meteorology and Oceanography, 59A: 539-561.
Blain, C. A., Westerink, J. J., and Luettich, R. A., 1998. Grid convergence studies for the prediction of hurricane storm surge. International Journal for Numerical Methods in Fluids, 26: 369-401.
Brown, J., Souza, A., and Wolf, J., 2010. Surge modelling in the eastern Irish Sea: Present and future storm impact. Ocean Dynamics, 60: 227-236.
Chen, J., 1997. The impact of sea level rise on China’s coastal areas and its disaster hazard evaluation. Journal of Coastal Research, 13: 925-930.
Dasgupta, S., Laplante, B., Murray, S., and Wheeler, D., 2009. Climate change and the future impact of storm-surge disasters in developing countries. Center for Global Development Working Paper No. 182, http://www.cgdev.org/content/publications/ detail/1422836.
Ebersole, B. A., Westerink, J. J., Bunya, S., Dietrich, J. C., and Cialone, M. A., 2010. Development of storm surge which led to flooding in St. Bernard polder during Hurricane Katrina. Ocean Engineering, 37: 91-103.
Elsner, J. B., Kossin, J. P., and Jagger, T. H., 2008. The increasing intensity of the strongest tropical cyclones. Nature, 455: 92-95.
Emanuel, K., 2005. Increasing destructiveness of tropical cyclones over the past 30 years. Nature, 436: 686-688.
Emanuel, K. A., 1987. The dependence of hurricane intensity on climate. Nature, 326: 483-485.
Esteban, M., Webersik, C., and Shibayama, T., 2009. Effect of a global warming-induced increase in typhoon intensity on urban productivity in Taiwan. Sustainability Science, 4: 151-163. Feng, S., 1982. Introduction to Storm Surge. Science Press, Beijing, 241pp (in Chinese).
Feng, X., Yin, B., and Yang, D., 2012. Effect of hurricane paths on storm surge response at Tianjin, China. Estuarine, Coastal and Shelf Science, 106: 58-68.
Holland, G. J., 1997. The maximum potential intensity of tropical cyclones. Journal of the Atmospheric Sciences, 54: 2519-2541.
Houghton, J. T., Ding, Y., Griggs, D. J., Noguer, M., Van Der Linden, P. J., Dai, X., Maskell, K., and Johnson, C. A., 2001. Climate Change 2001: The Scientific Basis. Cambridge University Press, Cambridge, New York, 881pp.
IPCC, 2007. Climate Change 2007: The Physical Science Basis. Cambridge University Press, Cambridge, New York, 996pp.
Jelesnianski, C. P., 1965. A numerical calculation of storm tides induced by a tropical storm impinging on a continental shelf. Monthly Weather Review, 93: 343-358.
Karim, M. F., and Mimura, N., 2008 Impacts of climate change and sea-level rise on cyclonic storm surge floods in Bangladesh. Global Environmental Change, 18: 490-500.
Knutson, T. R., and Tuleya, R. E., 2004. Impact of CO2-induced warming on simulated hurricane intensity and precipitation: Sensitivity to the choice of climate model and convective parameterization. Journal of Climate, 17: 3477-3495.
Lin, Z., Zhou, Q., and Hong, G., 1996. The research of prediction of storm surge disaster in near shore of Qingdao. Coastal Engineering, 3: 15-24.
Lombard, A., Cazenave, A., Dominh, K., Cabanes, C., and Nerem, R. S., 2005. Thermosteric sea level rise for the past 50 years; Comparison with tide gauges and inference on water mass contribution. Global and Planetary Change, 48: 303-312.
Marcos, M., Jord, A. G., Gomis, D., and Perez, B., 2011. Changes in storm surges in southern Europe from a regional model under climate change scenarios. Global and Planetary Change, 77: 116-128.
Mattocks, C., and Forbes, C., 2008. A real-time, event-triggered storm surge forecasting system for the State of North Carolina. Ocean Modelling, 25: 95-119.
Mcinnes, K. L., Walsh, K. J. E., Hubbert, G. D., and Beer, T., 2003. Impact of sea-level rise and storm surges on a coastal community. Natural Hazards, 30: 187-207.
Miller, L., and Douglas, B. C., 2004. Mass and volume contributions to twentieth-century global sea level rise. Nature, 428: 406-409.
Moon, I., and Oh, S. M., 2010. Changes of storm surge and typhoon intensities under the future global warming conditions. Storm Surge Congress 2010, Jeju National University, 57pp.
Morris, J. T., Sundareshwar, P. V., Nietch, C. T., Kjerfve, B., and Cahoon, D. R., 2002. Responses of coastal wetlands to rising sea level. Ecology, 83: 2869-2877.
Nicholls, R. J., 2002. Analysis of global impacts of sea-level rise: a case study of flooding. Physics and Chemistry of the Earth, Parts A/B/C, 27: 1455-1466.
Pirazzoli, P. A., Regnauld, H., and Lemasson, L., 2004. Changes in storminess and surges in western France during the last century. Marine Geology, 210: 307-323.
Rybczyk, J., and Cahoon, D., 2002. Estimating the potential for submergence for two wetlands in the Mississippi River Delta. Estuaries and Coasts, 25: 985-998.
Shea, D. J., and Gray, W. M., 1973. The hurricane’s inner core region. I. Symmetric and asymmetric structure. Journal of the Atmospheric Sciences, 30: 1544-1564.
Shen, J., Gong, W., and Wang, H. V., 2006a. Water level response to 1999 Hurricane Floyd in the Chesapeake Bay. Continental Shelf Research, 26: 2484-2502.
Shen, J., Wang, H., Sisson, M., and Gong, W., 2006b. Storm tide simulation in the Chesapeake Bay using an unstructured grid model. Estuarine Coastal and Shelf Science, 68: 1-16.
SOA, 1985. Typhoon Yearbooks of 1985. China Meteorological Press, Beijing, 193pp.
Tian, B., Zhang, L., Wang, X., Zhou, Y., and Zhang, W., 2010. Forecasting the effects of sea-level rise at Chongming Dongtan nature reserve in the Yangtze Delta, Shanghai, China. Ecological Engineering, 36: 1383-1388.
Wang, S., McGrath, R., Hanafin, J., Lynch, P., Semmler, T., and Nalan, P., 2008. The impact of climate change on storm surges over Irish waters. Ocean Modelling, 25: 83-94.
Webster, P. J., Holland, G. J., Curry, J. A., and Chang, H. R., 2005a. Changes in tropical cyclone number, duration, and intensity in a warming environment. Science, 309: 1844-1846.
Webster, P. J., Holland, G. J., Curry, J. A., and Chang, H. R., 2005b. Changes in tropical cyclone number, duration, and intensity in a warming environment. Science, 309: 1844-1846.
Willoughby, H. E., and Rahn, M. E., 2004. Parametric representation of the primary hurricane vortex. Part I: Observations and evaluation of the Holland (1980) model. Monthly Weather Review, 132: 3033-3048.
Woth, K., 2005. North sea storm surge statistics based on projections in a warmer climate: How important are the driving GCM and the chosen emission scenario? Geophysical Research Letters, 32, L22708.
Wu, L., and Wang, B., 2008. What has changed the proportion of intense hurricanes in the last 30 years? Journal of Climate, 21: 1432-1439.
Yan, Y., Qi, Y., and Zhou, W., 2012. Variability of tropical cyclone occurrence date in the South China Sea and its relationship with SST warming. Dynamics of Atmospheres and Oceans, 55 (6): 45-59.
Yang, G., 2000. Historical change and future trends of storm surge disaster in China’s coastal area. Journal of Natural Disasters, 28: 23-30.
(Edited by Xie Jun)
(Received November 14, 2012; revised January 15, 2013; accepted March 13, 2014)
© Ocean University of China, Science Press and Springer-Verlag Berlin Heidelberg 2014
* Corresponding author. Tel: 0086-532-66782977 E-mail: wsjang@ouc.edu.cn
杂志排行
Journal of Ocean University of China的其它文章
- Warmer-Get-Wetter or Wet-Get-Wetter? A Criterion to Classify Oceanic Precipitation
- Modeling Seasonal Variations of Subsurface Chlorophyll Maximum in South China Sea
- Assimilation of High Frequency Radar Data into a Shelf Sea Circulation Model
- A Physics-Based Dual-Frequency Approach for Altimeter Wind Speed Retrieval
- CFD-Based Numerical Analysis of a Variable Cross-Section Cylinder
- Extracting the Subsonic Anti-Symmetric Lamb Wave from a Submerged Thin Spherical Shell Backscattering Through Iterative Time Reversal
