Prediction of the Mooring Force of a 2-D Floating Oil Storage Tank
2014-04-26CHUXinjieDONGShengandZHAOXizeng
CHU Xinjie, DONG Sheng, and ZHAO Xizeng
1) College of Engineering, Ocean University of China, Qingdao 266100, P. R. China
2) Drilling Technology Research Institute of Shengli Petroleum Engineering Corporation Limited, SINOPEC, Dongying 257017, P. R. China
3) Ocean College, Zhejiang University, Hangzhou 310058, P. R. China
Prediction of the Mooring Force of a 2-D Floating Oil Storage Tank
CHU Xinjie1,2), DONG Sheng1),*, and ZHAO Xizeng3),*
1) College of Engineering, Ocean University of China, Qingdao 266100, P. R. China
2) Drilling Technology Research Institute of Shengli Petroleum Engineering Corporation Limited, SINOPEC, Dongying 257017, P. R. China
3) Ocean College, Zhejiang University, Hangzhou 310058, P. R. China
A Constrained Interpolation Profile (CIP)-based model is developed to predict the mooring force of a two-dimensional floating oil storage tank under wave conditions, which is validated against to a newly performed experiment. In the experiment, a box-shaped floating oil storage apparatus is used. Computations are performed by an improved CIP-based Cartesian grid model, in which the THINC/SW scheme (THINC: tangent of hyperbola for interface capturing; SW: Slope Weighting), is used for interface capturing. A multiphase flow solver is adopted to treat the water-air-body interactions. The Immersed Boundary Method (IBM) is implemented to treat the body surface. Main attention is paid to the sum force of mooring line and velocity field around the body. It is found that the sum force of the mooring line increases with increasing wave amplitude. The body suffers from water wave impact and large body motions occur near the free surface. The vortex occurs near the sharp edge, i.e., the sharp bottom corners of the floating oil storage tank and the vortex shedding can be captured by the present numerical model. The present model could be further improved by including turbulence model which is currently under development. Comparison between the computational mooring forces and the measured mooring forces is presented with a reasonable agreement. The developed numerical model can predict the mooring line forces very well.
floating oil storage; mooring line force; CIP method; numerical method; Immersed Boundary Method
1 Introduction
Marine oil spills will lead to ecological disasters. It causes serious concerns for the marine life and ecological environment, especially in the coastal area. It is necessary to make quick response to this kind of marine accident. An alternative way is to choose floating oil storage tanks, which is the best way to maximise oil storage capacity when dealing with an offshore oil spill.
Offshore structures have been widely used in many areas of engineering, such as ships, platforms, wind turbines, oil productions and temporary storage of recovered liquids. So far, most of the offshore structures have been limited to fixed platforms in shallow-water areas. In deeper water, floating structures may be more feasible. However, the design of floating structures to survive extreme events is more complicated than that with fixed platforms. It requires knowledge and methods to treat complex problems of fluid-structure interactions in severe seas with large wave-induced motions and distorted free surface. Therefore, it is important to carry out an integrated analysis for floating structures. However, thus far only limited studies have been performed (Greco et al., 2009; Hong et al., 2004; Koo and Kim, 2005). In the present study, a Computational Fluid Dynamics (CFD) model is developed for the coupled dynamic analysis of an offshore floating oil storage tank in waves.
To model interactions between floating structures and environmental conditions, numerical models have been well developed based on linear and nonlinear theories. The model based on linear theory is sufficient for routine design in which the motions of the fluid and/or structure body are small. In many cases, the nonlinear-theory based model has to be used when considering flow with extremely distorted free surface and/or body responses with large amplitudes. Models based on nonlinear theory are usually divided into two groups: the potential theory model and the Navier-Stokes (NS) model (Ma and Yan, 2009). The major difficulty in numerical simulation is that the topology of free surface may be largely distorted or broken up, which makes it impossible to apply the conventional model such as potential flow model. Therefore, the NS-based model, instead of the Laplace model, should be preferred when considering violent wave-body interactions. The NS-based models are further classified into mesh method (FDM: Finite difference method, FVM: Finite volume method and FEM; Finite element method, etc.) and meshless method (SPH: Smoothed Particle Hy-drodynamics; MPS: Moving-particle semi-implicit method; PFEM: Particle Finite Element Method, etc.) according to the discretization approaches. The NS-based method is usually called CFD method. CFD methods are developing fast in many areas of engineering, widely used as one of the powerful tools to resolve complicated offshore engineering problems and prevent offshore disasters. The advantage of the numerical study is the low cost, the ease to re-build the experiments and the ability to provide detailed information on the hydrodynamics of fluid- structure interactions, not suffering from the scaling problems present in physical models. Great progress has been made on meshless methods in recent years. However, fewer studies on interaction between wave and floating structure have been performed because the computational efficiency and accuracy is still a big problem for meshless method (Vandamme et al., 2011).
FDM is the oldest one and still widely used in CFD at present. In computational fluid dynamics, using an upwind differencing technique for the advection term in Navier-Stokes equations is necessary for a stable numerical calculation. The use of upwind scheme introduces excessive numerical diffusion and associated inaccuracies because it only uses grid point values to approximate a function profile. Great efforts to reduce such numerical diffusion have resulted in many high order upwind schemes, e.g., QUICK, TVD, etc. About 27 years ago, CIP emerged as a high order upwind scheme (Takewaki et al., 1985). In the CIP method, a cubic polynomial is used to approximate the value of a function within a grid cell. It uses the grid point values and its spatial derivatives in two grid points to form a cubic polynomial to approximate the profile (Yabe et al., 2001). The CIP method has been used not only for convection problems but also for free surface/interface capturing calculation, but suffers from low accuracy and mass non-conservative (Hu and Kashiwagi, 2004, 2009). To improve the accuracy through relatively simple implementation, several free surface/interface capturing schemes have been proposed. Xiao et al. (2005) developed a THINC scheme similar to the CIP method. It uses a smoothed Heaviside function as characteristic function instead of a cubic polynomial and is derived from a conservative form of advection equation. As a result, it shows better performance and conservativeness of mass than previous schemes (Zhao, 2011). Yokoi (2007) proposed the WLIC (Weighed Line Interface Calculation) scheme to improve the VOF-type methods, like the original VOF method, THINC scheme and so on. It works by simple weighting procedure and dimension splitting for simple implementation. Xiao et al. (2011) revisited the THINC scheme and proposed the THINC/SW scheme. In the THINC/SW method, a variable steepness parameter is adopted instead of the constant steepness parameter in the original THINC scheme, which helps maintain the thickness of the jump transition layer. In the present study, the THINC/SW scheme is adopted for the free surface/interface capturing calculations.
The objective of the present paper is to predict the mooring line force of the floating oil storage tank due to regular waves. Here a multi-phase flow model, which solves the flow associated with the air, water and solid simultaneously, has been developed for modeling wave and floating body interactions. In the following, we introduce briefly the numerical implementations for the governing equations and the free surface representations. The improved interface capturing method, THINC/SW method, is outlined. Then, the experimental set-up is presented. Finally, the computational results are presented about the interaction between regular waves and a floating oil storage tank. Main attention is paid to the mooring line force and flow velocity around the floating oil tank. The numerical results are compared with experimental data. The article ends with some general conclusions.
2 Governing Equations
The computations are performed by means of a CIP-based model (Hu and Kashiwagi, 2004, 2009; Zhao and Hu, 2012) for predicting strongly nonlinear wave-structure interactions. The method is based on the solution of the Navier-Stokes equations with the Constrained Interpolation Profile (CIP) adopted as the basic numerical scheme to obtain a robust flow solver in a Cartesian grid, where the THINC/SW scheme is used for free surface/ interface capturing; an immersed boundary method is used for wave-structure interaction treatment (Peskin, 1972).
To solve the wave-body interactions, we consider a two-dimensional viscous and incompressible flow. The governing continuity equations and Navier-Stokes equations are:

where viscous stress is expressed by

In the above equations, p is hydrodynamic pressure, ui(i=1, 2) are the velocity components along xithe axes, t is time; ρ and μ are the water density and viscosity, respectively. The third term on the right of Eq. (2) is the external force, including the gravitational force. The numerical model considers the fluid-body interaction as a multiphase problem involving water, air and structure. A major advantage of a multi-phase model is that the boundary conditions for the velocities at the free surface, which have a large influence on the robustness and accuracy of the method, are not needed anymore. A fixed Cartesian grid that covers the whole computation domain is used. We use a volume fraction fieldmφ(m=1, 2, and 3 indicate water, air and solid, respectively) to represent and trackthe interface. The total volume function for water and body is solved by using the following advection equation:

where, φ13=φ1+φ3. We assume that the density and viscosity of the solid phase are the same as those of a liquid phase to ensure stability. This set of our CFD code is different from most other existing CFD models. The volume function for solid body φ3is determined by a Lagrangian method in which a rigid body is assumed. The position of water is calculated by φ1=φ13-φ3, where the position of liquid and solid phase φ13is captured by a VOF-typed free surface/interface capturing method. The volume function for air φ2is then determined by φ2= 1.0-φ1-φ3. After all volume functions have been calculated, the physical property λ, such as the density and viscosity, are calculated by the following formula:

The drawback of the averaging process is that the computational accuracy is reduced to the first order in terms of cell size at the interfaces. More details can be found in Zhao (2011) and Zhao and Hu (2012).
3 Numerical Methods
3.1 Fractional Step Method
Following Zhao and Hu (2012), the governing equations are discretized using a high-order finite difference method on a Cartesian grid system. A staggered grid configuration is used to discretize the dependent variables. In each cell, the pressure p is computed at the cell center, the velocity component v is computed at the middle of the horizontal edge, and the velocity component u is computed at the middle of the vertical edge. A fractional step scheme is used to solve the N-S equations. The numerical solution of the governing equations is divided into three steps: one advection phase and two non-advection phases. In the advection phase the spatial derivatives of the velocities are needed to apply the CIP method for this phase. In the first non-advection phase, the terms of diffusion and external forces are solved by explicit method and renewed intermediate velocities are obtained. In the final phase, the velocities are updated and coupled with pressure field (Zhao and Hu, 2012).
3.2 CIP Method
In the advection step, the calculation is done by the CIP scheme. The basic idea of the CIP method is to reconstruct the profile of a variable advected by flows by using not only the variable itself, but also its spatial gradient g=∂f/∂x:


In the CIP method, the profile of a variable is considered as a cubic polynomial between two grid points, xiand xi-1. For simplicity we assume a constant advection velocity. Then Eq. (7) has the same form as Eq. (6). For the case of u> 0 we may approximate a profile for fninside the upwind cell [xi-1, xi] as

From the obtained profile of the position xiand n-th time step, the profile at the time step n+1 is obtained by shifting the profile with -uΔt, i.e., the time evolution of the function f and g can be obtained by using the following Lagrangian invariants:

The two unknown coefficients in Eq. (8) can be determined by using known quantities. It is not difficult to obtain

For the two-dimensional CIP method, the polynomial below was used by Yabe and Wang (1991):

The ten coefficients of the above polynomial are determined from four known physical values at grid points and six derivative values at the cell corners. Detailed coefficients of the polynomial for 2D case can be found in Hu and Kashiwagi (2004).
3.3 Free Surface Treatment
In a physical problem the gas-liquid interface (free surface) is with zero thickness. However, when we solve the density function of liquid1φ by Eq. (4), we obtain a free surface with finite thickness, i.e., a smeared interface due to numerical diffusion associated with the finite difference scheme. To avoid this, we use an accurate interface capturing scheme, the THINC/SW scheme (Xiao et al., 2011) to calculate the free surface. The THINC/SW scheme is also a VOF type method (Hirt and Nichols, 1981). In the THINC/SW method, a variable steepness parameter is adopted instead of the constant steepness parameter used in the original THINC scheme, which helps maintain the thickness of the jump transition layer. A 1-D THINC scheme is described in the following. Multi-dimensional computations are performed by a directional splitting method.
The one-dimensional advection equation for a density function φ can be written in conservation form

Eq. (12) is descretized by a finite volume method. For a known velocity field un, integrating Eq. (12) over a computational cell [xi-1/2, xi+1/2] and a time interval [tn, tn+1], we have

gi±1/2is the flux across the cell boundary (x=xi±1/2), and φ is the cell-averaged density function defined at the cell center (x=xi). The fluxes are calculated by a semi-Lagrangian method. Similar to the CIP method, the profile of φ inside an upwind computation cell is approximated by an interpolation function. Instead of using a polynomial in the CIP scheme, the THINC scheme uses a hyperbolic tangent function in order to avoid numerical smearing and oscillation at the interface. Since 0≤ χ ≤ 1, and the variation of χ across the free surface is step-like, a piecewise modified hyperbolic tangent function is used to approximate the profile inside a computation cell, which is shown as follows:

where α, γ, δ and β are parameters to be specified. α and γ are parameters used to avoid interface smearing as given by

Parameter δ is used to determine the middle point of the hyperbolic tangent function, and is calculated by solving the following equation:

Parameter β is used to control the sharpness of the variation of the color function. In the original THINC scheme, a constant β=3.5 is usually used, which may result in ruffling the interface which aligns nearly in the direction of the velocity (Xiao et al., 2011). Therefore, a refined THINC scheme, the THINC/SW, by determining adaptively according to the orientation of the interface is proposed by Xiao et al. (2011).
In the two-dimensional case, parameters β could be determined by the following equations:

where n=(nx, ny) is the unit norm vector of the interface.
After χi(x) is determined, the flux at the cell boundary can be calculated by Eq. (14). In Fig.1, gt+1/2is indicated by the dashed area for ui+1/2>0. After all of the fluxes across the cell boundaries have been computed, the cellintegrated value at the new time step can be obtained by Eq. (13). This cell-integrated value is used to determine the free surface position; therefore, mass conservation is automatically satisfied for the liquid.

Fig.1 Concept of the THINC/SW scheme.
A validation test, known as Zalesak’s problem (Zalesak, 1979), is performed with the THINC/SW scheme and the original THINC scheme. The two cases with different grid sizes are addressed. This test is one of the most popular scalar advection tests. A velocity field is given by u=(y-0.5, 0.5-x) with Δt=2π/628. One revolution is completed in 628 time steps. Numerical error is defined as


Table 1 Errors for Zalesak’s test problem

Fig.2 Numerical results of Zalesak’s problem after one rotation.
3.4 Body Surface Treatment
For simplicity, calculations are performed for a rigid body. To accurately predict the body position, the hydrodynamic force acting on the body is needed. It can be obtained as follows:

where nkis the k-th component of the outward unit normal vector.


Comparing to Eq. (2), we have added a forcing term in Eq. (19). Since in the present numerical solution procedure, the method of imposing the velocity distribution inside and on the body boundary is equivalent to adding a forcing term to the momentum equation, an alternative way is to do the following updating after the velocity-pressure calculation:

In a boundary cell Eq. (20) is a volume fraction weighting treatment for velocity interpolation. The idea for the treatment of the fluid-structure interaction is derived from an immersed boundary method (Peskin, 1972).
4 Experimental Setup
The experiment was carried out in a two-dimensional wave tank at Drilling Technology Research Institute, Shengli Petroleum Administrative Bureau, China. The glass-walled flume is 62 m long, 1.5 m wide and 2.0 m high, with a still water depth of 0.75 m. It is equipped with a piston-type wave generator at one end and a wave absorbing device at the other. The photo of the wave flume is shown in Fig.3 and a photo of the floating oil storage tank is shown in Fig.4. Table 2 gives the size of the body. In Fig.4, the solid rectangle body on the left is used in the present paper for initial purpose. The floating oil storage tank is anchored to the bottom of the wave flume with four rope mooring lines aligned vertically. Four strain gauges are used to measure the line strainforce. Fig.5 shows the photo of the strain gauge. Main attention is paid to the sum strain force. In the next section, the predicted strain sum force is compared with the measured data. The dynamics of the body at any instantaneous position is shown in Fig.6.
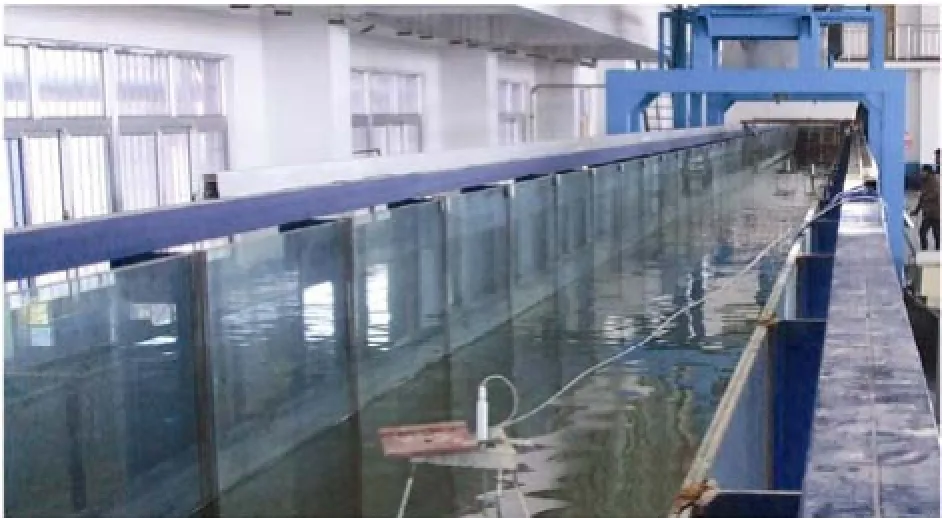
Fig.3 The physical wave flume.
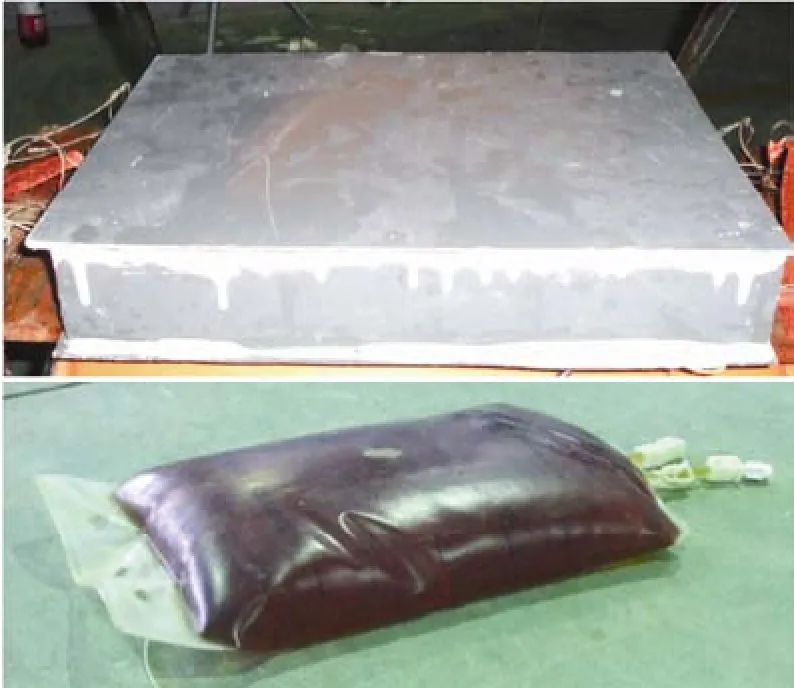
Fig.4 Physical model of the oil storage tank.

Table 2 Main parameter of the body model
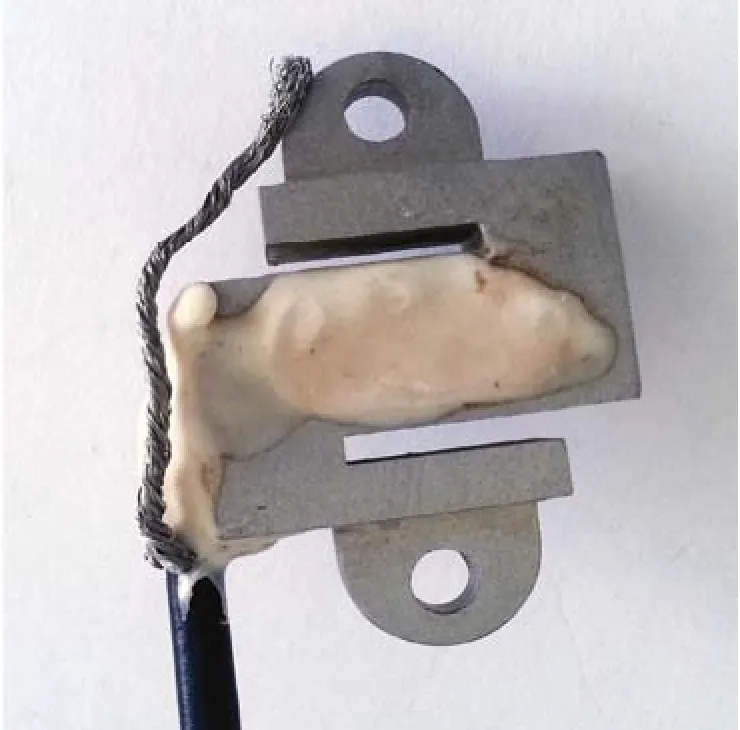
Fig.5 The strain gauge.
In this study, the floating oil storage tank is moored with fibre rope mooring lines aligned vertically as shown in Fig.6. Three different line lengths are chosen as L=0.25 m, 0.50 m and 0.70 m. We will illustrate the instantaneous position of the floating body during its interaction with incoming waves theoretically. Before get the instantaneous position of the body, we should know the force acting on the body. An assumption is made that there is no slack state in the mooring lines during its work time. This also means that only sway and heave displacements of the body are considered, with no rotational motion of the body occurring. Based on the above considerations, the dynamics of the floating oil storage tank is calculated using the following equations:

where m is the mass of the body, axand aythe horizontal and vertical accelerations of the body, respectively. ΣFxand ΣFyare the resultant horizontal and vertical forces acting on the body, respectively. ΣMcx, ΣMcyand ΣMcTrepresent the summation of moment by the forces acting on the body in the x and y-directions and the mooring line tensile forces, respectively. Also, referring to Fig.6, considering no slack state, the geometry of the mooring line gives the following equation:

There are four unknown parameters ax, az, and the offshore and onshore side mooring strain forces T1and T2in the above four equations (Eqs. (21–24)). The hydrodynamic forces P1, P2, P3and P4, as shown in Fig.6, are obtained numerically by surface integration of the water pressure around the floating body as shown in Eq. (18). By solving Eqs. (21–24), the unknown parameters ax, az, T1and T2can be obtained. After that, it is not difficult to update the body position at new time step using equations of motion.
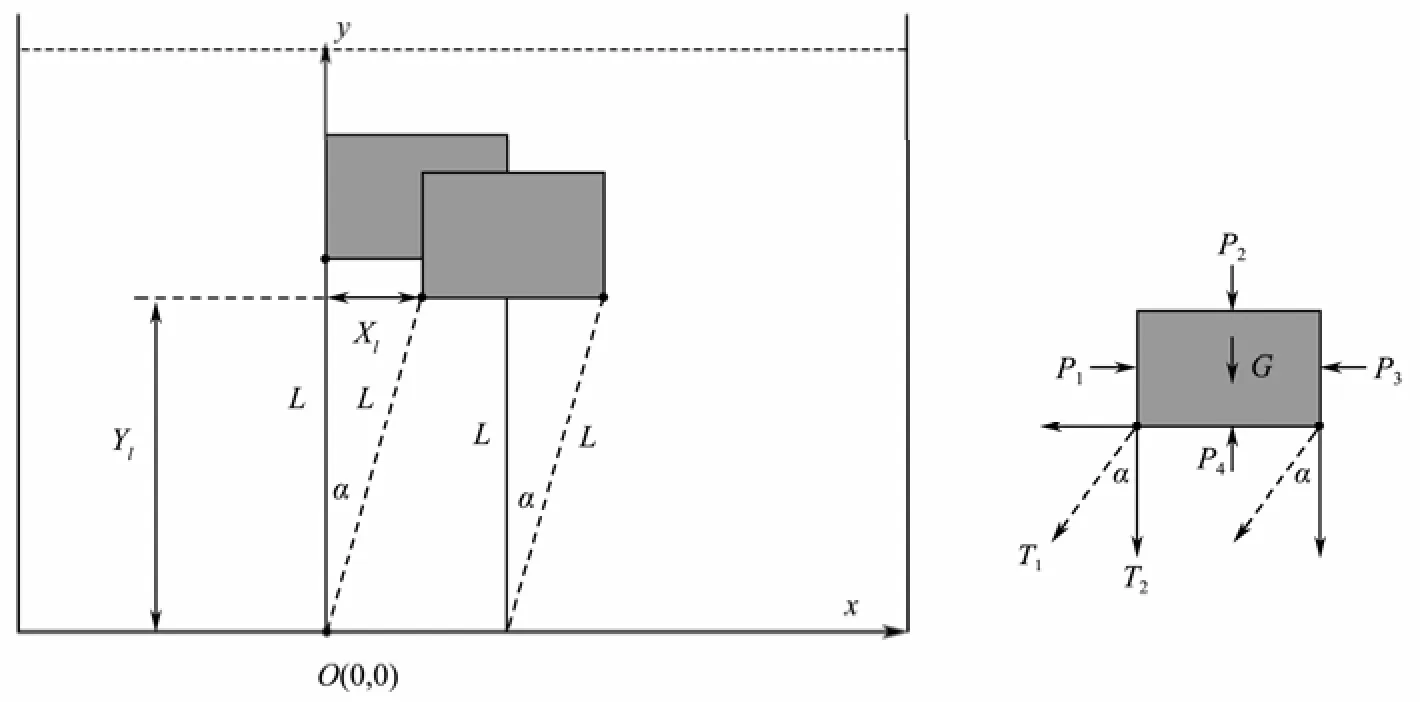
Fig.6 Instantaneous position of the floating body during its interaction with wave.
5 Results
In this section, numerical prediction of the mooring line forces with waves acting on the floating oil storage tank is carried out for three different mooring line lengths. Our main interest is the sum of the mooring line forces. Numerical results are compared with experimental measurements for each case.
Cases were carried out using a different numerical wave tank from the physical flume with the floating body center placed at x= 6 m, as shown in Fig.7. Several simplified set-ups were installed in order to save CPU time. Waves were generated by prescribing an inflow velocity similar to a piston-like wavemaker, where the real wavemaker motion is not necessary. A smaller numerical tank (12.3 m) than the physical flume (62.0 m) was used with a damping zone at the end of the wave tank.
In the computation, a stationary Cartesian grid was employed with grid numbers of 515(x)×196(y), 515(x) ×220(y) and 515(x)×172(y) for three different mooring line lengths of L=0.25 m, L=0.5 m and L=0.7 m. The minimum grid spacing was Δx=Δy=0.003 m around the body and the free surface. The time step was dynamically determined to satisfy the criterion of a CFL number of 0.1 and the total simulation time up to 25 s. Detailed information about the effect of both the grid spacing and time step can be found in Zhao et al. (2010). Wave period Twwas chosen to be 1.0 s for regular waves. Input wave amplitude of A=0.02 m and 0.03 m were chosen for the input wave conditions.
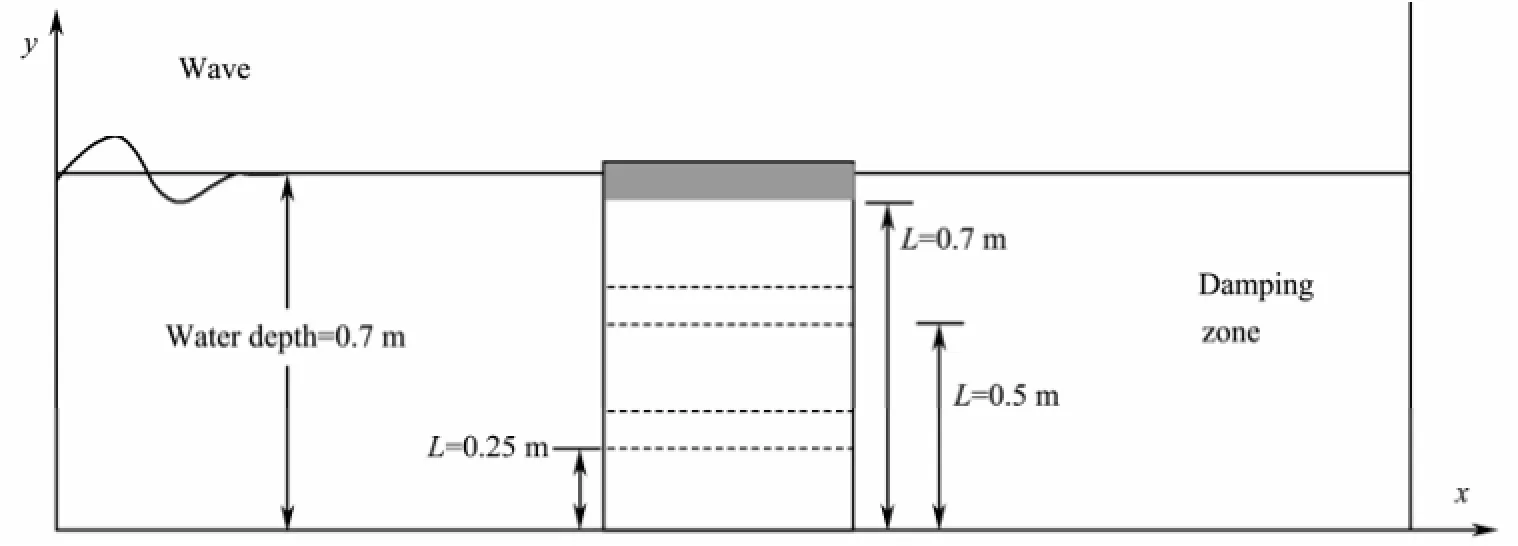
Fig.7 Initial set-up of the floating oil storage tank in the numerical model.
Fig.8 shows the computed sum force of the mooring lines for the cases of L=0.25 m A=0.02 m and A=0.03 m. The time series of the free-surface elevation measured in the experiment are also shown for comparison in Fig.8. We can notice that for the case of A=0.02 m the sum force of the mooring line shows linear response to the regular wave. The numerical results show reasonable agreement with the measurements. For the case of A=0.03 m, discrepancy can be found between the numerical results and the experimental data. The reason for this can be that the floating body shows nonlinear response to the increased wave amplitude. Look closely, the main trend of the sum force of the mooring line can be predicted using this model. It can be noted that the sum force of the mooring line increases with increasing wave amplitude.
The comparison of the sum force of the mooring line between the calculated results and the experimental data is presented in Fig.9 for the case of mooring line length L=0.5 m and amplitude A=0.3 m. For this case, the numerical results agree well with the experimental data. Comparing with Fig.9(a), it can be noted that the sum force of the mooring line is a little larger. The reason for this may be the effect of the free surface. For the case of L=0.5 m, the floating body is closer to the free surface than in the case of L=0.25 m.
Fig.10 presents the comparison of the sum force of the mooring line between the calculated results and the experimentally measured values for the case of mooring line length L=0.7 m. The input wave amplitude is set to be 0.02 m. As the weight of the floating body is almost the same as the buoyancy force acting on it, there acts no initial tensile force on each mooring line under the still water condition. It can be noted that there has occurred slack state in the mooring line and as a result there is impulsive forces acting on it. However, the numerical result represents well the measured data. From above comparisons, it can be concluded that the proposed numerical method is effective to predict the sum forces acting on the mooring lines.

Fig.8 Sum force of mooring lines with mooring line length L=0.25 m: (a) A=0.02 m; (b) A=0.03 m.
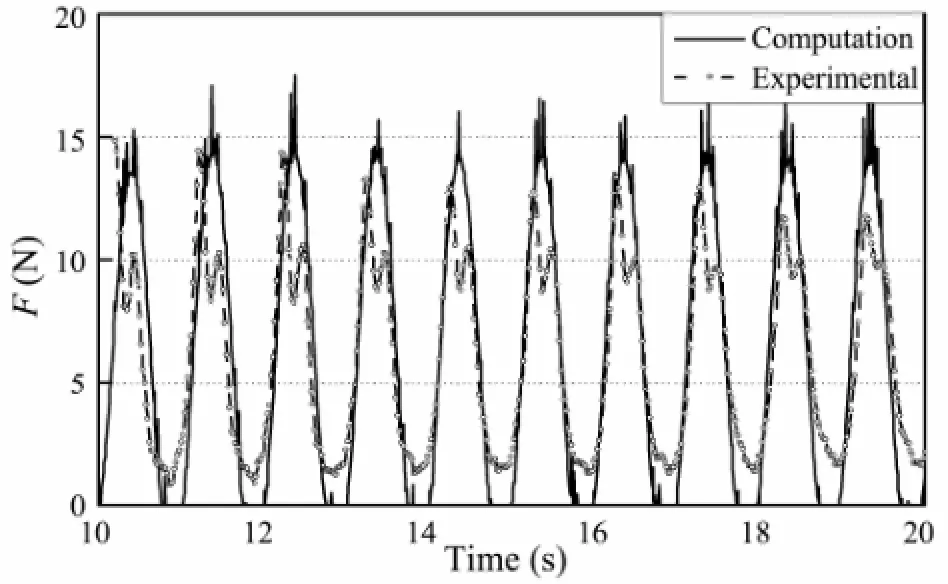
Fig.9 Sum force of mooring lines with mooring line length L=0.5 m A=0.03 m.
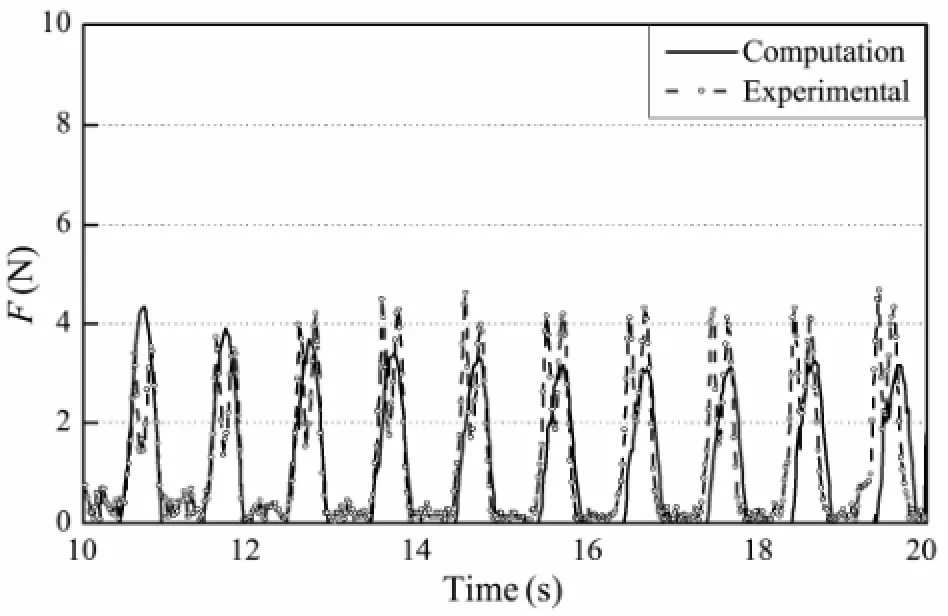
Fig.10 Sum force of mooring lines with mooring line length L=0.7 m, A=0.02 m.
The time series of numerical results of the sway motion of the oil storage are also presented in Fig.11. Results for two mooring line lengths L=0.5 m and L =0.7 m are presented in Figs.9(a) and (b), respectively. The positive sway represents the offshoreward horizontal displacement of the floating oil storage, i.e., along the direction of positive x-axis. On the other hand, the negative sway represents the onshoreward horizontal displacement of the floating oil storage, which is along the direction of negative x-axis. We can find that the sway motion is much smaller than the mooring line length. The heave motion is too small and not presented here. For the case of L= 0.5 m, A=0.02 m, the body suffers linear response to the regular waves. The averaged magnitudes of sway displacement of the body are seen zero. As for the case of L=0.5 m and A= 0.03 m, the averaged magnitudes of sway displacement of the body are seen nonzero. The average value increases in the positive direction. It can be also noted that the amplitude of the body sway motion increases with the increasing input wave amplitude. For the case of L=0.7 m, the body shows nonlinear response and oscillates about its positive position. It can be explained by the slack state of the mooring line. For this case, the magnitude of the body sway motion is about 5 times as large as the case of L= 0.5 m. We can conclude that the body suffers from the water wave impact near the free surface.
In order to illustrate the details of the flow-body interaction, velocity-vector corresponding to a typical case of oscillation t (17 s – 18 s) is shown here. Fig.12 illustrates the numerical simulation of the water particle velocity field around the moored floating oil storage tank along the channel length for different stages of a wave cycle. The corresponding wave height and wave period are 0.03 m and 1.0 s, respectively. The mooring line length L=0.5 m is used here. The results for t=17.0 s and t=17.1 s reveal that the progressive wave collides with the right return flow from the left face of the oil storage tank and the direction of the water particle velocity changes from horizontally to downward. Also, a vortex appears under the left side bottom corner face of the breakwater at t=17.2 s and t=17.3 s, which disappears at t=17.5 s. It again appears under the left side bottom corner of the oil storage tank at t=17.7 s and at t=17.8 s, respectively. It has been shown that the vortex occurs near the sharp edge, i.e., the sharp bottom corners of the floating oil storage tank and the vortex shedding can be captured by the present numerical model.

Fig.11 Time series values of the simulated sway motion of floating oil tank: (a) L=0.5 m; (b) L=0.7 m.
6 Conclusions

Fig.12 Numerical results of water particle velocity (m s-1) field around the floating oil storage (L=0.5 m, A=0.03 m).
In this study, interaction between regular wave and a 2-D floating oil storage tank is investigated by a Constrained Interpolation Profile (CIP)-based model. The computational results are validated by comparing with those of a newly performed experiment. In the experiment, a box-shaped floating oil storage tank is used. Computations are performed by an enhanced CIP-based Cartesian grid method based on the solution of the Navier-Stokes equations with the CIP method adopted as the basic numerical scheme to obtain a robust flow solver. A multi-phase flow solver is adopted to treat the water-air-body interactions. An Immersed Boundary method is introduced to couple them together. A more accurate and mass conservative VOF-typed scheme, the THINC/SW scheme, is used for interface capturing. A benchmark problem, known as Zalesak’s problem, is addressed by comparing the THINC/SW scheme with the original THINC scheme. It is found that the accuracy of THINC/SW scheme is higher than that of the original THINC scheme. Studies of interaction between the 2-D floating oil storage tank and regular wave are carried out considering different wave amplitudes and mooring line lengths. Main attention is paid to the sum force of mooring line and velocity field around the body. It is found that the sum force of the mooring line increases with increasing wave amplitude and the body suffers from the water wave impact and the large body motions near the free surface. The vortex occurs near the sharp edge, i.e., the sharp bottom corners of the floating oil storage tank and the vortex shedding can be captured by the present numerical model. The present model could be further improved by including turbulence model which is currently under development.
Acknowledgements
The study is supported by the National Natural Science Foundation of China (51209184, 51279186, 51479175).
Greco, M., Colicchio, G., and Faltinsen, O. M., 2009. Bottom slamming for a very large floating structure: Coupled global and slamming analyses. Journal of Fluids and Structures, 25 (2): 420-430.
Hirt, C. W., and Nichols, B. D., 1981. Volume of Fluid (VOF) method for the dynamics of free boundaries. Journal of Computational Physics, 39 (1): 201-225.
Hong, D. C., Hong, S. Y., and Hong, S. W., 2004. Numerical study of the motions and drift force of a floating OWC device. Ocean Engineering, 31 (2): 139-164.
Hu, C. H., and Kashiwagi, M., 2004. A CIP-based method for numerical simulations of violent free surface flows. Journal of Marine Science and Technology, 9 (4): 143-157.
Hu, C. H., and Kashiwagi, M., 2009. Two-dimensional numerical simulation and experiment on strongly nonlinear wavebody interactions. Journal of Marine Science and Technology,
14 (2): 200-213.
Koo, B. J., and Kim, M. H., 2005. Hydrodynamic interactions and relative motions of two floating platforms with mooring lines in side-by-side offloading operation. Applied Ocean Research, 27 (6): 292-310.
Ma, Q. W., and Yan, S., 2009. QALE-FEM for numerical modeling of non-linear interaction between 3D moored floating bodies and steep waves. International Journal for Numerical Methods in Engineering, 78 (6): 713-75.
Peskin, C. S., 1972. Flow patterns around heart valves: A numerical study. Journal of Computational Physics, 10 (2): 252-271.
Takewaki, A., Nishiguchi, A., and Yabe, T., 1985. Cubic interpolated Pseudo-particle method (CIP) for solving hyperbolictype equations. Journal of Computational Physics, 61 (2): 261-268.
Vandamme, J., Zou, Q., and Reeve, D., 2011. Modeling floating object entry and exit using Smoothed Particle Hydrodynamics. Journal of Waterway, Port, Coastal, and Ocean Engineering, 137 (5): 213-224.
Xiao, F., Honma, Y., and Kono, T., 2005. A simple algebraic interface capturing scheme using hyperbolic tangent function. International Journal for Numerical Methods in Fluids, 48 (9): 1023-1040.
Xiao, F., Satoshi, I., and Chen, C. G., 2011. Revisit to the THINC scheme: A simple algebraic VOF algorithm. Journal of Computational Physics, 230 (19): 7089-7092.
Yabe, T., and Wang, P. Y., 1991. Unified numerical procedure for compressible and incompressible fluid. Journal of the Physical Society of Japan, 60 (7): 2105-2108.
Yabe, T., Xiao, F., and Utsumi, T., 2001. The constrained interpolation profile method for multiphase analysis. Journal of Computational Physics, 169 (2): 556-593.
Yokoi, K., 2007. Efficient implementation of THINC scheme: A simple and practical smoothed VOF algorithm. Journal of Computational Physics, 226 (2): 1985-2002.
Zalesak, S. T., 1979. Fully multi-dimensional flux-corrected transport algorithm for fluid flow. Journal of Computational physics, 31 (3): 335-362.
Zhao, X. Z., 2011. Validation of a CIP-based tank for numerical simulation of free surface flows. Acta Mechanica Sinica, 27 (6): 877-890.
Zhao, X. Z., and Hu, C. H., 2012. Numerical and experimental study on a 2-D floating body under extreme wave conditions. Applied Ocean Research, 35 (1): 1-13.
Zhao, X. Z., Hu, C. H., and Sun, Z. C., 2010. Numerical simulation of focused wave generation using CIP method. In: The Proceedings of the Twentieth International Offshore and Polar Engineering Conference. Beijing, 596-603.
(Edited by Xie Jun)
(Received March 17, 2013; revised March 29, 2013; accepted August 30, 2013)
© Ocean University of China, Science Press and Springer-Verlag Berlin Heidelberg 2014
* Corresponding authors. E-mail: dongsh@ouc.edu.cn;
xizengzhao@zju.edu.cn
杂志排行
Journal of Ocean University of China的其它文章
- The Formation of Wind Curl in the Marine Atmosphere Boundary Layer over the East China Sea Kuroshio in Spring
- Wind Wave Characteristics and Engineering Environment of the South China Sea
- An Experimental Study on the Wave-Induced Pore Water Pressure Change and Relative Influencing Factors in the Silty Seabed
- Fe-Si-Mn-Oxyhydroxide Encrustations on Basalts at East Pacific Rise near 13˚N: An SEM – EDS Study
- Seasonal Changes in Phytoplankton Biomass and Dominant Species in the Changjiang River Estuary and Adjacent Seas: General Trends Based on Field Survey Data 1959 - 2009
- Major Mid-Late Holocene Cooling in the East China Sea Revealed by an Alkenone Sea Surface Temperature Record
