Modeling Cell Spreading and Alignment on Micro-Wavy Surfaces
2014-04-17YalcintasJHuYLiuandVoloshin
E.P.YalcintasJ.HuY.Liuand A.Voloshin
1 Introduction
Exposure to any physical environment that influences the cell’s physical and internal balance leads to changes in its geometry and motion since a cell needs to maintain its structure and molecular self assembly[Stamenovic and Ingber(2009)].These responses are basically due to mechanical loads or cell-generated forces that occur during the activities of cells in regulating cell functions like migration,differentiation,and growth[Chen,Mrksich,Huang,Whitesides,and Ingber(1997)].Mechanical signals that cells sense with surface receptors are transduced into chemical and biological response via the interconnected structure,namely the cytoskeleton,which also serves as a stabilization mechanism of cell shape due to its filamentous network structure[Ingber(1997)].
The living cells exhibit mechanical and physical characteristics that enable them to respond to changes in their physical environment and internal structure.To better understand and analyze these complex structures,various mechanical models have been developed in recent years.Some of the mechanical cell models represent the cell as a continuum structure by assigning material characteristics where the intercellular functions and transmitting subcellular components are not modeled in detail.Liquid drop models,solid models,power-law structural damping models,and biphasic models can be categorized as continuum mechanical models[Lim,Zhou,and Quek(2006)].One of the developed liquid models is the Newtonian liquid drop model[Yeung and Evans(1989)]in which the cytoplasm is modeled as a Newtonian viscous liquid and the cortex as a viscous fluid layer with constant static tension.Shear thinning liquid drop model[Tsai,Frank,and Waugh(1993)],and Maxwell liquid drop model[Dong,Skalak,Sung,Schmid-Schonbein,and Chien(1988)]are further examples of liquid drop models that were developed to gain an insight in cell mechanics.
Another category of cell modeling includes solid models such as linear elastic solid model[Theret,Levesque,Sato,Nerem,and Wheeler(1988)]and linear viscoelastic solid model[Schmid-Schonbein,Sung,Tozeren,Skalak and,Chien(1981)]that were first derived to ascertain the small-strain deformation characteristics of leukocytes.Power-lawstructuraldampingmodels[Alcaraz,Buscemi,Grabulosa,Trepat,Fabry,Farre,and Navajas(2003)]deal with the dynamic characteristics of the cells whereas previously mentioned models are mostly obtained using transient conditions[Lim,Zhou,and Quek(2006)].
On the other hand,some models were derived using a micro-structural approach that deals with the underlying mechanics of cytoskeleton[Deshpande,McMeeking,and Evans(2006);Wang(2000);Vernerey and Farsad(2011);Foucard and Vernerey(2012)].Some of these models are based on the idea that the mechanical behavior of a cell mainly depends on the filamentous structure,the cytoskeleton,by means of its components such as microtubules,micro filaments and intermediate filaments that are in the form of an integrated network[Wang,Naruse,Stamenovic,Fredberg,MijailovichTolic-Norrelykke,Polte,Mannix,and Ingber(2001)].Wide range of cytoskeletal models have been developed using numerical and computational tools[Stamenovic and Ingber(2002)].One of the cytoskeletal models is the open-cell foam model in which the cross-linked network is considered as a porous solid matrix[Satcher and Dewey(1996)].Another model treats the cytoskeleton as a prestressed cable network in order to predict the elastic properties and emerging forces by deforming the model mechanically[Coughlin and Stamenovic(2003)].A further mechanical model was proposed by Maurin,Canadas,Baudriller,Montcourrier,and Bettache(2008)in which the form- finding structure of the cytoskeleton is investigated by using a granular structure representing the interconnected network of filaments in cytoskeleton.Also,a semi flexible network approach is used by Roy and Qi(2008)with the aim of gaining an insight in deformation mechanics and elastic characteristics of the network model.A further 3D model is proposed by Zeng and Li(2012),which is developed as a soft matter cell model to study the mechanotransduction of stem cells.In addition to mechanical models of cytoskeleton,an architectural structure ‘tensegrity’has been used for modeling the interconnected network of filaments since the existence of compression and tension members in the tensegrity structure represents the mechanical force balance and the sustainability in cytoskeleton[Coughlin and Stamenovic(1998);Stamenovic,Fredberg,Wang,Butler,and Ingber(1996);Ingber(2008)].The tensegrity structure is used to explain cell motility and shape changes of the cell since it provides a comprehensive approach where the mechanical integrity is maintained and a self-equilibrium is obtained through the contribution of actin filaments that are under tension and microtubules that are under compression[Ingber(2003),Ingber(2008)].To gain a deeper understanding in the architectural structure of cytoskeleton on the basis of tensegrity concept several finite element models were developed to explain the non-linear structural behavior[McGarry and Prendergast(2004)],the mechanotransmission processes using mechanical perturbations[Wendling,Canadas,Oddou,and Meunier(2002)],or the viscoelastic contractionretraction of the pretensed network using a multi-modular approach of tensegrity[Luo,Xu,Lele,Kumar,and Ingber(2008)].
From a computational point of view[Sander,Stylianopoulos,Tranquillo,and Barocas(2009);Cukierman,Pankov,Stevens,and Yamada(2001)]it can be concluded that the cell does not interact continuously with its surroundings,but actually forms attachments that are distributed in a non-affine and heterogeneous fashion.The tensegrity structure[Ingber(2006)]will be appropriate to model such behavior.
Till now,the mechanism by which the mechanical forces applied at the macroscopic scale influence specific molecular activities remains unknown in most somatic organ systems.Tensegrity modeling allows to create a model of the cell and shows how the cell’s behavior depends on the surface topography.When a cell attaches to a particular surface,it changes its geometry,effectively as if external forces were applied to the cell membrane to force its deformation.Thus,mechanotransduction is not only the reaction of the cell to the external mechanical effects,but also the reaction of the cell to the change of the surface topography.Study of structure interactions within the cell will provide important insight for understanding and modeling related molecular mechanisms.In order to elucidate the spreading and alignment phenomenon of cell,an approach based on total strain energy of a cell is employed.A similar approach was also employed by Li,Feng,Cao,and Gao[2010]where they implemented the Monte Carlo method based on minimizing the strain energy of the tensegrity structure for their optimization problem.In present study,we evaluated the effect of the surface geometry on the strain energy of a spread cell.The cytoskeleton of a cell was modeled as a tensegrity structure and its strain energy was calculated based on the geometry of surface it is attached using Finite Element Analysis tools.
Besides computational and analytical models,various experimental techniques were also used to study the influence of surface pattern on cell adhesion and orientation,since cellular interaction with micro-structured surfaces is very important for various biomedical applications from tissue engineering to lab-on-chip devices.In recent years,significant efforts have been made to develop micro-textured polymeric materials for application in biomedical systems[Feinberg,Wilkerson,Seegert,Gibson,Hoipkemeier-Wilson,and Brennan(2008);Su,Liao,and Chu(2007)].Cell patterning techniques[Kawashima,Kimura,Shibata,Kishida,Mineta,and Makino(2010);Huh,Torisawa,Hamilton,Kim,and Ingber(2012)],which provide the basis approach for manipulating cells,play an important role in understanding functions of both individual cells and the cell-cell interaction.
A range of factors affect the behavior of cells on structured surfaces,including surface chemistry,surface geometry,and cell type[Martínez,Engel,Planell,and Samitier(2009)].The ability to control the location and alignment of cells in an organized pattern on a substrate is important for the development of cellular and tissue engineering applications[Bhatia,Toner,Tompkins,and Yarmush(1994);Hammarback,Palm,Furcht,and Letourneau(1985);Healy,Lom,and Hockberger(1994)].Recently,a reconfigurable microtopographical system customized for cell culture and imaging that consists of reversible microfeatures on poly(dimethylsiloxane)(PDMS)has been constructed.The reversible topography is able to align,unalign,and realign C2C12 myogenic cell line cells repeatedly on the same substrate within 24 h intervals and did not inhibit cell differentiation[Lam,Clem,and Takayama(2008)].
For individual cells,adhesion to the extracellular matrix or to the cell culture substratum when grownin vitroplays an essential role for many processes such as proliferation and differentiation.The manipulation of cell growth through topographical features on a substrate can have significant impacts in tissue engineering.With the knowledge of cell behavior in response to such features,we can engineer various substrates to control cell proliferation in favor of its desired application.
Several researchers have studied the effects of micro-groove geometry on cell spreading and alignment on PDMS[Salber,Grater,Harwardt,Hofmann,Klee,Dujic,Huang,Ding,Kippenberger,Bernd,Groll,Spatz,and Moller(2007);De Silva,Paulsen,Renn,and Odde(2006);Chaw,Manimaran,Tay,and Swaminathan(2007)].One study using human osteo-sarcoma(HOS)cells on PDMS surfaces shows that micro-groove spacing and height can influence the cell spreading and adhesion[Fu,and Soboyejo(2009)].In this study,micro-grooves with well-controlled ridges and spacing were fabricated by curing PDMS in silicon molds produced by photolithography.
From an experimental side of view,in most current studies,a groove structure with sharp corners has been widely used.In this study,micro-wavy surfaces are employed since they provide a simple platform to study cell interaction with curved surface pro file,and cell patterning and orientation on curved surfaces.While most current studies focus on flat surfaces,cells are usually interacting with non- flat surfaces.For example,in capillary vessel with a diameter of 5-10µm[Nielsen(1984)],the endothelium cells are actually covering a highly curved surface.It is a fundamental and interesting question if the cell response to a flat surface is the same as to a curved surface.
Motility of cell may be encouraged by various factors,such as chemotaxis(response to a chemical gradient)[Zhelev,Alteraifi,and Chondniewicz(2004)],galvanotaxis(response to a potential gradient)[Curtze,Dembo,Miron,and Jones(2004)],or mechanotaxis(response to the underlying surface rigidity)[Lo,Wang,Dembo,and Wang(2000)].In this study,we aimed at developing a multi-scale computational model defining “sensor”elements that probe the surface continuously and decide on the direction of spreading.The model is considered as multiscale since the model includes multiple scales of length in terms of sensor node movement and overall spreading behavior.The node probing and movement occur at a smaller scale than the resultant spreading of the cell.The multi-scale model is used to understand the mechanics of cell-curved surface interaction-topotaxis and compare the obtained results with the observed effects of the various curved micro-patterns on initial seeding,spreading and alignment of cells.We employed an approach in which the total strain energy is used as the main criterion for spreading and alignment.Our hypothesis is based on the idea that cell tries to spread and move in a way to decrease its internal elastic energy and stay at a possible minimum energy state.This approach is implemented here to investigate the spreading characteristics of a cell on different topologies.Combining experimental and computational modeling allowed us to compare and validate the observed results of both approaches while studying cell interaction with a micro-scale curved surface.
2 Computational Model and Methods
2.1 Modeling Cell Spreading Process
2.1.1Model Description
In this study,a 30 member tensegrity structure is used to model the cytoskeleton of a living cell.There are 6 pre-compressed struts and 24 pre-tensed cables in the cytoskeletal model.The struts are analogous to microtubule members which carry compressional loads,and the cables correspond to the micro filament members that bear the tensional loads.Since tensegrity is an architectural structure that maintains its stability due to the compression and tension members,the model is generated accordingly;having the members that bear tensile and compressive forces with specified material properties.The cytoskeletal model is presented in Fig.1A-B.

Figure 1:Cytoskeletal tensegrity model(A).Black colored numbering represents the micro filaments(cables),red colored numbering represents the microtubules(struts),and the node numbers are shown as green(B).Horizontal planes(layers)formed by the nodes that are at the same elevation with respect to the x-y plane(C).

Figure 2:Initial con figurations of the cell model located on the flat surface(A);trough(B),peak(C)and slope(D)positions of the wavy surface.
The model is in equilibrium initially,which corresponds to the stage that the complementary force balance is preserved within the cytoskeletal members resulting in a stabilized and equilibrated model.There are 12 nodes in the model that interconnect the struts and cables,representing the possible cell-matrix adhesion sites,namely focal adhesions(FAs),which create a linkage to the extracellular matrix(ECM).The computational model allows the strut and cable lengths to increase or decrease.The nodes are allowed to move in 3-D,representing the spreading and active movement of the cell.The initial tensegrity model has a height of 8.7µm and the distance between struts is 5µm.Nodes that are at the same elevation with respect to the x-y plane generate horizontal planes(layers)(Fig.1C).The distance between the top and bottom planes for the undeformed structure defines the initial height of the cell.ANSYS Mechanical APDL1ANSYS,Inc.,Canonsburg,PA,USAis used as the finite element analysis tool in which the model is created and simulations are carried out.The wavy surface has a period of 20µm and a height(peak-to-peak amplitude)of 6.6µm,which is consistent with the topological characteristics of the seeding surface used in the experiments.Initial con figurations of the cell model on flat,trough,peak and slope positions are displayed in Fig.2.
The displacement is calculated as,

Eq.1 is given as a matrix form where]is the element stiffness coefficient matrix,is the element nodal displacement vector,andis the vector of element nodal loads.
The force balance within the tensegrity structure is preserved with the complementary force balance of tension and compression members.Length of struts and cables are subject to change in order to conform to a balanced structure.Denoting cross sectional area asAi,elastic modulus asEi,length asLi,and axial force asFi;the change in length,ei,for theithcable or strut is given as,
and the stiffness is given as the ratio of force to displacement,which is denoted byk

The total energy is sum of the strain energy of microtubules and actin filaments.Hence,the total strain energy is calculated by the following equation,

whereUTdenotes the total energy,anddenote the stress and strain components for the microtubules respectively,andare the stress and strain components for the actin filaments respectively as well.Vstands for the volume of the elements.
2.1.2Mechanical Properties of Cellular Components
The flexural rigidity of microtubules and micro filaments were assigned on the basis of the experiments performed by Gittes,Mickey,Nettleton,and Howard(1993),where they polymerized microtubules from thrice-cycled,phosphocellulose-purified tubulin.All struts and cables are assumed to be elastic.The initial lengths of microtubules are 10µm[Coughlin and Stamenovic(1998)]and they are subject to change in each subsequent simulation.The mechanical properties of constitutive elements in the tensegrity structure are provided in Tab.1.
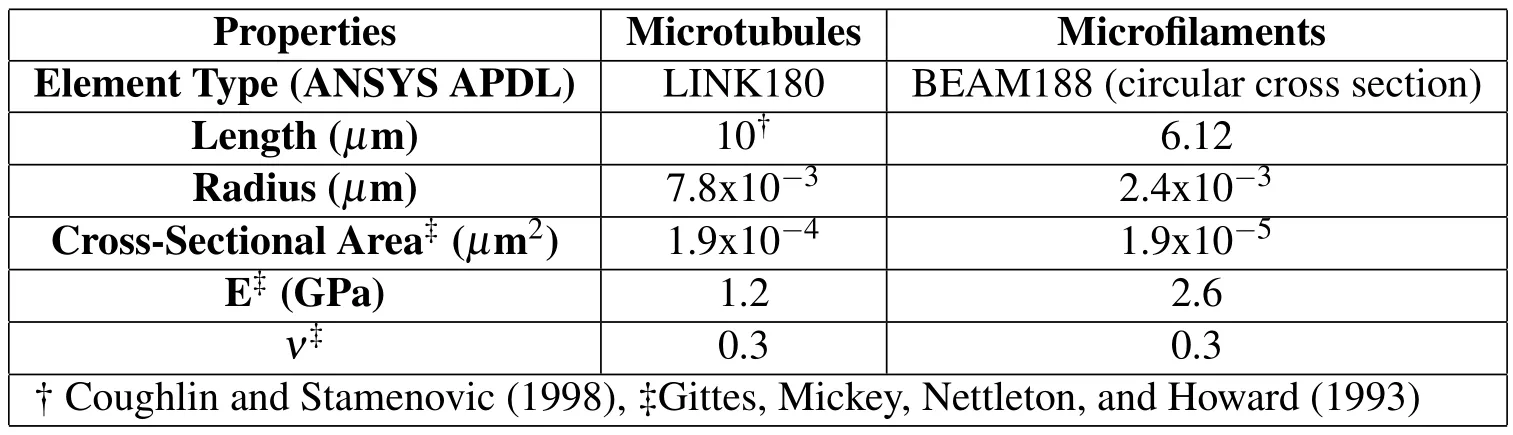
Table 1:Physical and mechanical properties of the cellular components in cytoskeletal model.
2.1.3Prestress and Initial Constraints
Prestress is the key factor in maintaining cell shape.Prestress is present within cytoskeleton(CSK)and originates from the tensional forces that occur in the micro filaments[Stamenovic(2012)].These forces are channeled across the intermediate cytoskeletal filaments and balanced by the compression elements,microtubules,and traction forces that are present at focal adhesions[Stamenovic and Ingber(2009)].Also,in addition to the vital cellular functions like cell migration,cell spreading,proliferation and mechanical signaling through interconnections,many other fundamental functions within the cell could also be dependent on the level of the contractile prestress in living cells.Prestress also plays an important role in determining cellular stiffness as shown in experiments conducted with the use of prestressed actin networks[Gardel,Nakamura,Hartwig,Crocker,Stossel,and Weitz(2006)].This was also suggested in the experiments where a cell-stretching system was used to investigate the relationship between cell stiffness[Pourati,Maniotis,Spiegel,Schaffer,Butler,Fredberg,Ingber,Stamenovic,and Wang(1998)]and prestress[Rosenblatt,Hu,Chen,Wang,and Stamenovic(2004)].
One of the unique characteristics of tensegrity structures is that they consist of prestressed members which provide the ability to preserve equilibrium even if no external force is applied on the structure[Sultan,Stamenovic,and Ingber(2004)].Hence,it is a suitable approach to embed the concept of tensegrity into CSK modeling in order to simulate cell spreading and movement.In this study,the prestress on the cytoskeletal members is preserved as the micro filament stiffness varies.Contractile prestress within the model is acquired by imposing the corresponding tension and compression forces onto the nodes.
Initial constraints(IC)were de fined for some nodes to simulate focal adhesions and cell-surface interactions.Rest of the nodes,which are not constrained,serve as candidates of FAs since the cell spreading is a continuous process and may lead those nodes to come into contact with the substrate surface.
In order to model the cell adhesion on surface after seeding,bottom nodes that are in contact with the surface are anchored to the surface to represent the focal adhesion sites.Two different set of bottom constraints are employed in the simulations.In the first set of constraints,nodes 2 and 3 are constrained only in one translational degree of freedom,which is z-direction.This type of constraint allows them to slide along the x-y plane during spreading of the cell;however,node 1 is anchored to the surface such that it is constrained in all translational degrees of freedom.In the second set of constraints,only node 1 is anchored to the prescribed surface and constrained in all translational degrees of freedom.
In addition to different bottom constraints,two different initial con figurations of the model are employed in the simulations.First one is the case in which the bottom plane of the model is horizontal and parallel to the flat surface,and three bottom nodes are at the same elevation.For the second case,the model is initially rotated∼12 degrees in x-direction.
2.1.4Simulation Method and Modeling
Active adhesion and focal adhesion modeling can serve as an effective method in cell spreading on the ECM since this approach describes not only the passive formation of adhesive bonds by cell attachment process,but also the cell spreading.Hence,the proposed model includes an important element capable to describe the sensing of the surface that cell is located upon.Sensing elements are introduced in FE model that are able to randomly probe the surface close to the cell.The probing is modeled as an active element(node)capable to change its location and thus changing the cell’s shape.The “sensors”travel to touch the surface,hence,the strain energy of the cell changes which is computed at each step.This information is used to decide on the probable movement of the cell toward and along the surface.In the proposed model,the cell randomly extends nodes and evaluates associated change in strain energy.This information will allow the cell to select the preferable direction of motion.The model will repeat such process until the cell is attached to the surface.Due to the randomness in the extension of the “sensor”,it is expected that this model is able to simulate the distribution of cells on the curved surface in a realistic manner.
The effects of gravity and magnetic field are neglected in the simulations.The approach and procedure of the simulation process are described as follows.In each iteration step,one of the nodes that is not constrained in translational degree of freedom is given an incremental displacement in negative z direction.As a result of this motion,strut and cable lengths may change in accordance with the assigned ma-terial properties.Node locations also alter within the constraints of the tensegrity structure.At the end of the load step,the total strain energy is calculated and stored in the database for further processing.The strain energy of the cytoskeleton is obtained by strain energy summation of all elements:struts and tension cables.After obtaining and storing the strain energy,the simulation returns back to the initial con figuration step that it originates and all nodes relocate to their initial positions.Hence,the initial state is obtained again.This time,another node that is not constrained in translational degrees of freedom is given an incremental displacement,and previously explained steps are repeated.
The simulation is repeated until all the nodes(except the constrained ones)are given an incremental displacement,and the resultant total strain energy values are stored for each generated con figuration.Once the explained steps are executed within the algorithm,the decision making phase becomes effective.At this stage,a comparison is made between the total strain energy values.The con figuration that has the lowest total strain energy from all con figurations is selected.Hence,the corresponding node that resulted in a lower energy is chosen as the “sensor”node and given the incremental displacement.The application of this incremental displacement leads the cell to change its shape.The updated model and new locations of nodes are stored to be used as the new initial state of the cell in the consecutive iteration steps of the simulation.As a next step,which can be considered as a decision step,to check if the “sensor”node reaches the surface or if any other node makes a contact with the surface,the distance of each node with respect to the surface that the cell resides on is calculated and stored.These obtained values are then used to check whether the locations of nodes(with respect to the surface)are within the prescribed threshold value.If any node appears to be within the threshold value,then this node is constrained in z direction,but free to slide on x and y directions which mimics the focal adhesion site formed on the surface,binding the cell to ECM.
In the second phase of the decision step,the algorithm for the termination criterion is executed to check whether the height of cytoskeletal model reaches the half of its initial height after spreading on the prescribed topology.The specific height that is used as the termination criterion is based on the nucleocytoplasmic volume ratio(RN/C)of BAECs.Experimental results investigating the affect of cellular dimension on nucleocytoplasmic volume ratio indicate that RN/Cof endothelial cells is∼0.23[Swanson,Lee,and Knapp(1991)].In order to preserve the volume of the rigid nucleus and to account for the spreading of the cell,half of the initial height of the cell is used as the final spread height.If the model reaches the desired height after spreading,then the iterations stop and simulation ends.If not,resultant motion that takes place due to the sensor node is taken into consideration and is used as the updated model.Modified state of the structure and new locations for each node are stored to be used as the new initial state of the cell and appropriate numerical implementation and enhancements are applied at the beginning of the consecutive iteration step.This iteration procedure is executed until the desired height of the cell is attained.Explanation of the steps in the simulation procedure is provided as a fl ow chart in Fig.3.

Figure 3:Flow chart of the simulation process.
3 Results
3.1 Simulation of Cell Spreading on Various Positions of Wavy Topology
To assess the tendency of the cell when spreading on different positions of the wavy surface and to understand the relationship between cell spreading and the change of elastic strain energy during spreading process,the cytoskeletal model was placed on different positions of the wavy surface.
Simulations are performed on flat,trough,peak and slope positions of the wavy pro file to observe the interaction of an individual cell with specific topology and to test if the model attaches and spreads on the prescribed surface in a realistic manner.The goal in each step of simulations is to obtain a con figuration that leads to a lower strain energy state.This goal is pursued by deforming the model by giving incremental displacements to the nodes in order to find a sensor node by comparing the resulting strain energies for the trial con figurations.Whichever node among the candidates favors the decrease in the system energy is chosen as the sensor and is imposed to the incremental motion.
To observe the effect of initial constraints on spreading kinetics,two different sets of bottom constraints are imposed on the cytoskeletal model.Those constraints mimic the focal adhesion sites that are formed right after cell seeding.In the first set(initial constraint set 1),node 1 is pinned to the prescribed surface and constrained in all translational degrees of freedom,which are x,y and z-directions.Nodes 2 and 3 are constrained only in z-direction,which gives them the ability to slide on x-y plane and simulate the spreading process.In the second set of constraints(initial constraint set 2),only node 1 is anchored to the prescribed surfaces and constraint in all translational degrees of freedom.For the slope position,only node 2 is anchored to the surface instead of node 1,hence it is also categorized as initial constraint set 2 since only one node is constrained in all directions.Simulations for the slope position are only handled with one set of initial constraints since it would not be realistic or possible to create more than one constraint on the slope due to the cell’s initial position with respect to surface.Also,two different initial con figurations of the model are employed in the simulations.In the first case,the bottom plane of the model is horizontal(non-rotated).Second one is where the model is rotated 12 degrees around x-axis.
Spreading of the cell on the flat surface for different cases of initial constraints and con figurations did not show significant differences in terms of final shape.On the contrary,for each case of simulations,the cell models after spreading showed similarity by means of final shape and alignment.The final shape of non-rotated model on flat surface with second set of initial constraints applied can be seen in Fig.4A.Most of the nodes became the focal adhesion sites by making contact with the surface.As the spreading area increases,the shape tends to become conical,due to the sensor node movement.The decision criterion at each step of iterations leads to the selection of a sensor node among other candidates.This criterion is based on selecting a node whose motion results in lower total strain energy when compared to the resultant energy of other candidates’movement.
When the final con figuration for the trough position case is considered(Fig.4B),it should be noted that the model tried to spread within the troughs of the surface such that it fills the concave pro file instead of spreading upwards.This type of behavior is observed in all four cases.However,when the final con figurations for the peak position cases are considered(Fig.4C),the tendency of the cell to spread downward becomes prominent.
The simulations on flat,trough,slope and peak positions used the same dimensional characteristics as the ones used in the experiments.The procedure of the simulation process is the same for flat,trough,and peak positions.The only difference between the algorithm for slope position and other cases is that each iteration step is done by dividing it into two steps.In the first,one of the nodes that is not constrained in translational degrees of freedom is given an incremental displacement in–z and–x directions,to simulate the downward spreading of the cell through the trough of the wavy pro file.In the second part of the iteration,the same node is given an incremental displacement in+z and+x directions this time,to simulate the upward spreading of the cell through the crest of the wavy pro file.In each iteration step the decision criterion becomes effective to decide on the direction of motion for the node which would result in a lower energy level than the reverse motion.At the next step,another node that is not constrained in translational degrees of freedom is given an incremental displacement,and previously explained steps are repeated.The simulation is repeated until all the nodes(except the constrained ones)are given the upward and downward incremental displacements,and the resultant total strain energy values are stored for each generated con figuration.Then,a comparison is made between the total strain energy values.The con figuration that has the lowest total strain energy is selected.The use of slope position on surface pro file leads us to see what type of behavior is illustrated by the cell when seeded onto a curved surface.This observation serves as a guide in understanding the spreading kinetics and show whether the cell prefers to move toward the crest or trough.

Figure 4:Final spread con figurations of the cytoskeletal model at the end of simulations on flat surface(A),and trough(B),peak(C)and slope(D)positions of the wavy surface for non-rotated case initial constraint set 2.XZ-is the cross section of the wavy plate and XY-is the top view of the plate.

Figure 5:The resultant strain energy values for the final spread con figurations of the cell on different surface topologies for the initial constraint set 1(IC Set 1)case(A);for the initial constraint set 2(IC Set 2)case(B).Simulations obtained by placing the cell initially on the slope position are only executed by anchoring one node to the surface(IC Set 2)due to the cell’s initial position with respect to surface.Thus,IC Set1 is not applied to the slope position cases.(NR=non-rotated model,R=rotated model)
The total resultant strain energy values for the spread con figurations are obtained and shown in Fig.5A for the initial constraint set 1 with rotated and non-rotated model cases.The peak position leads to a higher energy value in both cases whereas the flat pro file has the lowest final energy value for the non-rotated model.When the rotated model case is considered it is observed that the model initially placed on the trough position has a lower energy than the model placed on flat surface.For non-rotated and rotated cases,the final energy values for peak position do not show a significant difference,which means that the initial position of the model does not affect the overall motion of cell in terms of energy.Hence,the model shows a similar behavior no matter how it is oriented at the initial seeding,which shows the independence of motion from initial orientation.Same conclusion can be made for the model initially placed on trough and slope positions of the surface.The resultant strain energy values appear to be comparable respectively,which also highlights the fact that placing the model on the surface with a different orientation by rotating the model does not affect the overall pattern of motion when the cell is seeded on peak,slope or trough positions.For the flat case,however,the difference of energy values is significant for the two set of initial orientations.This may be because of the random motion of the model on the flat surface.Since there is not a topological preference on the surface,there may not be a factor that triggers the cell to move at a preferable direction.Hence,the direction of motion is not decided upon analyzing topological differences,which may result in a random motion.The motion and energy levels of cell on flat surface may not be correlated to initial conditions since the simulations on flat surface can be considered as random.Resultant energy values obtained by imposing the initial constraint set 2 to the cell model(Fig.5B)also show that the energy level is the lowest for the rotated model that is initially placed on the trough position.In addition,energy level is highest for the peak positions similar to the observed results for the case where initial constraint set 1 is applied(Fig.5A).In agreement with the results that show the proneness of the cell to fill the troughs of the wavy surface(Fig.4B-C-D),the resultant strain energy values may also show the tendency of the cell to spread downwards instead of staying at crests when the resultant energy values for trough and peak positions are considered.
Total number of iterations until the model reaches the desired height by spreading on the surface indicates that the simulation takes more time for the peak position cases and it takes more steps to reach the desired level of spreading(Fig.6).However,the simulations end at a shorter time for the trough and flat positions in all the cases.
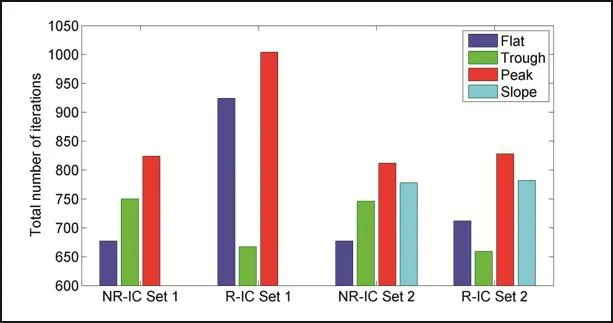
Figure 6:Total number of iterations within the simulation process until the cell model becomes spread on prescribed surfaces(the cell reaches half of its initial height).IC Set1 is not applied to the slope position cases.(NR=non-rotated model,R=rotated model)
The nodes that are at the same elevation form planes(layers)parallel to each other.At first sight,one can hypothesize that the nodes which are closer to the surface should be selected as sensor nodes and move downwards through the surface in the iterative steps of spreading since it would be easier to spread from bottom to top.This type of motion would be more feasible for the lower nodes since they can sense the underlying surface more easily than the nodes located at higher elevations.As expected,at the first steps of iterations,the nodes that are at lower locations(nodes 4,5,6)are chosen as sensors since they are closer to the surface and can sense the ground better than the nodes located at higher elevations.After some degree of spreading is attained and new focal adhesion sites are formed,nodes that locate at higher positions compared to the bottom nodes start to move as well since they are now the candidates as sensors and can easily sense the ground.This process continues until the cell spreads on the surface and reaches half of its initial height.The spreading proceeds as follows:the nodes that form the second layer(nodes 4,5,6)move at the initial steps of iterations,than the nodes forming the third(nodes 7,8,9)and fourth(nodes 10,11,12)layers start to move in the following iteration steps.After that,the selection of sensor nodes,based on the energy criterion within the algorithm,becomes independent from the layers since the cell is spread some amount and the locations of the nodes cannot be categorized as done previously.Hence,the nodes that are now closer to the surface in the new con figurations serve as candidates for sensors obeying the criterion based on lowering the strain energy.In order to verify the computational model,experimental techniques are used to observe the spreading and alignment behavior of cells.In the experiments,Bovine aortic endothelial cells(BAECs)are seeded on poly(dimethylsiloxane)(PDMS)wavy surface.Experimental procedure and results are provided in the next section.Comparing experimental observations with the aforementioned computational results,the cell interaction and spreading behavior with curved surfaces is analyzed in a more complementary manner.
3.2 Experimental Verification
3.2.1Fabrication of Micro-wavy Patterned Substrates
The smooth micro-wavy surface is fabricated through bucking of oxide/polymer bi-layer[Khare,Zhou,and Yang(2009);Lin and Yang(2007)].Basically,a PDMS film substrate is stretched mechanically by a stretcher,then treated with plasma to induce a hardened oxide top layer.After releasing,due to the difference in hardness,the oxide/PDMS bilayer bucks and forms wrinkled surface.The wavelength(λ)and amplitude(A)of the wrinkles can be tuned by varying the elastic modulus of the PDMS substrate and the thickness of the top silicate layer,which are controlled by the mixing ratio of the PDMS resin/crosslinker,UVO/O2 exposure time,the modulus and thickness of the hard layer,and the applied strain[Lin and Yang(2007);Bowden,Huck,Paul,and White sides(1999);Stafford,Harrison,Beers,Karim,Amis,VanLandingham,Kim,Volksen,Miller,and Simonyi(2004);Huang,Hong,and Suo(2005)].The typical wavelengths of fabricated wrinkles are 10 to 50µm,with aspect ratio(A/λ)≤0.3.The micro-wavy pattern used in this study was created with a wavelength of 20µm and a height of 6.6µm,as shown in Fig.7A-B.
3.2.2Cell Culture
Bovine aortic endothelial cells(BAECs)were maintained in T25 cell culture flasks(Becton Dickson),and incubated at 37˚C and 5%CO2.BAECs between passages 10-15 were used in this study.
All reagents and chemicals for cell culture and detachment were purchased from Sigma-Aldrich USA.Prior to cell seeding,the substrates were sterilized by rinsing with 70%ethanol(2 h),followed by washing with DI water and autoclaved for 1 h.The surfaces were rinsed with 0.2%gelatin for 2 h in the incubator to increase cell attachment to the substrates.The substrates were rinsed in supplemented medium for 1 h before cell seeding.

Figure 7:Geometry of micro-wavy pattern.(A)Micro-wave cross-sectional figure;(B)1D 20µm wavelength wave pattern.Scale bar=50µm.
The cells were harvested using trypsin after reaching approximately 80%con fluency.Cells were centrifuged and resuspended in Dulbecco’s modified Eagle medium(DMEM)(Sigma Aldrich)with 10%heat inactivated Fetal Bovine Serum and 1%Penicillin/Streptomycin.Next,cells were seeded at a concentration of approximately 2.5×10⁵cells/mL on the substrates.After 24 h incubation,images were taken with a Nikon phase-contrast microscope with an objective magnification of 20×.
BAECs were cultured on 20µm wavy surface for 24 h.
3.2.3Experimental Results for Cell Alignment and Elongation

Figure 8:Microscope images of cells after 24 h.Flat PDMS substrate(A)and 20µm spacing,6.6µm height micro-wavy surface(B).
BAECs were seeded onto a micro-wavy surface with a wavelength of 20µm and a flat surface.In the light microscope image,the white lines in the picture are the peaks of the wavy surface.The distance between the two peaks is 20µm.After 24 h cell seeding,a subpopulation of the BAECs on substrate patterned with 20µm wavelength and 6.6µm deep waves were elongated and aligned along the direction of the patterns,while those on the flat surface appear to be randomly oriented,as shown in Fig.8A-B.
The cell alignment angle was de fined as the angle between the longest chord in the cell and the direction of the wavy pattern(Fig.9).The extent of cell alignment after spreading for 24 h was analyzed and quantified using Image J software to determine the location and alignment angle of cells.Cells were considered to be aligned with the substrate patterns when the cell alignment angle was less than 10◦[Clark,Connolly,Curtis,Dow,and Wilkinson(1990)].Approximately 75%of the cells cultured on substrates with 20µm wavelength and 6.6µm deep waves were aligned with the substrate topographies.On the flat substrate,cells were randomly oriented.Randomly oriented cells have an angle of 45◦[Jiang,Takayama,Qian,Ostuni,Wu,Bowden,LeDuc,Ingber,and White sides(2002)].
Cells were either elongated or aligned with the wave direction or were approximately round.To quantify the cell distribution and alignment,the trough parts of the wavy surface was analyzed.The alignment angles for the cells on the trough positions averaged at 14◦±6◦.Meanwhile,most of the cells were found to be located at the troughs of the wavy surface(Fig.10).

Figure 9:Alignment angle definition.
In order to compare experimental findings of cell alignment and elongation on trough positions of surface with the computational results,alignment angles of spread models are obtained for each set of initial constraints and con figurations for the model initially located on the trough of the surface.An ellipsoid is fitted using the coordinate data of nodes at the final spread con figuration of the model.A representative plot is demonstrated in Fig.11.Following a similar approach as done when processing the experimental data,the angle(θ)between the long axis of the cell and the direction of the wavy pro file is calculated.

Figure 10:Histogram of cell distribution on the peak,slope and trough of the 20µm spacing,6.6µm height micro-wavy surface.

Figure 11:Ellipsoid fitted to coordinate data for the final spread con figuration of the model that is initially placed on trough position of surface(R-IC Set 1 case).
As it can be seen in Fig.12,the alignment angles for the models at trough positions range between 15◦and 19◦.This result compares well with the experimental data where the alignment angles are found to be 14◦±6◦.
4 Discussion
The results of simulations obtained by placing the cell initially on peak and trough positions indicate that the spreading of the cell that satisfies the criterion of obtaining a lower elastic energy is toward the lower part of the wavy surface pro file.This can be interpreted as the proneness of the cell to fill the troughs of the wavy surface instead of staying at the crests.In Fig.4C,it can clearly be seen that the cell tended to spread toward the trough,whereas in Fig.4B,the cell stayed at the trough and spread along the direction of the wavy pattern.
The result of the slope position simulation indicates the tendency of the cell to spread downward to fill the trough instead of staying on the inclined part of the surface or spreading upward through the crest(Fig.4D).The final con figuration of the cell is similar to the final resultant shape obtained by placing the cell model initially on the trough position of the surface.The cell spread on the surface and tried to fill in the space that it sits on by attaching the sensor nodes to the surface and expanding in a way to increase its contact surface area.Hence,it can be concluded that the effective mechanism in decision making process can be the procedure of choosing a direction of spreading that leads to a lower energy level by moving the appropriate node that obeys the energy criterion and attains a level of spreading at a minimum number of incremental movements(Fig.6).This result is consistent with the experimental findings obtained by seeding cells on wavy surface pro file.Most of the cells were found to be located at the troughs of the wavy surface after seeding(Fig.10).Not only the cells on the wavy surface attach to the troughs of the waves(Fig.8B),but they also align along the wave direction,which can explain the behavior of the cell to expand more on troughs of surfaces,resulting in a larger spreading area on contact surface.
On the basis of the minimum strain energy it can be stated that the spreading patterns and energy levels are independent from the cell initial orientation or the node restrictions of the model initially placed on the trough,peak,and slope positions of the surface(Fig.4B-C-D).The resultant energy levels do not show significant difference for non-rotated or rotated models when the cell is on trough,slope or at the peak.For the flat case,however, final energy levels show difference for the non-rotated and rotated initial con figurations.The randomness in spreading on flat surface may be the main reason for such a result in energy levels.In the experi-ments,it is also observed that the distribution of cell alignment angles for BAECs were uniform on the flat surface,which manifests random orientation of cells on the substrate.In terms of computational perspective,since the topology of a flat surface does not have geometrical variations as in a wavy surface,the model may not need to select a specific direction of spreading.As a result,the differences in the resultant energy levels may be due to the random taxis of the cell observed during spreading,which is consistent with the experimental observations.Hence,it can be concluded that initial orientation of the model may not give comparable or gaugeable results on flat surface in terms of preferred direction of spreading.On the other hand,resultant energy levels for the cell that is placed on trough,slope,and peak show comparable and consistent results respectively.This means that the model shows the same behavior whether it is initially rotated or not.Hence,the initial orientation does not affect the overall spreading of the modeled cell when it is on peak,slope or trough.The resultant energy is highest for all cases of the model placed on peak,while the energy levels at the trough and slope positions are lower than the peak position energy values in all cases(Fig.5A-B).Experimental results also demonstrate that the majority of the cells are located at the troughs of the surface when observed 24 h after cell seeding(Fig.10).In conformance with the experimental results,the resultant strain energy values for the peak,slope and trough positions show the proneness of the cell to spread downwards and fill the troughs of the wavy surface.This might be due to the fact that the energy level is lower when the cell spreads downwards and fills in the troughs.Crests might not be the preferred locations to stay on or move through when seeded on the surface since the model tends to move in a way that the energy levels decrease or stay low,which might be satisfied by spreading downwards towards the troughs.
The total numbers of iterations for each set of simulations until the model reaches half of its initial height are given in the Fig.6.Combined with the results of strain energy values(Fig.5A-B),iteration numbers may indicate that the cell may prefer to spread in such a way that the final con figuration with lower energy is achieved at the shortest possible time,or with less movement.This might be the underlying mechanism of cell spreading and the decision making process during cell spreading and alignment.
The orientation and alignment characteristics of cells have been studied by means of reaction to external stimuli[Noria,Xu,McCue,Jones,Gotlieb,and Langille(2004)].Topological effects on cell alignment have also been shown by Lam,Clem,and Takayama(2008)by observing the reorientation and alignment of myoblast cells on reversible waves.In present study,the effect of alignment angle is investigated by observing the cells on the wavy pattern 24 h after cell seeding and measuring the alignment angle which is defined as the angle between the long axis of the cell and the direction of the wavy pattern.The alignment angles are found to be 14◦±6◦for the cells located at troughs.These results are in agreement with the alignment angles for the computational model at trough position that range between 15◦and 19◦(Fig.12).

Figure 12:Alignment angles for different set of initial conditions and orientations for the model initially located on trough position of surface(NR=non-rotated,R=rotated).
5 Conclusion
The mechanics of cell-curved surface interaction is studied through a computational model of cell cytoskeleton based on the tensegrity structure.Cells are held on different positions of the wavy surface topology to investigate the possible active mechanisms that control the spreading and alignment of the cell and the preferred locations on wavy surfaces that the cell is most likely to bind on and spread.The prominence of changes in strain energy during spreading phenomenon is observed by controlling the decision making process of sensor node selection.The sensor nodes can be considered as the lamellipodium within the cell,a branched actin filament network,which triggers the motion of the cell by extending in the chosen direction of motion.Experiments conducted by Verkhovsky,Chaga,Schaub,Svitkina,Meister,and Borisy(2003)show that the growth and density changes of actin filaments which exist within the lamellipodium have a distinct effect on orientation and motility.Hence,implementing a procedure that actively controls the direction of motion can be considered as mimicking the role of lamellipodium and may be readily explained within the frame of spreading behavior.The computational model is also verified with the experiments where BAEC’s were seeded onto a micro-wavy PDMS substrate.Experimental and computational observations concur on the fact that cells response to topological cues.By analyzing the cell response to wavy surfaces,it is shown that cells tend to stay or move towards the troughs of the wavy pro file.
Acknowledgement:The authors acknowledge the supports for this work from National Science Foundation Grant Nos.CBET-1067502 and CBET-1113040 for Y.L.
Alcaraz,J.;Buscemi,L.;Grabulosa,M.;Trepat,X.;Fabry,B.;Farre,R.;Navajas,D.(2003):Microrheology of human lung epithelial cells measured by atomic force microscopy.Biophysical Journal,vol.84,no.3,pp.2071-2079.
Bhatia,S.N.;Toner,M.;Tompkins,R.G.;Yarmush,M.L.(1994):Selective Adhesion of Hepatocytes on Patterned Surfaces.Biochemical Engineering Viii,vol.745,pp.187-209.
Bowden,N.;Huck,W.T.S.;Paul,K.E.;White sides,G.M.(1999):The controlled formation of ordered,sinusoidal structures by plasma oxidation of an elastomeric polymer.Appl.Phys.Lett.,vol.75,no.17,pp.2557-2559.
Chaw,K.C.;Manimaran,M.;Tay,F.E.H.;Swaminathan,S.(2007):Matrigel coated polydimethylsiloxane based microfluidic devices for studying metastatic and non-metastatic cancer cell invasion and migration.Biomedical Microdevices,vol.9,no.4,pp.597-602.
Chen,C.S.;Mrksich,M.;Huang,S.;Whitesides,G.M.;Ingber,D.E.(1997):Geometric control of cell life and death.Science,vol.276,pp.1425-1428.
Clark,P.;Connolly,P.;Curtis,A.S.;Dow,J.A.;Wilkinson,C.D.(1990):Topographical Control of Cell Behavior:2.Multiple Grooved Substrata.Development,vol.108,pp.635-644.
Coughlin,M.F.;Stamenovic D.(1998):A tensegrity model of the cytoskeleton in spread and round cells.J.Biomech.Eng.,vol.120,no.6,pp.770-777.
Coughlin,M.F.;Stamenovic D.(2003):A prestressed cable network model of the adherent cell cytoskeleton.Biophysics Journal,vol.84,no.2,pp.1328-1336.
Cukierman,E.;Pankov,R.;Stevens,D.R.;Yamada,K.M.(2001):Taking cell-matrix adhesions to the third dimension.Science,vol.294,pp.1708–1712.
Curtze,S.;Dembo,M.;Miron,M.;Jones,D.B.(2004):Dynamic changes in traction forces with DC electric field in osteoblast-like cells.Journal of Cell Science,vol.117,pp.2721-2729.
De Silva,M.N.;Paulsen,J.;Renn,M.J.;Odde,D.J.(2006):Two-step cell patterning on planar and complex curved surfaces by precision spraying of polymers.Biotechnology and Bioengineering,vol.93,no.5,pp.919-927.
Deshpande,V.S.;McMeeking,R.M.;Evans,A.G.(2006):A bio-chemomechanical model for cell contractility.Proceedings of the National Academy of Sciences,vol.103,no.38,pp.14015-14020.
Dong,C.;Skalak,R.;Sung,K.L.;Schmid-Schonbein,G.W.;Chien,S.(1988):Passive deformation analysis of human leukocytes.Journal of Biomechanical Engineering,vol.110,no.1,pp.27-36.
Feinberg,A.W.;Wilkerson,W.R.;Seegert,C.A.;Gibson,A.L.;Hoipkemeier-Wilson,L.;Brennan,A.B.(2008):Systematic variation of microtopography,surface chemistry and elastic modulus and the state dependent effect on endothelial cell alignment.Journal of Biomedical Materials Research Part A,vol.86A,no.2,pp.522-534.
Foucard,L.;Vernerey,F.J.(2012):A thermodynamical model for stress- fiber organization in contractile cells.Applied physics letters,vol.100,no.1,013702.
Fu,G.;Soboyejo,W.O.(2009):Cell/surface interactions of human osteo-sarcoma(HOS)cells and micro-patterned polydimelthylsiloxane(PDMS)surfaces.Materials Science&Engineering C-Materials for Biological Applications,vol.29,no.6,pp.2011-2018.
Gardel,M.L.;Nakamura,F.;Hartwig,J.H.;Crocker,J.C.;Stossel,T.P.;Weitz,D.A.(2006):Prestressed F-actin networks cross-linked by hinged filamins replicate mechanical properties of cells.Proc Natl Acad Sci(PNAS),vol.103,no.6,pp.1762–1767.
Gittes,F.;Mickey,B.;Nettleton,J.;Howard,J.(1993):Flexural rigidity of microtubules and actin filaments measured from thermal fl uctuations in shape.The Journal of Cell Biology,vol.120,no.4,pp.923-934.
Hammarback,J.A.;Palm,S.L.;Furcht,L.T.;Letourneau,P.C.(1985):Guidance of Neurite Outgrowth by Pathways of Substratum-Adsorbed Laminin.Journal of Neuroscience Research,vol.13,no.1-2,pp.213-220.
Healy,K.E.;Lom,B.;and Hockberger,P.E.(1994):Spatial-Distribution of Mammalian-Cells Dictated by Material Surface-Chemistry.Biotechnology and Bioengineering,vol.43,no.8,pp.792-800.
Huang,Z.Y.;Hong,W.;Suo,Z.(2005):Nonlinear analyses of wrinkles in a film bonded to a compliant substrate.Journal of the Mechanics and Physics of Solids,vol.53,no.9,pp.2101-2118.
Huh,D.;Torisawa,Y.S.;Hamilton,G.A.;Kim,H.J.;Ingber,D.E.(2012):Microengineered physiological biomimicry:Organs-on-Chips.Lab on a Chip,vol.12,no.12,pp.2156-2164.
Ingber,D.E.(1997):Tensegrity:The architectural basis of cellular mechanotransduction.Annual Review of Physiology,vol.59,pp.575-599.
Ingber,D.E.(2003):Tensegrity I.Cell structure and hierarchical systems biology.Journal of Cell Science,vol.116,no.7,pp.1157-1173.
Ingber,D.E.(2006):Cellular mechanotransduction:putting all the pieces together again.The FASEB Journal,vol.20,pp.811-827.
Ingber,D.E.(2008):Tensegrity and Mechanotransduction.Journal of Bodywork and Movement Therapies,vol.12,pp.198-200.
Jiang,X.;Takayama,S.;Qian,X.;Ostuni,E.;Wu,H.;Bowden,N.;LeDuc,P.;Ingber,D.E.;Whitesides,G.M.(2002):Controlling mammalian cell spreading and cytoskeletal arrangement with conveniently fabricated continuous wavy features on poly(dimethylsiloxane).Langmuir,vol.18,no.8,pp.3273-3280.
Kawashima,T.;Kimura,T.;Shibata,T.;Kishida,A.;Mineta,T.;Makino,E.(2010):Feasibility study on cellular network analysis with patterned cell culture microdevice.Microelectronic Engineering,vol.87,no.5-8,pp.704-707.
Khare,K.;Zhou,J.H.;Yang,S.(2009):Tunable Open-Channel Microfluidics on Soft Poly(dimethylsiloxane)(PDMS)Substrates with Sinusoidal Grooves.Langmuir,vol.25,no.21,pp.12794-12799.
Lam,M.T.;Clem,W.C.;Takayama,S.(2008):Reversible on-demand cell alignment using reconfigurable microtopography.Biomaterials,vol.29,no.11,pp.1705-1712.
Li,Y.;Feng,X.;Cao,Y.;Gao,H.(2010):A Monte Carlo form- finding method for large scale regular and irregular tensegrity structures.International Journal of Solids and Structures,vol.47,pp.1888-1898.
Lim,C.T.;Zhou,E.H.;Quek,S.T.(2006):Mechanical models for living cells-a review.Journal of Biomechanics,vol.39,pp.195-216.
Lin,P.;Yang,S.(2007):Spontaneous formation of one-dimensional ripples in transit to highly ordered two-dimensional herringbone structures through sequential and unequal biaxial mechanical stretching.Appl.Phys.Lett.,vol.90,no.24,pp.241903.
Lo,C.M.;Wang,H.B.;Dembo,M.;Wang,Y.(2000):Cell movement is guided by the rigidity of the substrate.Biophysical Journal,vol.79,pp.144-152.
Luo,Y.;Xu,X.;Lele,T.;Kumar,S.;Ingber,D.E.(2008):A multi-modular tensegrity model of an actin stress fiber.Journal of Biomechanics,vol.41,issue.11,pp.2379-2387.
Maurin,B.;Canadas,P.;Baudriller,H.;Montcourrier,P.;Bettache,N.(2008):Mechanical model of cytoskeleton structuration during cell adhesion and spreading.Journal of Biomechanics,vol.41,pp.2036-2041.
McGarry,J.G.;Prendergast,P.J.(2004):A three-dimensional finite element model of an adherent eukaryotic cell.European Cells and Materials,vol.7,pp.27-34.
Nielsen,D.H.(1984):Fundamental Cardiovascular and Pulmonary Physiologyan Integrated Approach for Medicine-Green,Jf.Physical Therapy,vol.64,no.1,pp.126-126.
Noria,S.;Xu,F.;MccCue,S.;Jones,M.;Gotlieb,A.I.;Langille,B.L.(2004):Assembly and reorientation of stress fibers drives morphological changes to endothelial cells exposed to shear stress.Am J Pathol,vol.164,pp.1211-1223.
Pourati,J.;Maniotis,A.;Spiegel,D.;Schaffer,J.L.;Butler,J.P.;Fredberg,J.J.;Ingber,D.E.;Stamenovic,D.;Wang,N.(1998):Is cytoskeletal tension a major determinant of cell deformability in adherent endothelial cells?American Journal of Physiology-Cell Physiology,vol.274,no.C1283–C1289.
Rosenblatt,N.;Hu,S.;Chen,J.;Wang,N.;Stamenovic,D.(2004):Distending stress of the cytoskeleton is a key determinant of cell rheological behavior.Biochem Biophys Res Commun,vol.321,pp.617–622.
Roy,S.;Qi,H.J.(2008):Micromechanical model for elasticity of the cell cytoskeleton.Physical Review E.,vol.77,(6 Pt 1):061916.
Salber,J.;Grater,S.;Harwardt,M.;Hofmann,M.;Klee,D.;Dujic,J.;Huang,J.H.;Ding,J.D.;Kippenberger,S.;Bernd,A.;Groll,J.;Spatz,J.P.;Moller,M.(2007):In fl uence of different ECM mimetic peptide sequences embedded in a nonfouling environment on the speci fic adhesion of human-skin keratinocytes and fibroblasts on deformable substrates.Small,vol.3,no.6,pp.1023-1031.
Sander,E.A.;Stylianopoulos,T.;Tranquillo,R.T.;Barocas,V.H.(2009):Image-based multiscale modeling predicts tissue-level and network-level fiber reorganization in stretched cell-compacted collagen gels.PNAS,vol.106,no.42,pp.17675-17680.
Satcher,R.L.Jr.;Dewey,C.F.Jr.(1996):Theoretical estimates of mechanical properties of the endothelial cell cytoskeleton.Biophysics Journal,vol.71,no.1,pp.109-118.
Schmid-Schonbein,G.W.;Sung,K.L.;Tozeren,H.;Skalak,R.;Chien,S.(1981):Passive mechanical properties of human leukocytes.Biophysical Journal,vol.36,no.1,pp.243-256.
Stafford,C.M.;Harrison,C.;Beers,K.L.;Karim,A.;Amis,E.J.;VanLandingham,M.R.;Kim,H.;Volksen,W.;Miller,R.D.;Simonyi,E.E.(2004):A buckling-based metrology for measuring the elastic moduli of polymeric thin films.Nature Materials,vol.3,pp.545-550.
Stamenovic,D.(2012):Cytoskeletal prestress as a determinant of deformability and rheology of adherent cells.Cell and Tissue Engineering,pp.92-118.
Stamenovic,D.;Fredberg,J.J.;Wang,N.;Butler,J.P.;Ingber,D.E.(1996):A microstructural approach to cytoskeletal mechanics based on tensegrity.Journal of Theoretical Biology,vol.181,issue.2,pp.125-136.
Stamenovic,D.;Ingber D.E.(2002):Models of cytoskeletal mechanics of adherent cells.Biomechanics and Modeling in Mechanobiology,vol.1,issue.1,pp.95-108.
Stamenovic,D.;Ingber,D.E.(2009):Tensegrity-guided self assembly:from molecules to living cells.The Royal Society of Chemistry,vol.5,pp.1137-1145.
Su,W.T.;Liao,Y.F.;Chu,I.M.(2007):Observation of fibroblast motility on a micro-grooved hydrophobic elastomer substrate with different geometric characteristics.Micron,vol.38,no.3,pp.278-285.
Sultan,C.;Stamenovic,D.;Ingber,D.E.(2004):A computational tensegrity model predicts dynamic rheological behaviors in living cells.Annals of Biomedical Engineering,vol.32,no.4,pp.520-530.
Swanson,J.A.;Lee,M.;Knapp,P.E.(1991):Cellular dimensions affecting the nucleocytoplasmic volume ratio.The Journal of Cell Biology,vol.115,no.4,pp.941-948.
Theret,D.P.;Levesque,M.J.;Sato,M.;Nerem,R.M.;Wheeler,L.T.(1988):The application of homogeneous half-space model in the analysis of endothelial cell micropipette measurements.Journal of Biomechanical Engineering,vol.110,no.3,pp.190-199.
Tsai,M.A.;Frank,R.S.;Waugh,R.E.(1993):Passive mechanical behavior of human neutrophils:power-law fl uid.Biophysical Journal,vol.65,no.5,pp.2078-2088.
Verkhovsky,A.B.;Chaga,O.Y.;Schaub,S.,;Svitkina,T.M.;Meister,J.J.;Borisy G.G.(2003):Orientational Order of the Lamellipodial Actin Network as Demonstrated in Living Cells.Molecular Biology of the Cell,vol.14,pp.4667-4675.
Vernerey,F.J.;Farsad,M.(2011):A constrained mixture approach to mechanosensing and force generation in contractile cells.Journal of the mechanical behavior of biomedical materials,vol.4,no.8,pp.1683-1699.
Wang,J.H.C.(2000):Substrate deformation determines actin cytoskeleton reorganization:a mathematical modeling and experimental study.Journal of Theoretical Biology,vol.202,no.1,pp.33-41.
Wang,N.;Naruse,K.;Stamenovic,D.;Fredberg,J.J.;Mijailovich,S.M.;Tolic-Norrelykke,I.M.;Polte,T.;Mannix,R.;Ingber,D.E.(2001):Mechanical behavior in living cells consistent with the tensegrity model.PNAS,vol.98,no.14,pp.7765-7770.
Wendling,S.;Canadas,P.;Oddou,C.;Meunier,A.(2002):Interrelations between elastic energy and strain in a tensegrity model:Contribution to the Analysis of the Mechanical Response in Living Cells.Computer Methods in Biomechanics and Biomedical Engineering,vol.5,no.1,pp.1-6.
Yeung,A.;Evans,E.(1989):Cortical shell-liquid core model for passive flow of liquid-like spherical cells into micropipets.Biophysical Journal,vol.56,no.1,pp.139-149.
Zeng,X.;Li,S.(2012):A three dimensional soft matter cell model for mechanotransduction.Soft Matter,vol.8,no.21,pp.5765-5776.
Zhelev,D.V.;Alterai fi,A.M.;Chondniewicz,D.(2004):Controlled pseudopod extension of human neutrophils stimulated with different chemoattractants.Biophysical Journal,vol.87,pp.688-695.
杂志排行

Computer Modeling In Engineering&Sciences的其它文章
- Patient-Specific Modeling in Urogynecology:A Meshfree Approach
- Multiscale Modeling of Collagen Fibril in Bone at Various Crosslink Densities:An Insight into Its Deformation Mechanisms
- Geometrical Modeling of Cell Division and Cell Remodeling Based on Voronoi Tessellation Method
- Design Evaluation of a Particle Bombardment System Used to Deliver Substances into Cells