Land Use Conflict Changes and Driving Forces of Beibu Gulf Economic Zone
2014-04-10KaichengXIANGYonghuiFENGHuayunWANGXingfeiLIANG
Kaicheng XIANG,Yonghui FENG,Huayun WANG,Xingfei LIANG
Guangxi University of Finance and Economics,Nanning 530003,China
1 Introduction
In the sociology,a conflict is incompatibility or disharmony between two ormore social groups in targets.Land is material base of human development[1].Bringing the concept of conflict to the land use,we can have the"land use conflict".There is still no unified concept of land use conflict.Campbell stated that land use conflict is the competition of various land use types for scarce water and land resources[2].Yu Bohuaetaldefined land use conflict as the state of disharmony between parties at interest in the use of land resources or the state of contraction between various land use types and environment[3].We agree with the second opinion.Land use conflict is determined by land scarcity and multi-suitability.With deepening of land use,such conflict state is receiving more and more attention.At present,most researches about land use conflicts focus on qualitative researches,mainly in connotation,types,and diagnosis of land use conflicts[4-8].
The Pressure-State-Response(PSR)model was introduced firstly by the Organization of Economic Cooperation and Development(OECD)to evaluate world environment and is widely applied in evaluating complex environment issues and resource safety problems[9].In recent years,it has been well applied in environment issues, resource utilization, and farmland pressure evaluation.Therefore,based on PSR mode,using the entropy method,we made diagnosis analysis on land use conflicts of Beibu Gulf Economic Zone,to provide reference for land use management of Beibu Gulf Economic Zone.
2 Data and methods
2.1 Overview of the study areaBeibu Gulf Economic Zone is situated along the southwestern waters of the South China Sea.The designated mainland geographic area encompasses the cities and administrative areas of Nanning, Beihai, Qinzhou and Fangchenggang,as well as the transportation and logistically important cities of Yulin and Chongzuo.By 2009,the total population of Beibu Gulf Economic Zone reached 20.6194 million.The Beibu Gulf Economic Zone has location advantage.Situated in the connection of Sino-ASEAN economic circle,Pan-Beibu Gulf Economic Belt,and Six Southwestern Provincial Economic Circle,the Beibu Gulf Economic Zone is the most convenient sea gate of China in southwest.In January 2008,China officially approved Development Plan for the Beibu Gulf Economic Zone,bringing the development of the Beibu Gulf Economic Zone to national strategy and becoming the engine of western economic development.
The North Bay Economic has1 629 km coastline and rich and high quality deep water resources.It is a major fishing ground of China and a treasure house of world marine organisms.It has rich mineral and tourism resources,bauxite,manganese ore and indium reserves rank first in the whole country.There are many scenic spots,such as Yintan and Qingxiushan.The North Bay Economic has established integrated sea,land and air traffic network system,and be comes a bridgehead of southwest opening to the world.The economic zone realized rapid trade development.It has Dongxing,Pingxiang,Youyiguan,and Shuikou state level land border ports.The cooperation with Pan-Beibu Gulf Economic Zone is constantly deepening.The construction of Nanning-Singapore economic corridor is accelerating.Dongxing State Key Open and Development Experimental Zone enters the comprehensive construction stage.The construction of Pingxiang-Tongdeng and Dongxing-Mangjie Cross-Border Economic Cooperation Zone is accelerating and Sino-ASEAN land route is rapidly forming.
2.2 Data source and indicator selectionData in this study were selected fromStatistical Yearbook of Guangxi(2003-2011),government website of Nanning and other cities,survey on land use changes of Guangxi,and the Development Plan for the Beibu Gulf Economic Zone.For data the Beibu Gulf Economic Zone does not have,we summed up data of all cities in the zone with the area of each city as the weight.
The population growth and social economic development will certainly generate pressure in spatial land use structure.Under this circumstance,land will inevitably form corresponding utilization state in physical,chemical and land types.These reflect that land administrators,policy makers and land users are preventing land degradation,unreasonable land use structure,and rapid decrease of land area.Therefore,according to data availability,we selected 20 indicators about economy and environment,as listed in Table 1.

Table 1 Evaluation indicator system for intensity of land use conflicts in the Beibu Gulf Economic Zone
2.3 Determination of indicator weightThe indicator weight refers to relative importance degree of each indicator in the same constraint condition.There are many methods to determine the indicator weight,such as analytic hierarchy process(AHP)and expert grading method(Delphi).But these methods are subjective and easy to cause deviation.Thus,we use entropy weight coefficient method to overcome this problem.The specific process is as follows[10].
2.3.1 Standardized processing of data.Since the unit and meaning of data are different,it is necessary to take dimensionless process of original data.According to effect of evaluation indicators,we divide indicators into two types:positive indicators(the higher the better)and negative indicators(the lower the better).We use the extreme deviation method to make standardized process:

whereVijsignifies actual value of thej-th in thei-th line indicators;maxxijis the maximum value of thej-th column indicators;minXijis the minimum value of thej-th column indicators;Vijis standard value ofxijafter standardized processing.
2.3.2 Calculating weight of thej-th indicators in thei-th year:

2.3.3 Calculating the entropy of indicator information.

Takek=1/lnm,then 0≤ej≤1,when yij=0,takeyij×lnyij.
2.3.4 Calculating the redundancy of information entropy.

2.3.5 Calculating indicator weight.

2.4 Measurement of intensity of land use conflicts Due to complexity and hierarchy of evaluation system of land use conflicts,single indicator of land use conflicts can reflect development situation from a perspective.Therefore,it is necessary to analyze the overall dynamic level comprehensively.In this study,we use Regional Comprehensive Index of Land Use conflict Intensity(ILU)to represent development degree of regional land use conflicts[10],i.e.:

2.5 Extraction of driving factors of land use conflict indexThere are many factors influencing land use,including economic development,population growth,science and technology,and land use related policies.To seek driving mechanism of land use conflicts in the Beibu Gulf Economic Zone,according to charac-teristics of its social economy,we selected following indicators:total population(x1),GDP(x2),urbanization rate(x3),percentage of the secondary industry(x4),percentage of the tertiary industry(x5),grain yield(x6),investment of fixed assets(x7),disposable income of urban residents(x8),total agricultural output value(x9),forest coverage(x10),area of the construction land(x11),total output value per capita(x12),farmland area(x13),mechanization level(x14),effective irrigation rate(x15),and application of chemical fertilizer(x16).To evaluate the influence of each driving factor on land use conflicts,we used SPSS19.0 to make principle component analysis on these 16 factors.Then,we evaluated the influence of each driving factor on land use conflicts through calculating characteristic value,accumulated contribution rate and load matrix.
3 Result analysis
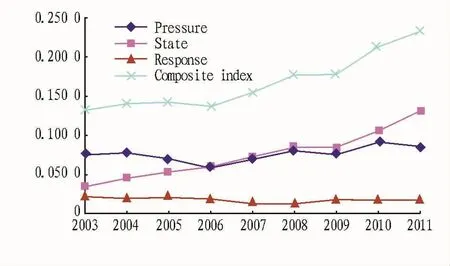
3.1 Analysis on land use conflict index of the Beibu Gulf E-conomic ZoneUsing the land use indicator system and PSR model of the Beibu Gulf Economic Zone,we calculated single conflict index of pressure,state and response of land use and the composite land use conflict index of the Beibu Gulf Economic Zone in 2003-2011(Fig.1).

Fig.1 PSR index of land use conflicts of the Beibu Gulf Economic Zone in 2003-2011
From Fig.1,we can see that changes of land use conflict index of the Beibu Gulf Economic Zone have different speed in different period,which can be generally divided into three stages:2003-2006,2006-2009,and 2009-2011.Single index indicates that the pressure index takes on growth trend with slight fluctuation.At the first stage(2003-2006),the pressure index dropped from 0.0753 to 0.0591(dropping about 21.5%in four years).At the second stage(2006-2009),the pressure index rose from 0.0591 in 2006 to 0.0785 in 2008.Then it slightly dropped to 0.0755 in 2009.But at this stage,the overall trend was growth(rising 0.0154,the growth rate up to 26%).At the third stage(2009-2011),the pressure index rose firstly from 0.075 in 2009 to 0.0847 in 2011,and then dropped slighted.The land use conflict state index takes on significant rising trend.At the first stage,the state index rose from 0.0344 in 2003 to 0.0599 in 2006(the growth rate up to 0.0255).At the second stage,it rose about0.0248.At the third stage,it rose rapidly from 0.084 in 2009 to 0.1311 in 2011(rising about 56%).The land use conflict response index has no high fluctuation and it takes on declining trend in 9 years(dropping from 0.0222 in 2003 to 0.0163 in 2011).
The rising trend of the pressure index reflects that population and social and economic development brings about constant increase in land demands and also brings greater and greater pressure to land use.Such pressure also brings changes in land use,which is manifested in rapid increase in construction land.By 2011,the construction land reached 644 900 hectare and the forest coverage rose from 42%in 2003 to 49%in 2011.Although the pressure of land use increased,the effective irrigation rate,application of chemical fertilizer per hectare and per capita share of grain took on declining trend.The effective irrigation rate dropped from 56%in 2003 to 38%;the application of chemical fertilizer per hectare dropped from 0.83 ton in 2003 to 0.76 ton in 2011;the per capita share of grain reduced about49 kg in 9 years.These reflect that the Beibu Gulf Economic Zone invested much more in the secondary and tertiary industries,but paid little attention to the agriculture.Thus,it is required to accelerate adjusting agricultural industrial structure,increase input of agricultural science and technology,raise large-scale operation of agriculture and improve the mechanization level.
Fig.1 indicates that the composite land use index rose significantly.At the first stage,the composite land use index changed slowly from 0.132 to 0.1368,growing about0.0048 in four years and the growth rate up to 3.3%.At the second stage,the composite land use index grew faster from 0.1368 to 0.1788,growing about29.9%.At the third stage,the growth of land use conflict index is fastest from 0.1778 to 0.2355,growing about 42%.These reflect worsening trend of land use conflicts in the Beibu Gulf Economic Zone and the deepening of conflicts between land use and economic construction and ecological protection.Especially after the approval ofDevelopment Plan for the North Bay Economic Zonein 2008,the Beibu Gulf Economic Zone developed rapidly and its GDP growth rate ranks the first place all the time.Rapid economic development inevitably leads to large area of farmland changing to construction land.Facing with increasingly serious land use conflicts,government should start from planning,make effort to increase intensification of land use,increase scientific and technological input,and strengthen farmland protection,to reduce land use conflicts.
3.2 Analysis on land use conflict index of all cities in the Beibu Gulf Economic ZoneUsing the land use conflict indicator system and PSR model,we calculated land use conflict index of all six cities in the Beibu Gulf Economic Zone.The calculation results are shown in Fig.2.
From Fig.2,it can be seen that the composite land use conflict index of all six cities is basically consistent with composite land use conflict index of the whole economic zone.Changes can be divided into three stages:2003-2006,2006-2009,and 2009-2011.At the first stage,there was no high fluctuation in com-posite index of all six cities.At the second stage,it started rising.At the third stage,the growth rate obviously accelerated.These are highly consistent with social and economic development of the Beibu Gulf Economic Zone.By 2011,the land use conflict index of Nanning City reached 0.2526,Fangchenggang reached 0.2147,Beihai reached 0.2137,Qinzhou reached 0.2094,Yulin reached 0.1990,and Chongzuo had the minimum value of 0.1960.Fangchenggang City has the maximum growth rate of land use conflicts(170%),followed by Qinzhou(123%)and Chongzuo(34%).Due to historical,basic and policy reasons,cities in the Beibu Gulf Economic Zone developed slowly in the past.However,with the implementation of Western Development Strategy in full scale,especially the development of the Beibu Gulf Economic Zone rising to the national development strategy,the economic development of Beibu Gulf Economic Zone enters the fast traffic lane.Accordingly,there aremany problems of the land use.

Fig.2 Composite land use conflict index of six cities in the Beibu Gulf Economic Zone in 2003-2011
4 Analysis on driving forces of land use conflicts
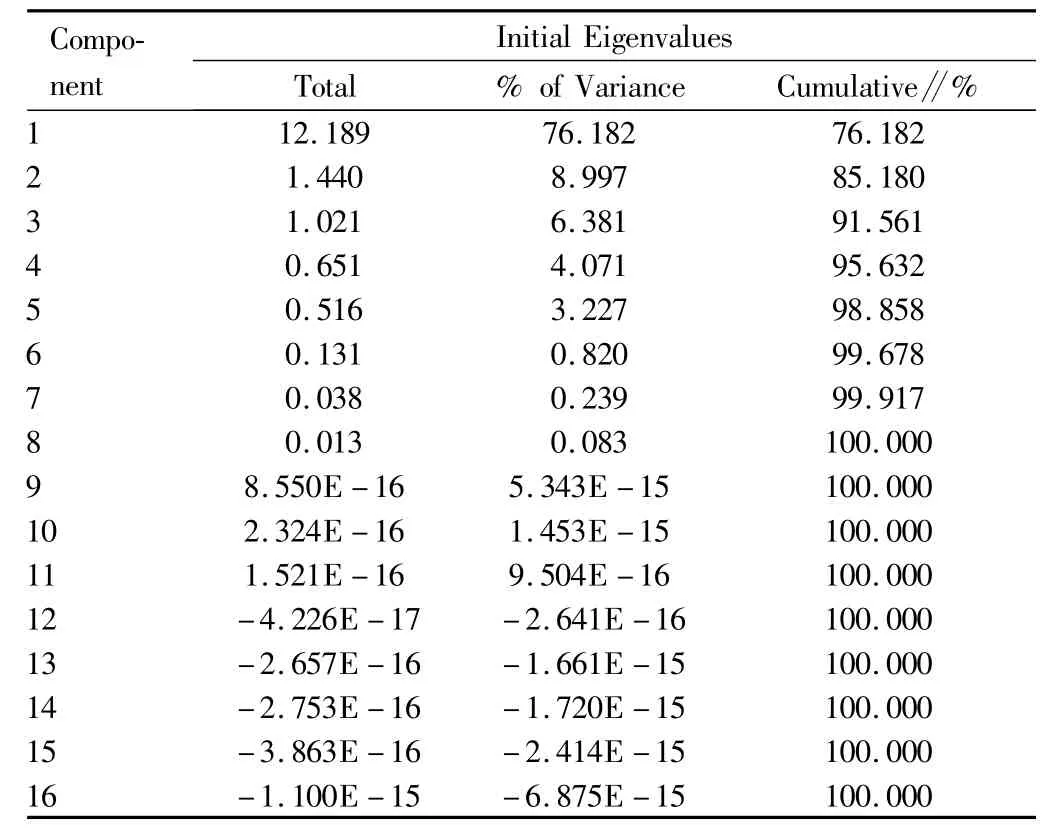
Table 2 indicates that the contribution rate of the first principal component reached 76.18%,the contribution rate of the second principal component was 8.997%,the contribution rate of third principal component was 6.381%,and the total contribution rate of three principal components reached 91.56%.Table 3 shows that the first principal component includes the population,GDP,the percentage of the secondary industry,investment of fixed assets,disposable income of urban residents,total output value of agriculture,and total production value per capita;the second principal component includes the percentage of the tertiary industry,mechanization level,and application of chemical fertilizer;the third principal component includes the urbanization rate,grain yield,forest coverage,and the percentage of the tertiary industry.Thus,driving forces of land use conflicts can be summarized as three factors:population and socio-economic development,agricultural input,and urbanization and ecological protection.The influence of these three factors on land use conflicts in the Beibu Gulf Economic Zone is up to 91.56%.
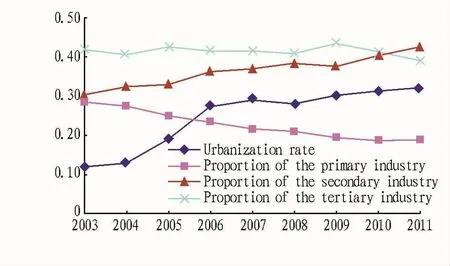
4.1 Driving factors of population and socio-economic developmentDue to historical and many other reasons,socioeconomic development of the Beibu Gulf Economic Zone lags far behind.With the comprehensive implementation of Western Development Strategy,especially the development of the Beibu Gulf Economic Zone rising to the national strategy in 2008,the socioeconomic development of the Beibu Gulf Economic Zone entered the rapid development stage and its urbanization process is constantly accelerating.In 2011,GDP of the economic zone reached 528 billion yuan,accounting for 45.1%of the whole Guangxi.The disposable income of urban residents rose from 7588 yuan in 2003 to 19087 in 2011.It has basically established an industrial system with petrochemical industry,electronic information,metallurgy,logistics,and tourism as major parts.From Table3,it can be seen that the urbanization of the Beibu Gulf Economic Zone developed rapidly in 2003-2006 and kept stable growth rate after 2006.By2011,the percentage of the primary,secondary and tertiary industry changed from 0.28:0.3:0.42 in 2003 to 0.19:0.42:0.39 in 2011,indicating that the Beibu Gulf Economic Zone remains rapid development stage of industrialization.The development of urbanization and industrialization is an essential factor for land use changes in the Beibu Gulf Economic Zone.

Table 2 Analysis on principal components of driving forces of land use conflicts in the Beibu Gulf Economic Zone
According to theDevelopment Plan for the Beibu Gulf Economic Zone,by 2020,the total production value per capita will exceed the average national level and the urbanization rate will reach 60%.It can be expected that the Beibu Gulf Economic Zone will realize further development and the conflicts between construction land,agricultural land,and ecological land will be exacerbated in space and quantity.
4.2 Driving factors of agricultural in put Increasing input and improving scientific and technological level are effective approaches to increase intensification of land use.From 2003 to 2011,the mechanized level of the Beibu Gulf Economic Zone increased from 5.79 kw/hm2to 6.21 kw/hm2,the application of chemical fertilizer dropped from 0.83 ton/hm2to 0.76 ton/hm2,effective irrigation rate dropped about32%,and power consumption of rural areas grew about 7%annually.Generally,scientific and technological input is constantly increasing in the Beibu Gulf Economic Zone.However,due to low level of agricultural economic benefits,and per unit output value,both government and farmers are unwilling to increase investment.As a result,the application of chemical fertilizer and effective irrigation rate dropped greatly,and the rural power consumption also lags be hind economic growth.Relative decrease of scientific and technological input will be unfavorable for effective land use and increase in intensification,lead to low agricultural output and high land demand,consequently bring about deterioration of land use conflicts.The Beibu Gulf Economic Zone needs increase scientific and technological input,raise land use intensification level,and improve the pressure on land use.

Table 3 Score matrix of analysis on components of driving forces of land use conflicts in the Beibu Gulf Economic Zone

Fig.3 Changes in industrial structure and urbanization rate of the Beibu Gulf Economic Zone in 2003-2011
4.3 Driving factors of urbanization and ecological protection The urbanization development at tracts more rural people to enter cities,but cities have to provide basic necessities for those people.Thus,the enlargement of urban size is inevitable.The construction land of the Beibu Gulf Economic Zone increased from 490 800 hm2in 2003 to 654 900 hm2in 2011.According to the plan,the urbanization rate of the Beibu Gulf Economic Zone will reach 60%in 2020.The Beibu Gulf Economic Zone is situated in the junction area of sea and land,so the ecological system is vulnerable and ecological restoration ability is low.To protect ecological environment,the Beibu Gulf Economic Zone have been increasing the environmental protection and energetically implemented policy of conceding the land to forestry and grass,established various ecological protection zone,and the forest coverage rose about 50%from 42%in 2003.Both the urbanization and ecological protection will lead to changes in land use structure and will change land use conflicts.
4.4 Policy driving factor of land usePolicy factor of land use exerts important influence on land use types and structure.The land use policy includes laws,policies and administrative policies and economic policies related to land use.The implementation of these policies will influence land use of government,collective,unit,and individual,and these will be reflected in land use structure and types.Since the development of the Beibu Gulf Economic Zone was lifted to the national strategy,it has formulated a series of policies,including exemption from agricultural tax,implementation of agricultural subsidy,simplification of revision of land use planning,as well as increase in reclamation input.These policies play a great role in speeding up economic development and farmland protection.The farmland area increased from 1.102 million hm2in 2003 to1.635million hm2in 2011.This greatly alleviates land use conflicts.
5 Results and discussions
(i)The pressure,state,response and composite index of the land use conflicts were increasing in 2003-2011.Their changes can be divided into three stages.At the first stage,the index change is little;at the second and third stages,the changes are significant,especially since 2009,the change of conflict index is greater.In the Beibu Gulf Economic Zone,Nanning has the highest conflict index and Fangchenggang has the greatest change in conflict index.Nanning is the capital of Guangxi Zhuang Autonomous Region and the most developed area of Guangxi and Fangchenggang ranks first in the development rate,indicating that socio-economic development is the essential drive factor of land use conflict.
(ii)From analysis,we know that factors of land use conflicts include population and economic development,agricultural input,urbanization,ecological protection,and land use policies.The population and socio-economic development has the greatest influence on changes of land use conflicts.Land use policies exert indirect influence on land use through government,collective,and individual actions.Scientific and reasonable land use policies will ultimately influence violence and alleviation of land use conflicts.
(iii)The Beibu Gulf Economic Zone remains rapid development stage of urbanization and industrialization.In future,land use conflicts will become more prominent.It is necessary to take various means to strengthen management,including scientific and reasonable land use policies,strictly control size of construction land,increase agricultural input,make effort to increase intensification level of land use,reinforce ecological environmental protection,and control land use conflicts in reasonable range,so as to realize sustainable development.
[1]ZHANG D.Organizing behavior[M].Beijing:Higher Education Press,1999:75.(in Chinese).
[2]David J.Campbell,Helen Gichohi,Albertmwangi,et al.Land use conflict in Kajiado District,Kenya[J].Land Use Policy,2000,17:337-348.
[3]YU BH,LV CH.The progress and prospect of land use conflicts[J].Progress in Geography,2006,25(3):106-115.(in Chinese).
[4]TAN SK.A research on concepts,causes and classifications of land conflicts in foreign countries[J].Chinese Agricultural Science Bulletin,2008,24(4):379-385.(in Chinese).
[5]TAN SK.Discussion on classification scheme of land conflict in China[J].Journal of China Agricultural Resources and Regional Planning,2008,29(4):27-30.(in Chinese).
[6]TAN SK.An outline of research on land conflicts and their administration in foreign academe[J].China Land Science,2007,21(4):74-80.(in Chinese).
[7]LIHB,TAN SK,YOU HY,et al.The problem of land conflict in contemporary China and the search for its source[J].Tian Fu New Idea(Bimonthly),2006(6):60-63.(in Chinese).
[8]LI ZJ,XICT.Land resource conflicts and coordination in hilly area of Southwestern China——A case study of Jiangjin district,Chongqing[J].Research of Soil and Water Conservation,2009,16(2):239-244.(in Chinese).
[9]YAOYL.Simulation and reason analysis of China’s resources security evolution trajectory based on PSR model[J].Journal of China Agricultural Resources and Regional Planning,2010,31(6):37-43.(in Chinese).
[10]YANG YF,ANQ,ZHU LQ.Diagnosis based on the PSR model of rural land-use conflicts intensity[J].Progress in Geography,2012,31(11):1552-1560.(in Chinese).
杂志排行
Asian Agricultural Research的其它文章
- Research on the Grain Producers around the Year of Chinese Population Peak
- Studies on the Development of Walnut Industry in Shangluo City Based on SWOT
- Evaluation of Grow th of Agricultural Listed Companies Based on AHP Weighting Method
- Competitiveness of China's Agricultural Product Export to the U-nited States of America
- The Curriculum System Development of Sightseeing Agriculture Major Based on Work Flow
- Analysis of Social Capital's Effect on Income of Poor Households:A Case Study in Sichuan Province
