Three-dimensional Numerical Simulation of Cryogenic Cavitating Flows of Liquid Nitrogen Around Hydrofoil
2014-03-16SUNTiezhiWEIYingjieWANGCongZHAOChenggong
SUN Tie-zhi,WEI Ying-jie,WANG Cong,ZHAO Cheng-gong
(School of Astronautics,Harbin Institute of Technology,Harbin 150001,China)
1 Introduction
Cavitation occurs in the local thermodynamic state when the fluid pressure is lower than the vapor pressure[1-2].Usually occurring in the fluid machinery such as the turbine pump,nozzle and ship propeller,cavitation can bring mechanical vibrations,noise,material erosion,and severely affect the performance of fluid machinery.The research on cavitating flow is very complicated due to the performance of turbulence,phase change,multiple timescales and interfacial dynamic etc.
There are fewer studies on the cryogenic liquid cavitating flow compared to the numerical and experimental research on fluid at normal temperature[3-6].During the past few decades,some significant efforts have been made about the cavitating flow of thermodynamic effect.As early as 1956,Stahl and Stepanoff[7]introduced a ‘B-factor’ theory to estimate the appraise head depression due to the thermodynamic effect during the cryogenic evaporation process.Sarosdy and Acosta[8]investigated the cavitation experiments of water and Freon,while the water cavities are relatively clear and well defined,the Freon cavities are always indistinct and frothy.Using liquid nitrogen and liquid hydrogen,Hord[9-11]carried out the systemic cryogenic cavitation experiments with the support of NASA.Pressure and temperature data are measured under different temperature and inlet velocities in the experiment model.The experimental data has been employed in numerical validation for thermodynamic effects in cavitating flow.Yuka et al[12]observed that the cavitation intensity of water was larger than that of the liquid nitrogen,and the restrain degree was more serious with the inlet fluid temperature increasing in cryogenic conditions.Recently,Hosangadi et al[13]used the Merkle cavitation model to simulate the cryogenic cavitating flow,and they suggested lower parameters value for cavitation model compared to their previous results.Tseng and Shyy[14]did sensitivity analysis on the transport based on cryogenic model parameters.Ma et al[15]investigated the temperature effect on the unsteady cavitating flow with liquid hydrogen around hydrofoil.
The objective of this work is to investigate the cavitating flows in liquid nitrogen around a three-dimensional hydrofoil.The aims are to(1)Study the characteristic of cavitating flows in cryogenic environment,(2)Conduct the analysis to assess the applicability of the response to the cavitation model parameters,(3)Assess the numerical method over a range of conditions.The numerical simulations are performed by implanting the cavitation model,the energy source and the thermodynamic physical properties of liquid nitrogen to the CFX code via the CFX Expression Language.
This paper is organized as follows:Section 2 presents the numerical methodology and setup.In Section 3,the cavitating flows comparisons under cryogenic and isothermal conditions are first presented,followed by the optimization model parameters and analysis of cavitation characteristic,and then a range wide of conditions are conducted with the numerical method.Finally,in Section 4 we present conclusions and some perspectives.
2 Numerical methodology
2.1 Governing equations
The continuity(mass conservation)equation:


2.2 Turbulence mode
The Shear Stress Transport(SST)turbulence model is used in this paper,which solves the transport problem of the turbulence shear force by adding the eddy viscosity limited equation to the Baseline k-ω turbulence model,and it can perform more accurate prediction for the flow separation problem under the condition of adverse pressure gradient,the Baseline turbulence model is:
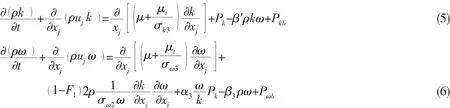
The eddy viscosity limited equation is added to the SST turbulence model:

where Pkbis the turbulent kinetic energy generation formula caused by the buoyancy;Pkis the turbulent kinetic energy generation formula caused by the viscosity force;α1=5/9 is a constant;F1and F2are the mixture function;S is the invariant measure under the strain rate.
2.3 Cavitation model
A representative transport-equation based Kubota cavitation model is shown below,which has strong applicability for estimating the volume change transformation during the growth and development process of the cavitation,the equation is expressed as:
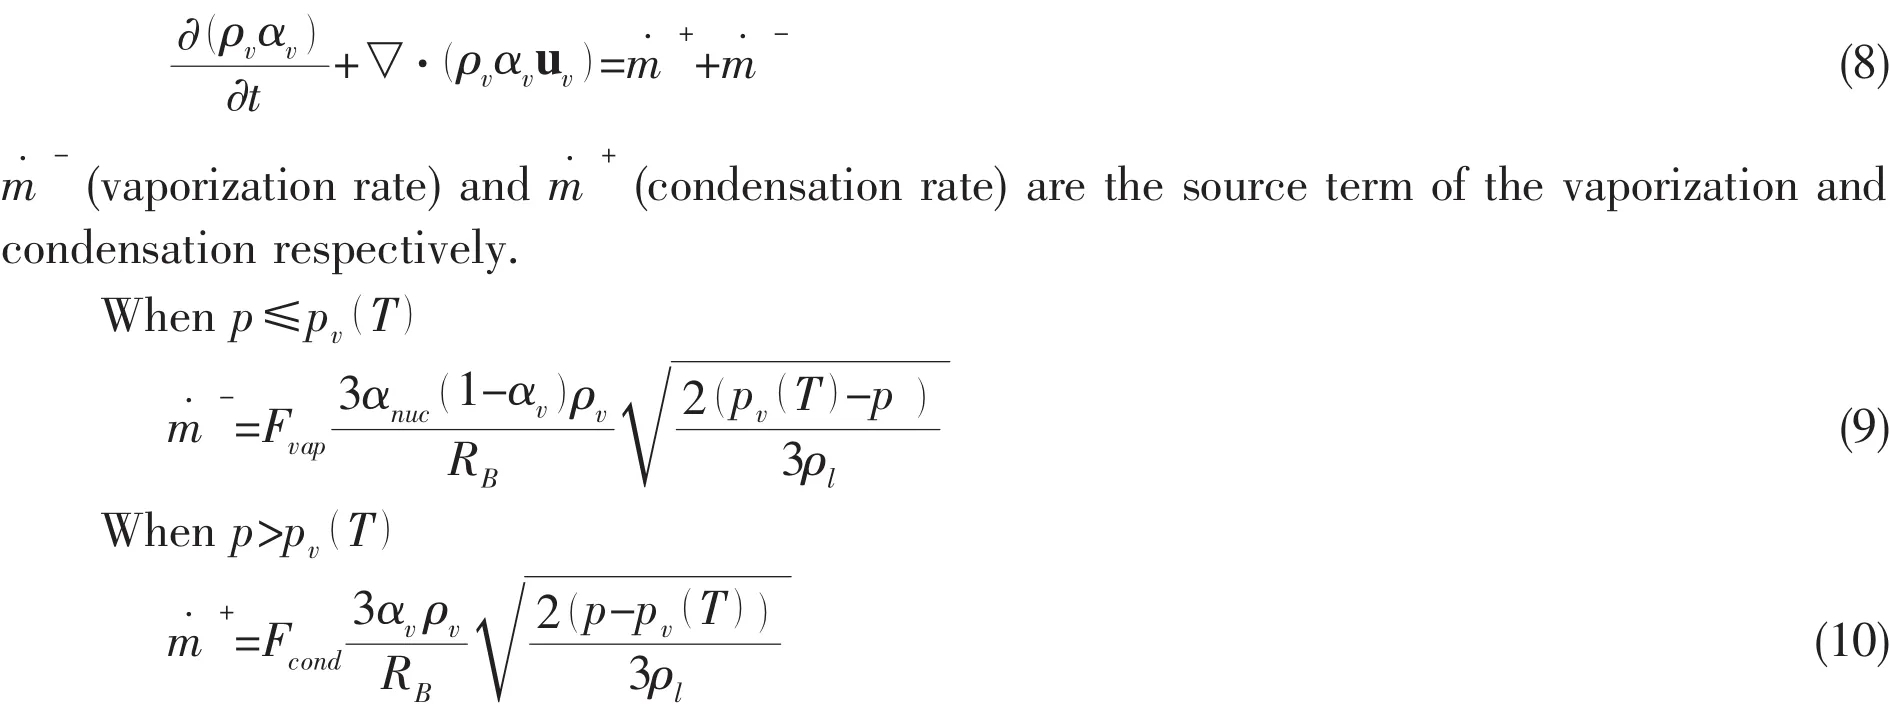
where default parameters RB=1 μm, αnuc=5e-4,Fvap=50,Fcond=0.01.The default Fvapand Fcondare based on the assumption of isothermal liquid.
Turbulence has significant effect on cavitating flow by many experiments investigations[16-17].Ref.[18]accounted the effects of turbulent fluctuations,which is expressed as:

then the saturation pressure is:

where k is the turbulence kinetic energy,pturbis the turbulence pressure fluctuation.
2.4 Computational model and mesh
The numerical cases are consistent with the experimental measurements of hydrofoil in cryogenic cavitating flow which are investigated by Hord[10].The experimental geometry was mounted in a steady flow of cryogenic tunnel,the numerical domain length is 135 mm,both the width and the height of the pipeline are 12.7 mm,the length of the hydrofoil is 63.5 mm,leading edge radius is 3.96 mm.Five pressure monitor points and five temperature monitor points were tested during the experimental process.The data monitor points P1~P5and T1~T5are shown in Fig.1.
Fig.2 shows the grids of the computational domain and the hydrofoil,the H-type and C-type grids are used in the simulation model,the grids size in the leading edge regions and near the hydrofoil are diminutive.

Fig.1 The tunnel geometry and hydrofoil

Fig.2 Grids of computational domain and hydrofoil
The boundary conditions set in this simulations include inlet,outlet and wall.The velocity is fixed at the domain inlet and the pressure opening is imposed at the outlet.An adiabatic wall boundary condition is used at the hydrofoil and the upper,lower,left and right walls.
3 Results and discussion
3.1 Thermodynamic effect on cavitating flows
For the fluids such as water,the thermal effect can be neglected due to large density ratio between liquid and vapor.Whereas for the cryogenic fluids,the density ratio are not very high,and the saturation pressure demonstrates a much steeper slope v/s temperature,such as the nitrogen is expected to show great sensitivity to temperature changes.The other physical properties such as thermal conductivity and latent heat also can influence the thermal field more substantially than water.Representative values and curves of the physical properties are shown in Fig.3 and Fig.4.

Fig.3 Density ratio(liquid/vapor)of nitrogen and water[19]

Fig.4 Saturation pressure of nitrogen and water[19]
Based on the analysis above,the thermal effect should be taken into account during the cavitation process.To investigate the thermal effect on cavitating flow of liquid nitrogen,the 290C case from the experimental data reported by Hord is simulated under isothermal condition and cryogenic condition randomly.The original Kubota cavitation model are used in both simulations.The simulation conditions are as follows:T∞=83.06 K,σ∞=1.7 and Re=9.1×10⁶.
Fig.5(a)shows the 3D cavity shape around the hydrofoil.It is clear that the cavity length under cryogenic condition is shorter than that under isothermal condition.Fig.5(b)shows the vapor volume fraction on the midplane.It can be seen that the vapor volume fraction along the hydrofoil surface under cryogenic condition is lower than that under isothermal condition.It is obvious that the thermal field has significant effect on the cavity structures.This can be explained that the thermal effect causes the temperature drop inside the cavity as shown in Fig.5(c),which results in the decrease of local vapor pressure and increase of the local cavitation number.Therefore,weaker cavitation intensity and lower vapor volume fraction in the cavity are expected as shown in Fig.5(b).The pressure distribution inside the cavity is shown in Fig.5(d).For cryogenic case in the cavitation region,the pressure profile is steeper rather than keep the constant value of saturation pressure at the isothermal condition.
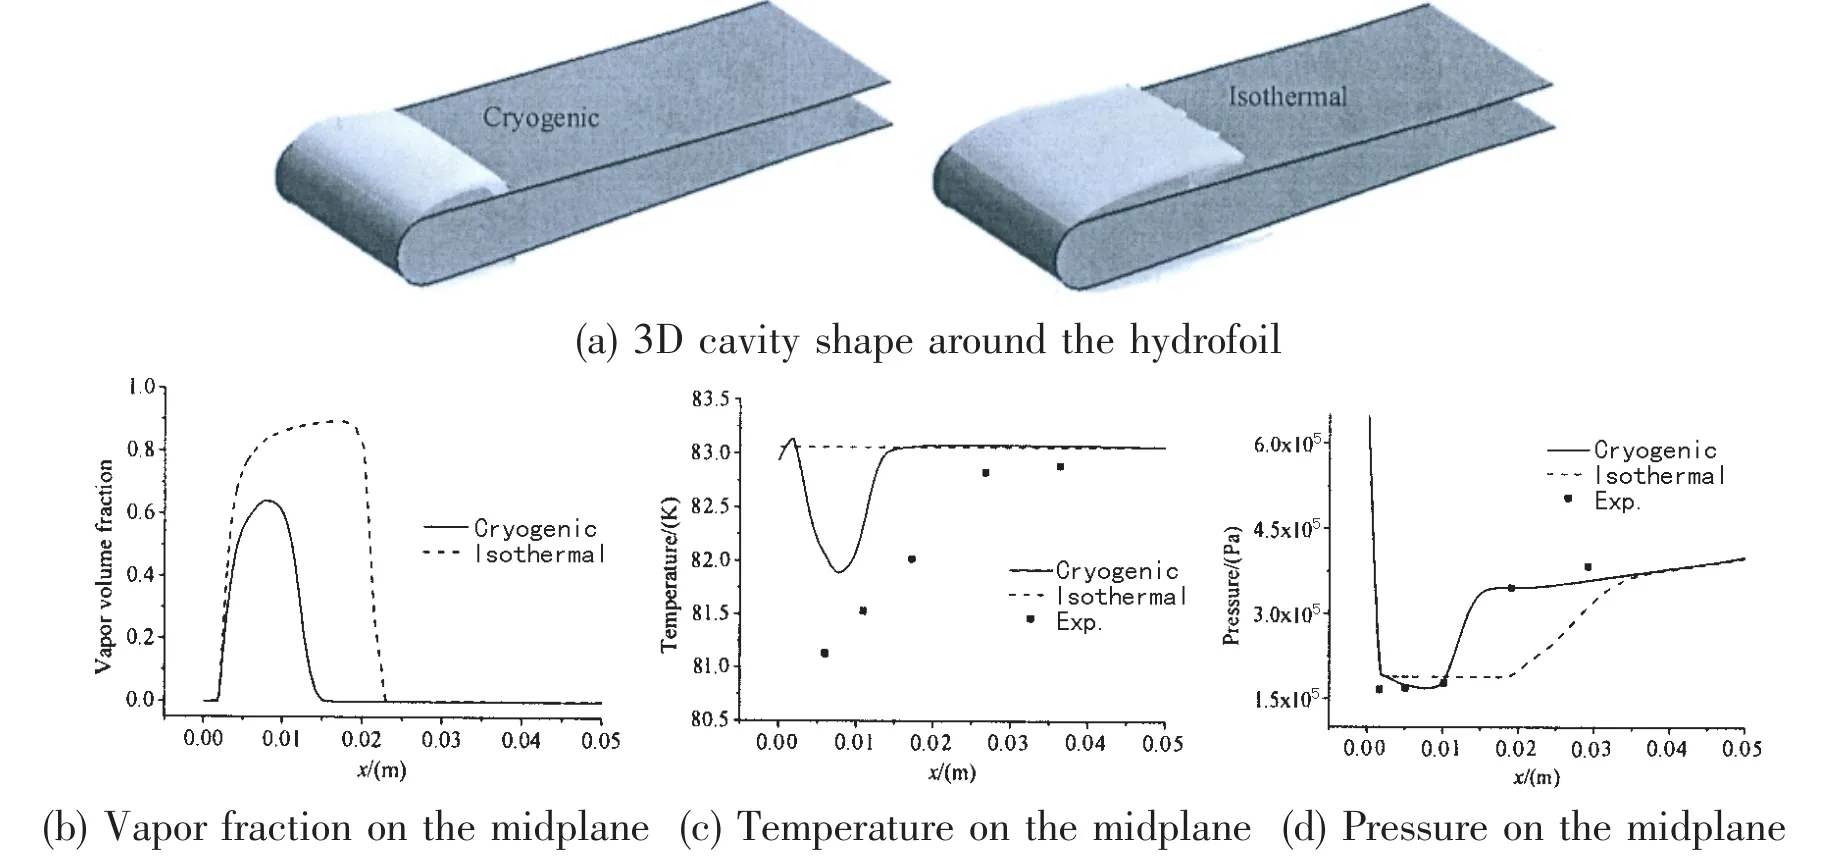
Fig.5 Comparison for case 290C under the isothermal and cryogenic conditions
According to the numerical results above,the pressure profile and temperature drops show better agreement with the experimental data under the cryogenic conditions than the isothermal case.However,the numerical results of temperature along the hydrofoil surface still have obvious departure from the experimental data.Goel et al[20]demonstrated that the cavitation model parameters such as the evaporation coefficient and condensation coefficient significantly impact on prediction,more detail analysis of the model parameters which consider the latent heat of evaporation under cryogenic condition will be discussed later.
3.2 Effect of cavitation model parameters
Fig.6 shows the three-dimensional cavity shape around the hydrofoil and the two-dimensional volume fraction distribution on the midplane.It clearly shows that the three dimensional cavity length grows longer with the increasing of Fvap,and there is no significant difference with the Fcondwhen Fvapis fixed.The two-dimensional volume fraction shows that the interface of the liquid-vapor is not clear,as well as the volume fraction distribution inside of the cavity is not uniform.
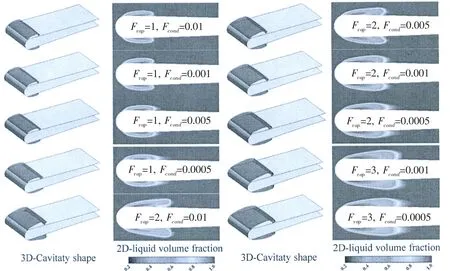
Fig.6 Cavity shape for the cryogenics case of 290C under different parameters
The numerical results of cavity length are listed in Tab.1.With the modified coefficients Fvap=3 and Fcond=0.000 5,the simulation results of the cavity length(L=23.0 mm)accord better with the experimental data(22.96 mm).
Tab.1 Cavity length under different coefficients
To further explore the characteristic inside the cavity and explain the volume fraction distribution in Fig.6.The nitrogen liquid volume fraction curves under different coefficients of Fvapand Fcondare shown in the Fig.7.It clearly shows the volume fraction is different under different vaporization coefficients.The values are almost the same at the uniform Fvapwhen the coordinate x<0.01 m.When the Fvapis fixed,the smaller the Fcondis,the lager slope of the curve is at the cavity closure region.The reason is that,when vapor nitrogen condenses into liquid nitrogen,its condensation rate becomes smaller as the condensation coefficient decreases,and the velocity of the process is also accelerated,which results in the condensation intensity decreased rapidly.
There is,in addition,one further point to make.The minimum value of the liquid nitrogen fraction volume inside the cavity is 0.27 among the numerical results,which means that the vapor is not occupied completely inside the cavity,and the high value of the volume fraction also reflects the cavity is cloudy.The experiment of liquid nitrogen investigated by Hord[11]in Fig.7 has shown that the vapor-liquid interface is not clear,and presented bubble mist.

Fig.7 The nitrogen fraction volume around the hydrofoil
Fig.8 shows the mixture density distribution in the cavitation region around the hydrofoil,and the values are range of 218 kg/m3~776 kg/m3,which are much larger than the vapor nitrogen density(6.13 kg/m3)at the temperature 83.06 K.According to the analysis of Fig.6 and Fig.7,the main reasons for the not clear vapor-liquid nitrogen interface are the high volume fraction of nitrogen and the high density inside the cavity,which results in a smaller gradient of phase change around the vapor-liquid interface.And the analysis of the cavity characteristic agrees with the guess of Hosangadi[17].

Fig.8 The mixture density distribution in the cavitation region
3.3 Assessment of the numerical method applicability over a wide range of conditions
Based on the analysis of thermal effect and model parameters above,in order to investigate the assessment of the modified cavitation model over a wide range of conditions,the simulation cases of cryogenic cavitating flow around the hydrofoil are randomly selected besides of the 290C case and simulated with the boundary conditions listed in Tab.2.The same turbu-lence model,model parameters,boundary conditions and discretization method are selected based on analysis of the effects of cavitation model.Two empirical constants are taken as the results of Fvap=3 and Fcond=0.000 5.
Tab.2 Simulation cases and boundary conditions

Fig.8 Comparison of temperature and pressure depressions to the experiment’s results
Fig.8 shows quantitative comparison of pressure and temperature depression in liquid nitrogen with the experimental results at the three cases given in Tab.2.The general trend of variations around the hydrofoil is similar to the results shown in Section 3.1.The pressure and temperature drop inside the cavity during the evaporation process,and both values show gra-dient variation along the surface.With the vapor volume fraction increasing,the pressure and the temperature depressions are larger.Take the 290C case as an example,the leading edge pressure depression is evidently relative to the free-stream vapor pressure.This indicates that the thermodynamic effect plays an important role in the cryogenic cavitating flow.Overall,better reasonable agreements are observed in Fig.8 between the predicted and measured data for the three cases.
4 Summary and conclusions
In this paper,three-dimensional cavitating flow of cryogenic liquid nitrogen around hydrofoil is investigated.Analysis of the cavitating flow characteristic and assessment of the applicability of the numerical method are carried out.The primary findings and conclusions are as follows:
(1)The thermodynamic effect during the cavitation process has significantly affected the cavitation dynamics characteristics,including the cavity structures,the vapor pressure and temperature.The cryogenic case yields a substantially shorter cavity around the hydrofoil,the predicted pressure and temperature inside the cavity are steeper than those under the isothermal conditions.
(2)The empirical values of the cavitation model parameters based on the normal temperature liquids are not applicable in cryogenic conditions.The coefficients have considerable effects on the temperature depression and pressure distribution by comparison between different model coefficients.Better prediction results are obtained with the recommended coefficients of Fvap=3 and Fcond=0.000 5.
(3)An effective computational procedure is formulated to simulate cavitating flow under cryogenic conditions.The modified cavitation model which takes into account the thermodynamic effects with the recommended coefficients is applicable for cavitating flow prediction in cryogenics fluids.
[1]Batchelor G K.An introduction to fluid dynamics[M].New York:Cambridge University Press,1968.
[2]Joseph D D.Cavitation in a flowing liquid[J].Physical Review E,1995,51(3):R1649.
[3]Callenaere M,Franc J P,Michel J,et al.The cavitation instability induced by the development of a re-entrant jet[J].Journal of Fluid Mechanics,2001,444:223-256.
[4]Saito Y,Takami R,Nakamori I,et al.Numerical analysis of unsteady behavior of cloud cavitation around a NACA0015 foil[J].Computational Mechanics,2007,40(1):85-96.
[5]Ji B,Luo X,Wu Y,et al.Numerical analysis of unsteady cavitating turbulent flow and shedding horse-shoe vortex structure around a twisted hydrofoil[J].International Journal of Multiphase Flow,2012,51:33-43.
[6]Ducoin A,Young Y L.Hydroelastic response and stability of a hydrofoil in viscous flow[J].Journal of Fluids and Structures,2013,38:40-57.
[7]Stahl H A,Stepanoff A J.Thermodynamic aspects of cavitation in centrifugal pumps[J].Trans.ASME,1956,78(8):1691-1693.
[8]Sarosdy L R,Acosta A J.Note on observations of cavitation in different fluids[J].Journal of Basic Engineering,1961,83:399-400.
[9]Hord J,Anderson L M,Hall W J.Cavitation in liquid cryogens I-venturi[R].NASA CR-2045,1972.
[10]Hord J.Cavitation in liquid cryogens II-hydrofoil[R].NASA CR-2156,1973.
[11]Hord J.Cavitation in liquid cryogens III-ogives[R].NASA CR-2242,1973.
[12]Yuka I,Naoya O,Yoshiki Y,et al.Numerical invetigation of thermodynamic effect on unsteady cavitation in cascade[C].Proceedings of the 7th International Symposium on Cavitation,2009.
[13]Hosangadi A,Ahuja V.Numerical study of cavitation in cryogenic fluids[J].Journal of Fluids Engineering,2005,127(2):267-281.
[14]Tseng C C,Shyy W.Modeling for isothermal and cryogenic cavitation[J].International Journal of Heat and Mass Transfer,2010,53(1):513-525.
[15]Ma Xiangfu,Wei Yingjie,Wang Cong,Huang Wenhu.Numerical investigation of temperature effect on unsteady cavitating flow of liquid hydrogen around hydrofoil[J].Chinese Journal of Hydrodynamics,2013,28(2):190-196.
[16]Keller A P,Rott H K.The effect of flow turbulence on cavitation inception[J].ASME Fluids Eng.Div.Publ FED,1997,4(3).
[17]Stoffel B,Schuller W.Investigations concerning the influence of pressure distribution and cavity length on the hydrodynamic cavitation intensity[J].ASME-PUBLICATIONS-FED,1995,226:51-58.
[18]Singhal A K,Athavale M M,Li H,et al.Mathematical basis and validation of the full cavitation model[J].Journal of Fluids Engineering,2002,124(3):617-624.
[19]Lemmon E W,McLinden M O,Huber M L.REFPROP:Reference fluid thermodynamic and transport properties[K].NIST Standard Database 23,version 7.0,2002.
[20]Goel T,Thakur S,Haftka R T,et al.Surrogate model-based strategy for cryogenic cavitation model validation and sensitivity evaluation[J].International Journal for Numerical Methods in Fluids,2008,58(9):969-1007.
杂志排行
船舶力学的其它文章
- Weakly Compressible Moving Particle Semi-Implicit Method(WC-MPS)with Large-Eddy Simulation(LES)Turbulence Model for Numerical Simulation of Dam-break Flows
- Application of Optical System QTM in the Towing Tank Tests for Two Ship Models
- Numerical Solution for Ship with Forward Speed Based on Transient Green Function Method
- Application of the Improved Collaborative Optimization on Ships’Conceptual Design
- Analysis of Mechanical Response for Twisted Mooring Chains
- Responses of Longitudinal and Transversal Nonlinear Coupling Vibration of Ship Shafting