Performance of a double-layer BAF using zeolite and ceramic as media under ammonium shock load condition
2014-03-06XinleiZHAOLiangZHUShijieBAIMingZHOUJingQIANWeiWU
Xin-lei ZHAO, Liang ZHU* Shi-jie BAI, Ming ZHOU Jing QIAN Wei WU
1. College of Environment, Hohai University, Nanjing 210098, P. R. China
2. State Key Laboratory of Hydrology-Water Resources and Hydraulic Engineering, Hohai University, Nanjing 210098, P. R. China
3. Key Laboratory of Integrated Regulation and Resource Development on Shallow Lakes,
Ministry of Education, Hohai University, Nanjing 210098, P. R. China
4. Yellow River Engineering Consulting Co., Ltd., Zhengzhou 450003, P. R. China
5. Wujin Water Resources Bureau, Changzhou 213172, P. R. China
Performance of a double-layer BAF using zeolite and ceramic as media under ammonium shock load condition
Xin-lei ZHAO1,3,4, Liang ZHU*1,2,3, Shi-jie BAI5, Ming ZHOU1,3, Jing QIAN1,3, Wei WU1,3
1. College of Environment, Hohai University, Nanjing 210098, P. R. China
2. State Key Laboratory of Hydrology-Water Resources and Hydraulic Engineering, Hohai University, Nanjing 210098, P. R. China
3. Key Laboratory of Integrated Regulation and Resource Development on Shallow Lakes,
Ministry of Education, Hohai University, Nanjing 210098, P. R. China
4. Yellow River Engineering Consulting Co., Ltd., Zhengzhou 450003, P. R. China
5. Wujin Water Resources Bureau, Changzhou 213172, P. R. China
An experiment was carried out to investigate the anti-ammonium shock load capacity of a biological aerated filter (BAF) composed of a double-layer bed. This bed was made up of a top layer of ceramic and a bottom layer of zeolite. The experiment shows that the anti-ammonium shock load process can be divided into two processes: adsorption and release. In the adsorption process, the total removal efficiency of ammonia nitrogen by zeolite and ceramic was 94%. In the release process, the ammonia nitrogen concentration increased significantly and then gradually returned to the normal level four hours after the shock load. The results indicated that the double-layer BAF had a high level of adaptability to the short-term ammonium shock load and long-term operation. The main factors influencing the dynamic process of ammonia nitrogen adsorption were the filter bed height, ammonia nitrogen concentration of influent, and flow rate. The bed depth service time (BDST) model was used to predict the relationship between the filter bed height and breakthrough time at different flow rates, and the results are reliable.
biological aerated filter (BAF); zeolite; ceramic; ammonia nitrogen; shock load; dynamic adsorption
1 Introduction
Biological aerated filters (BAFs) have been widely used because of their high performance, small footprint, easy management system, and high loading capability (Ma and Qiu 2002; Halle et al. 2009; Huang et al. 2011). Media used in BAFs play a significant role in wastewater treatment. The characteristics of these media not only are related to the initial investment, process design, and operation mode of BAFs, but also affect the daily running cost (Zhang et al. 2002; Han et al. 2009; Qiu et al. 2010). Zeolite has high porosity and a large specific surface area, and its strong ability to adsorb ammonia nitrogen (4NH-N+) can lead to areduction in the impact of the ammonium shock load on water quality (Tsuno et al. 1994; Lahav and Green 1998; Rozic et al. 2000; He et al. 2007). In addition, saturated zeolite can be reused for adsorption (Xu and Zhou 2003; Liu et al. 2005; Tian et al. 2002a). The removal efficiency of ammonia nitrogen affected by hydraulic loading is relatively low in a zeolite biological aerated filter at low temperatures (Tian et al. 2002b; Tao et al. 2005). Ceramic has the advantages of excellent properties of biofilm formation, low-temperature resistance, and high efficiency (Jiang and Hu 2002; Sang and Wang 2003). The combination of zeolite and ceramic has an advantage over either of the two media alone in the remediation of ammonium contaminants.
This paper describes the application of a BAF using zeolite and ceramic as media in wastewater treatment. Wastewater prepared by dilution of domestic sewage was fed into the upflow BAF. The performance of the BAF with zeolite and ceramic media under the conditions of normal and shock ammonium loads was observed. The aim of this study was to examine the ammonia nitrogen variation before and after the shock load in the reactor and to provide a reference for practical applications of double-layer BAFs.
2 Materials and methods
2.1 Wastewater characteristics
The test water was prepared by dilution of domestic sewage, to the point that it reached the water quality requirements for tail water from sewage treatment plants (secondary effluent). The characteristics of wastewater during the experimental period were as follows: the ammonia nitrogen concentration was 8.32 mg/L, the nitrate nitrogen (3NO-N−) concentration was 0.33 mg/L, and the nitrite nitrogen (2NO-N−) concentration was 0.32 mg/L.
2.2 Experimental setup
The experimental BAF was made of acrylic. The filter had a diameter of 0.12 m and a height of 2 m. The schematic diagram of the reactor is shown in Fig. 1. The reactor had an upflow configuration, and the pipes used for the influent and backwash water as well as air distribution were set at the bottom.
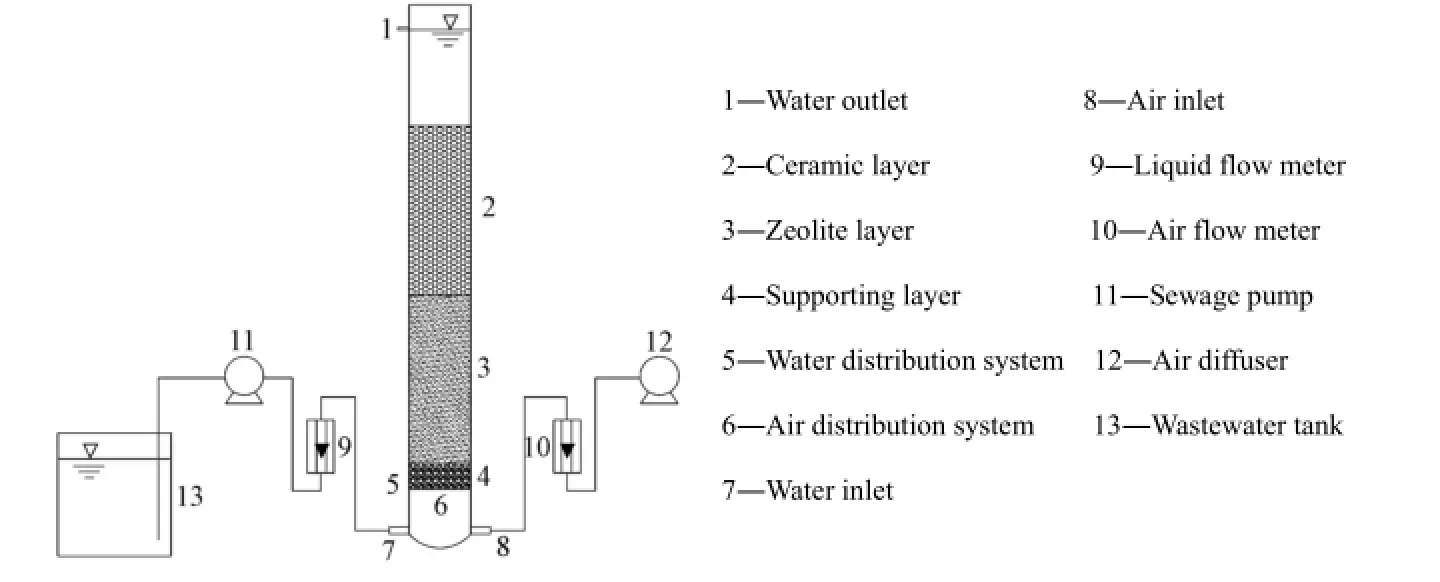
Fig. 1 Schematic diagram of BAF experimental system
2.3 Anti-ammonium shock load test
During the anti-ammonium shock load test, zeolite and ceramic were the media of the double-layer filter: the 0.7 m-high bottom layer was made of zeolite with a particle size ranging from 5 to 10 mm, and the 0.7 m-high top layer was made of ceramic with a particle size ranging from 3 to 5 mm. Along the totally 1.4 m-high filter layer, nine sampling points were set, from #0 at the bottom to #8 at the top, and the interval between adjacent sampling points was 0.175 m. Meanwhile, the water at the #0 and #8 sampling points was considered influent and effluent water, respectively. At the bottom of the reactor, a 0.1 m-high gravel layer with a particle size ranging from 2 to 3 cm was laid to support the filter media. In the upflow BAF, the air was introduced into the reactor with a micro-bubble air diffuser and the air flow rate was controlled with an air flow meter.
The anti-ammonium shock load test ran a week under the following conditions: the influent hydraulic loading was 0.7 m/h, the volume ratio of gas to water was 3:1, the chemical oxygen demand (COD) concentration was 27.97 mg/L, and the ammonia nitrogen concentration was 8.32 mg/L. The ammonium shock load was set at 50 mg/L, considering that the normal ammonia nitrogen concentration of sewage treatment plants was approximately 50 mg/L. The ammonium shock load persisted for 1.5 hours per day. The concentrations of ammonia nitrogen, nitrate nitrogen, and nitrite nitrogen under the normal condition and during the four hours after the ammonium shock load were measured, and the average values over one week were analyzed. The ammonia nitrogen, nitrate nitrogen, and nitrite nitrogen concentrations were analyzed using standard methods (SEPAC 2002).
2.4 Fitting model for dynamic adsorption test
During the dynamic adsorption test, a certain amount of zeolite was laid in the adsorption column, whose diameter was 8 cm and whose height was 30 cm. Ammonia nitrogen wastewater with a concentration of 60 mg/L was provided through the zeolite bed at a flow rate of 0.7 m/h, and the effluent ammonia nitrogen concentration was measured.
The dynamic adsorption process of ammonia nitrogen was predicted using the bed depth service time (BDST) model (Bohart and Adams 1920; Hutchins 1973; Raúl et al. 2009). The equations used in the BDST model are

where0C is the influent concentration (mg/L),tC is the effluent concentration at time t (mg/L),0N is the adsorbed amount calculated using the fitting model (mg/L),ak is the rate constant (L/(min·mg)), Z is the height of the filter layer (cm), F is the water flow velocity (cm/min), and t is the run time of the system (min).
3 Results and discussion
3.1 Analysis of anti-ammonium shock load test process
The anti-ammonium shock load test can be divided into two processes: adsorption and release. The reaction equilibrium equation is

where BZ is the processed zeolite and ceramic, and B is the exchangeable cation in the zeolite.
When the ammonium concentration in the liquid phase was higher than that in the zeolite, the ion exchange equilibrium tended to be rightward so that ammonium was removed through ion exchange. This process is called adsorption. When the ammonium concentration in the liquid phase was lower than that in the zeolite, the ammonium that was stored in the organisms was released into the liquid phase, and the adsorption capacity of zeolite was regenerated at the same time. This process is called the release process. Table 1 shows the influent and effluent ammonia nitrogen concentrations under the normal and shock load conditions and during the four hours after the ammonium shock load. Under the normal load condition, the influent ammonia nitrogen concentration was 8.32 mg/L, the effluent ammonia nitrogen concentration was 3.05 mg/L, and the ammonia nitrogen removal efficiency was 63%. The effluent ammonia nitrogen concentration remained at about 3 mg/L four hours after the shock load, so the zeolite and ceramic BAF was efficient in wastewater treatment and had a relatively strong capability to resist the shock load.

Table 1 Influent and effluent 4NH-N+ concentrations under different conditions
3.1.1 Adsorption process during anti-ammonium shock load test
The variation tendency of the ammonia nitrogen concentration under the normal and shock load conditions in the filter is shown in Fig. 2. Under the normal load condition, the ammonia nitrogen removal rate was 63%, and the ammonia nitrogen removal mainly occurred in the filter segment with a height ranging from 35 to 105 cm (the bottom of the zeolite layer was set to 0 cm), accounting for 74% of the total removal. Under the shock load condition, the influent ammonia nitrogen concentration was 58.49 mg/L and the effluent was 3.57 mg/L, so the total removal rate was 94%, and the removal mainly occurred in the zeolite segment with a height from 0 to 35 cm, accounting for 84% of the total.
The amount of ammonium adsorbed by the zeolite and ceramic layers under the shock load condition was calculated with the equation below:

whereZW is the ammonium adsorption capacity of the zeolite layer (mg),TW is the total amount of removed ammonia nitrogen (mg), andmW is the amount of ammonia nitrogen removed due to biological function (mg).

Fig. 2 Removal performance of 4NH-N+ , 3NO-N− , and 2NO-N− under different load conditions
The amount of removal of ammonium due to the action of microorganisms can be characterized by the average amount of ammonia nitrogen removed by the action of microorganisms during the total run process. The amount of ammonia nitrogen removal at each sampling point is shown in Fig. 2(a). It was calculated thatTW= 532.82 mg,mW= 20.51 mg, andZW= 512.31 mg, and the adsorption amount accounted for 96.15% of the total. The result revealed that the short-time ammonium shock load did not lead to a large population of nitrifying bacteria, and ammonia nitrogen was removed mainly by adsorption exchange of zeolite.
Fig. 2(b) shows that the concentrations of nitrate nitrogen and nitrite nitrogen changed similarly under the shock load and normal load conditions. Under the shock load condition, the increasing values of the nitrate nitrogen and nitrite nitrogen concentrations were 0.65 mg/L and 0.66 mg/L, respectively, in the 0 to 35 cm-high (#2) filter layer when the ammonia nitrogen removal concentration was 46.21 mg/L.
Under the normal ammonium load condition, the nitrate nitrogen and nitrite nitrogen concentrations increased slowly in the 0 to 35 cm-high filter layer and increased rapidly in the filter layer above a height of 35 cm, the nitrite nitrogen concentration peaked at a height of 87.5 cm (#5), and then decreased gradually, and the nitrate nitrogen concentration continued to increase. Compared with concentrations under the normal load condition, the nitrite nitrogen concentration was higher at the sampling points along the filter layer under the shock load condition, due to the increase of ammonia nitrogen concentration. The nitrate nitrogen concentration increased slightly because of the increase of the nitrite concentration.
The variation of the nitrifying capacity along the filter (Fig. 3) showed that nitrifying bacteria were active in the system. In the 0 to 35 cm-high filter layer, the organic load was higher, and the heterotrophic bacteria were the dominant strain. The activity of the autotrophicnitrobacteria was inhibited, so nitrification contributed little in the total removal of ammonia nitrogen and the nitrate nitrogen and nitrite nitrogen concentrations increased slowly. In the 35 to 140-cm filter layers, with the decrease of the organic load of the system, the number of heterotrophic bacteria decreased and nitrification increased, so the nitrate and nitrite nitrogen concentrations increased rapidly. In the 87.5 (#5) to 140 cm-high filter layer, the nitrite nitrogen concentration decreased with the ongoing nitrification.
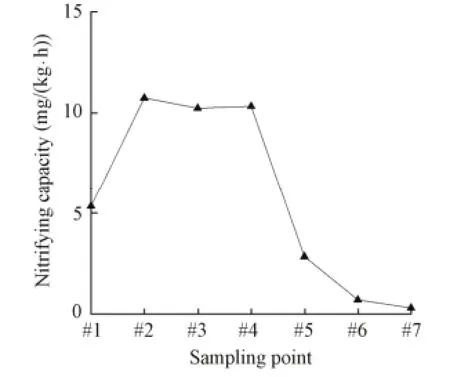
Fig. 3 Nitrifying capacity at each sampling point under normal load condition
3.1.2 Release process during anti-ammonium shock load test
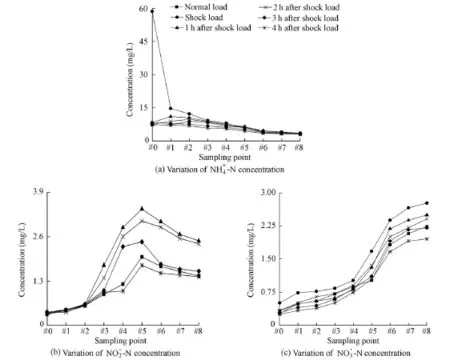
Fig. 4 Variation of 4NH-N+ , 3NO-N− , and 2NO-N− concentrations under different load conditions
After the shock load, the ammonia nitrogen concentration decreased (Fig. 4), and the ion exchange in Eq. (3) processed toward the left. The ammonia nitrogen adsorbed by zeolite wasreleased into the liquid phase, so the ammonia nitrogen concentration in the filter was higher than that in the influent. The operation scheme of the filter was upward flow, so the zeolite at the bottom was exposed to the ammonium shock load for the longest time and adsorbed the largest amount of ammonia nitrogen. With the increase of time the peak of ammonia nitrogen had an upward trend, and gradually decreased. Four hours after the shock load, the ammonia nitrogen concentration almost returned to the normal level. The ammonia nitrogen released into the liquid phase was removed by nitrification, and the zeolite was recycled.
Figs. 4(b) and 4(c) respectively show the variations of the nitrate nitrogen and nitrite nitrogen concentrations along the filter with different ammonium loads. With the decrease of the ammonia nitrogen concentration, the nitrate nitrogen concentrations increased over time, and the nitrite nitrogen concentration peaked at #5, then decreased gradually, and eventually returned to the level similar to that under the normal load conditions.
3.2 Simulation of ammonium dynamic adsorption test
The dynamic adsorption test results show that nitrogen adsorption was not good if the filter bed was not high (Fig. 5). When the filter bed height increased, the hydraulic retention time increased and the ammonia nitrogen could be more fully adsorbed, with the result that the breakthrough time of ammonia nitrogen increased. Fig. 6 shows the relationship between time and filter bed height with0tC C values of 0.18, 0.25, and 0.55. The results show that the values of all the correlation coefficients (R) of the fitting curves are more than 0.9, indicating that the BDST model is applicable to the adsorption system. The kinetic parameters of the BDST model were obtained from the slope a and intercept b of the fitting curves, and the results are shown in Table 2.
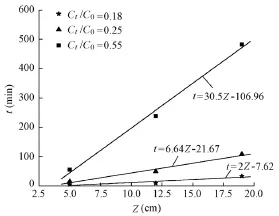
Fig. 6 Relationship between time and filter bed height with different 0tC C values

Table 2 Calculated constants of BDST model
Table 2 shows that with the increase of the CtC0value, the rate constant kadecreased and the adsorbed amount N0increased. The effluent quality of the filter under the ammonium shock load condition was predicted using the BDST model. According to the fitting curves, when CtC0= 0.25, that is, Ct=15 mg/L and t = 6.64Z−21.67, a breakthrough time of t = 94.53 min was obtained at Z = 17.5 cm. It was found that when Ct=14.73 mg/L and Z = 17.5 cm, the measured breakthrough time was t = 98 min. The prediction error is small, so the BDST model is applicable to forecasting of the breakthrough time.
4 Conclusions
(1) The anti-ammonium shock load capacity of a zeolite-ceramic BAF was studied. It was found that the anti-ammonium shock load test process can be divided into two processes: adsorption and release. The adsorption occurred when the ammonia nitrogen concentration in the liquid phase was higher than that in the zeolite and ceramic. When the influent ammonia nitrogen concentration in the experiment was 58.49 mg/L, the total removal rate was 94%, which mainly occurred in the 0 to 35-cm zeolite segment, accounting for 84% of the total. In the release process, the ammonia nitrogen concentration increased first and then decreased along the filter. Along with time, the peak of the ammonia nitrogen concentration moved from the top to the bottom of the filter and gradually decreased. Four hours after the shock load, the effluent ammonia nitrogen concentration almost returned to the normal level.
(2) Under the normal load condition when the influent ammonia nitrogen concentration was 8.32 mg/L, the nitrate nitrogen concentration was 0.33 mg/L, and the nitrite nitrogen concentration was 0.32 mg/L, the ammonia nitrogen removal rate was 63%, with a removal rate of 47% in the 35 to 105 cm-high filter layer, accounting for 74% of the total removal.
(3) Studies on the anti-ammonium shock load test show that the double-layer BAF using zeolite and ceramic as media had a strong anti-ammonium shock load capacity. The effluent ammonia nitrogen concentration was always less than 4 mg/L during the anti-ammonium shock load test process when the influent ammonia nitrogen concentration was 58.49 mg/L.
(4) Results of the dynamic adsorption test show that the higher the filter bed is, the more favorable it is for the adsorption of ammonia nitrogen. Meanwhile, the BDST model was able to reliably predict dynamic adsorption of ammonia nitrogen by zeolite.
Bohart, G., and Adams, E. N. 1920. Some aspects of the behavior of charcoal with respect to chlorine. Journal of the Franklin Institute, 189(5), 523-544. [doi:10.1021/ja01448a018]
Halle, C., Huck, P. M., Peldszus, S., Haberkamp, J., and Jekel, M. 2009. Assessing the performance of biological filtration as pretreatment to low pressure membranes for drinking water. Environmental Science and Technology, 43(10), 3878-3884. [doi:10.1021/es803615g]
Han, S. Q., Yue, Q. Y., Yue, M., Gao, B. Y., Zhao, Y. Q., and Cheng, W. J. 2009. Effect of sludge-fly ash ceramic particles (SFCP) on synthetic wastewater treatment in an A/O combined biological aerated filter. Bioresource Technology, 100(3), 1149-1155. [doi:10.1016/j.biortech.2008.08.035]
He, S. B., Xue, G., and Kong, H. N. 2007. The performance of BAF using natural zeolite as filter media underconditions of low temperature and ammonium shock load. Journal of Hazardous Materials, 143(1-2), 291-295. [doi:10.1016/j.jhazmat.2006.09.024]
Huang, G. C., Meng, F. G., Zheng, X., Wang, Y., Wang, Z. G., Liu, H. J., and Jekel, M. 2011. Biodegradation behavior of natural organic matter (NOM) in a biological aerated filter (BAF) as a pretreatment for ultrafiltration (UF) of river water. Applied Microbiology and Biotechnology, 90(5), 1795-1803. [doi: 10.1007/s00253-011-3251-1]
Hutchins, R. A. 1973. New simplified design of activated carbon system. American Journal of Chemical Engineering, 80, 133-138.
Jiang, P., and Hu, J. C. 2002. Research on the homemade light granular ceramics used in BAF. Acta Scientiae Circumstantiae, 22(4), 459-464. (in Chinese) [doi:10.3321/j.jssn:0253-2468.2002.04.009]
Lahav, O., and Green, M. 1998. Ammonium removal using ion exchange and biological regeneration. Water Research, 32(7), 2019-2028. [doi:10.1016/S0043-1354(97)00453-3]
Liu, J. X., Lou, J. S., and Chen, C. N. 2005. Zeolite biological aerated filter for treatment of micro-polluted source water. China Water and Wastewater, 21(6), 38-40. (in Chinese) [doi:10.3321/j.jssn:1000-4602. 2005.06.011]
原文:I’m pretty much totally and completely petrified.
Ma, J., and Qiu, L. P. 2002. Biological aerated filter and its research progress. Environmental Engineering, 20(3), 7-11. (in Chinese) [doi:10.3969/j.jssn.1000-8942.2002.03.001]
Qiu, L. P., Zhang, S. B., Wang, G. W., and Du, M. A. 2010. Performances and nitrification properties of biological aerated filters with zeolite, ceramic particle and carbonate media. Bioresource Technology, 101(19), 7245-7251. [doi:10.1016/j.biortech.2010.04.034]
Raúl, C. M., Marcos, S. R., Veronica, M. M., and Ruth, A. C. 2009. Removal of cadmium by natural and surfactant-modified mexican zeolitic rocks in fixed bed columns. Water, Air, and Soil Pollution, 196(1-4), 199-210. [doi:10.1007/s11270-008-9769-x]
Rozic, M., Cerjan-Stefanovic, S., Kurajica, S., Vancina, V., and Hodzic, E. 2000. Ammoniacal nitrogen removal from water by treatment with clay and zeolites. Water Research, 34(14), 3675-3681. [doi:10. 1016/S0043-1354(00)00113-5]
Sang, J. Q., and Wang, Z. S. 2003. Performance of bio-ceramic reactor at low temperature. Chinese Journal of Environmental Science, 24(2), 112-115. (in Chinese) [doi:10.3321/j.jssn:0250-3301.2003.02.022]
Tao, T. T., Zhang, Y. X., and Wang, S. 2005. Nitrogen removal of municipal wastewater by using of zeolite medium biological aerated filter. Water and Wastewater Engineering, 31(10), 36-39. (in Chinese)
Tian, W. H., Wen, X. H., and Qian, Y. 2002a. Characteristics of zeolite media biological aerated filter during start-up. Techniques and Equipment for Environmental Pollution Control, 3(12), 38-42. (in Chinese)
Tian, W. H., Wen, X. H., and Qian, Y. 2002b. Use of zeolite medium biological aerated filter for removal of COD and ammonia nitrogen. China Water and Wastewater, 18(12), 13-15. (in Chinese)
Tsuno, H., Nishimura, F., and Somiya, I. 1994. Removal of ammonium nitrogen in bio-zeolite reactor. Doboku Gakkai Rombun Hokokulshu, 5(3), 159-166.
Xu, L. H., and Zhou, Q. 2003. Use of zeolite for NH3-N removal from wastewater and its regeneration. China Water and Wastewater, 19(3), 24-26. (in Chinese) [doi:10.3321/j.jssn:1000-4602.2003.03.008]
Zhang, J., Cao, X. S., and Meng, X. Z. 2012. Progress in the study of aerated biofilter. China Water and Wastewater, 18(8), 26-29. (in Chinese) [doi:10.3321/j.jssn:1000-4602.2002.08.008]
(Edited by Yun-li YU)
——
This work was supported by the Major Science and Technology Program for Water Pollution Control and Treatment of China (Grant No. 2009ZX07317).
*Corresponding author (e-mail: zhulianghhu@163.com)
Received Nov. 11, 2012; accepted Apr. 7, 2013
猜你喜欢
——Quality Assurance Testing, Certified Reference Materials, and International Liaison Activities (英文原文)
杂志排行
Water Science and Engineering的其它文章
- Thank you to our peer reviewers
- Water issues and prospects for hydrological science in China
- Abrasion test of flexible protective materials on hydraulic structures
- Comprehensive two-dimensional river ice model based on boundary-fitted coordinate transformation method
- Prediction of chlorophyll a concentration using HJ-1 satellite imagery for Xiangxi Bay in Three Gorges Reservoir
- Water level updating model for flow calculation of river networks
