A Portable Echelle Spectrograph Design for Laser-induced Breakdown Spectroscopy
2013-12-04CHENShaojieQIXiangdongBayanheshigTANGYuguoCAOHaixia
CHEN Shao-jie,QI Xiang-dong,Bayanheshig,TANG Yu-guo,CAO Hai-xia*
(1.Changchun Institute of Optics,Fine Mechanics and Physics,Chinese Academy of Sciences,Changchun 130033,China;2.University of Chinese Academy of Sciences,Beijing 100049,China)
1 Introduction
Laser-induced breakdown spectroscopy(LIBS),also referred to as laser plasma spectroscopy(LIPS)in the technique,is a type of atomic emission spectroscopy which uses a highly energetic laser pulse as the excitation source[1-3].LIBS is technically very similar to many other laser-based analytical techniques,such as the vibrational spectroscopic technique of Raman spectroscopy,and the fluorescence spectroscopic technique oflaser-induced fluorescence(LIF),and they share much of the same hardware.In fact,these devices are now being manufactured in a single instrument,allowing the atomic,molecular and structural characterisation of a specimen as well as giving a deeper insight into physical properties[4-5].Because of the advantages of microscale materialconsumed, remote sensing,depth profile and rapid giving results,LIBS has received much attention.Nowadays,LIBS have been utilized in many industrial on-line element characterization measurements[6-7].In principle,LIBS is able to analyze any matter regardless of its physical state,such as solid,liquid or gas.When excited to sufficiently high temperatures,elements emit lights of characteristic frequencies,so LIBS can determine them[8-9].However,what LIBS can detect is limited by the power of the laser as well as the sensitivity,spectral resolution and wavelength range of the spectrograph.As the key module of LIBS,the spectrograph affects the optical performance of the entire instrument significantly,including wavelength range,spectral resolution,detection limit and the size of the configuration[1,10].Besides,recent interest in LIBS has focused on the miniaturization of the components and the development of compact,low power,portable systems.In this way,the development of miniature spectrograph with high resolution,high sensitivity,and proper spectral coverage is considered necessary.
Echelle spectrographs with internal cross-dispersion generate two-dimensional spectra on the image plane.In this spectroscopic module,the echelle grating dominates the main dispersion.The term echelle denotes a special diffraction grating with rather coarse groove spacing used at high angle of incidence with high diffraction orders(usually from 10 to 150),so echelle grating enables the spectrograph possess of preeminent resolution with miniature configuration.While,due to the limit of free spectral range,many orders are overlap.A cross-dispersing element,either a grating or a prism,is needed to separate different orders perpendicular to the echelle dispersion.The conventional Czerny-Turner spectrographs are very limited either in spectral resolution or in simultaneously detectable spectralrange,which are unable to meet the requirements of LIBS[11].Under this situation,a small size echelle spectrograph was designed.Due to the large spectral image area,it is not easy to gain excellent image quality and high resolution for the wide spectral coverage.The resolution of echelle spectrograph is affected by many factors,so it is necessary to analyze the main parameters of the optical system.This paper analyzes and discusses the influence of the pinhole diameter,grating parameters,prism parameters,CCD pixel size and system aberrations.In order to reduce the effect of aberration,a cylindrical lens is used to decrease the astigmatism which influences the resolution greatly.According to the analysis,a portable echelle spectrograph is designed,and the optical characteristics can satisfy the needs of LIBS.
2 Spectroscopic Module Design for LIBS
2.1 Principle of LIBS
The experimental set-up for LIBS is described in Fig.1.A Q-switched Nd:YAG laser is utilized with high pulse energy at extremely high rate as the excitation source.The pulse energy is regulated by a variable attenuator,and in addition,it is monitored via a beam splitter and a pulse energy monitor.The laser beam passing pierced mirror is focused on the sample surface,and the characteristic spectra are inspired.The plasma emission is collimated with the same lens,and focused by a second lens on a fiber optics coupled to an echelle spectrograph with an integrated intensified CCD camera.
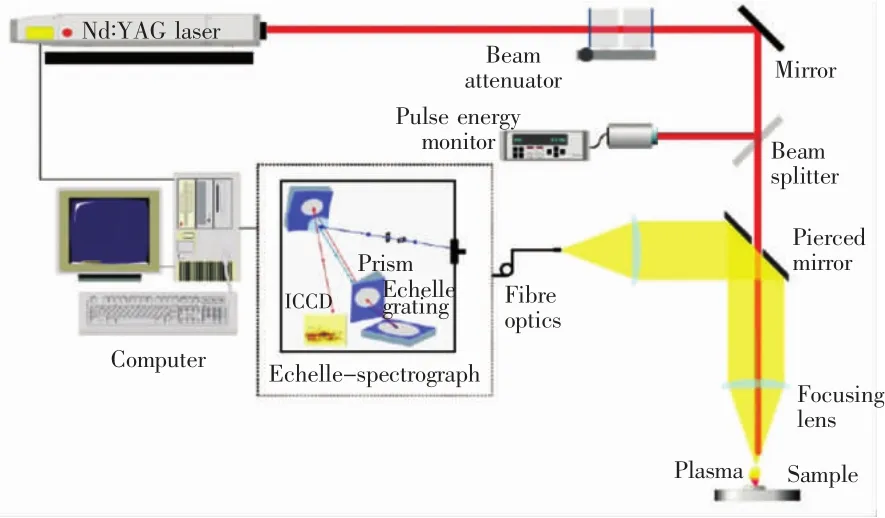
Fig.1 Set-up for LIBS
2.2 Fundamentals of Spectrograph Design
This echelle spectrograph is designed in a kind of“double-Z”layout,and all optical components are arranged one after the other in a zigzag-line[12],as showed in Fig.2.Wide spectral coverage,high resolution and small volume echelle spectrograph can be obtained by this configuration[13-14].The ray from a pinhole is collimated by sphere mirror,and then hits the echelle grating which is mounted in an offplane mode working at its blaze maximum.A disperser,a prism is used to separate the overlapping orders perpendicular to the echelle grating dispersion.The echelle graphic image corrected by a cylinder lens,is focused by another sphere mirror onto the two-dimensional detector(intensified or non-intensified CCD camera).
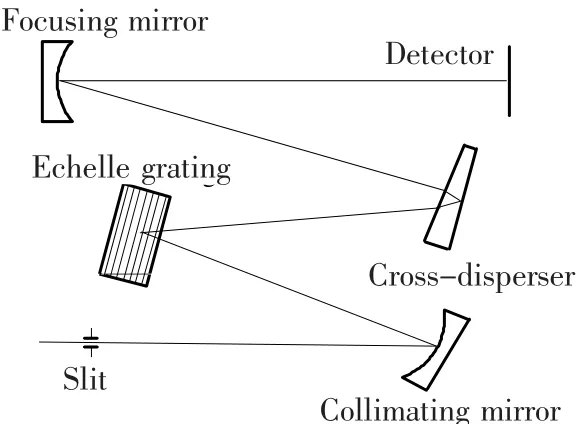
Fig.2 Scheme of echelle spectrometer
2.3 Echelle Grating and Properties
In the spectroscopic module,the echelle grating dominates the main dispersion,and the prism is a cross-disperser orthogonal to the grating[15].In the single slit diffraction,most free spectral range of the echelle grating are contained in the maximum intensity envelop,so the diffractive efficiency can get up to 50% ~100% of the peak wavelength,which means the echelle gratings possess high diffractive efficiency within a wide spectral coverage.The echelle grating is mounted in an off-plane mode working at its blaze maximum,which is shown in Fig.3.y-z plane is the main plane of the grating.There is a mall angle δ between the incidence ray and main plane,i is incidence angle,and β is diffractive angle.

Fig.3 Work mode of echelle spectrometer

Where,m is the diffraction order,K is the total number of the groves,W is the width of the echelle grating,d is the grating constant,and θ is the blazed of echelle grating.For the specific wavelength,the resolution depends on the blazed angle and the width of grating.In order to meet the demand of the application,the parameters are calculated:d=54.49 gr/mm,the blazed angle is 46°,the area of the echelle grating is 16 mm×26 mm,and the wavelength is from 180 nm to 400 nm.
2.4 Cross-Dispersion and Properties
As we know,gratings are used to produce a series of repeated spectra through diffraction.Traditional spectrographs generally use one dispersive element,either a grating or prism,which usually works in 1st or 2nd order.However,an echelle grating is specially designed to operate in high diffraction orders,which leads to serious spatial overlapping between successive orders.Therefore,a second dispersion,either a prism or low dispersion grating is needed to disperse the light in the direction orthogonal to the echelle grating,and it has no effect on the dispersion ofthe echelle grating.The spectral
In this way,one takes advantage of the full resolution power of the grating and any anamorphic effect of grating diffraction is avoided.In this configuration,the resolution of the echelle can be described as follows.range,crosstalk between orders,and the utilization ration of detector are all needed to be considered to confirm the parameters of cross-dispersion.
Adopting a prism as the cross-disperser,different material is chosen according to spectral requirements.The relationship between dispersion angle and refractive index,incidence angle,and apex angle can be gotten as follows.

Where,φλis dispersion angle,nλis refractive index,α is incidence angle,φ is apex angle.Dispersion angle varies according to wavelength,so different dispersion angles lead different locations of orders on the image plane.
In order minimize the structure and enhance the cross dispersion,the suprasil dispersion prism is aluminum-coated at the back side and acts in the reflection mode.According to the wavelength range and the limit of the detector,the quartz prism is chosen and the apex angle is 20°,the incidence angle is 21°
2.5 Pinhole and Detector
The pinhole is on the focus plan,so the diameter of the pinhole affects the system resolution seriously.Suppose the diameter of the pinhole is s,each point of the pinhole can considered as a source.In this way,the angle between incidence rays from different point sources can be obtained.
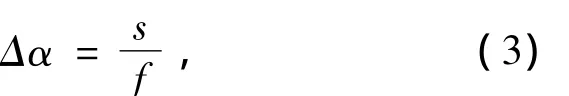
The grating equation is simplified as follows.

This system is in Littrow mode,so the incidence angle is equal to dispersive angle(i=β=θ).With respect to the differential equation,the angular dispersion of grating is listed as follows.

If Δα =di,the following relation can be gotten.
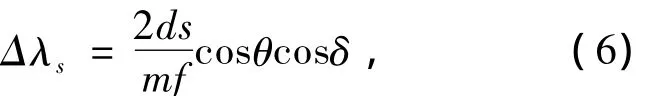
The detector is another mainly factor affecting the spectral resolution.The size of the pixel must match the pinhole.In terms of the sampling theorem,the frequency of the pixel distribution must be twice higher than the frequency of spectra distribution[16].Suppose the size of the pixel is r,the linear dispersion of grating is,so the width of the spectral line for each pixel can be deduced as follows.
Base on the above analysis,Δλsshould be larger than the two times of Δλr.

In this case,the relation between the pinhole and the detector can be obtained.

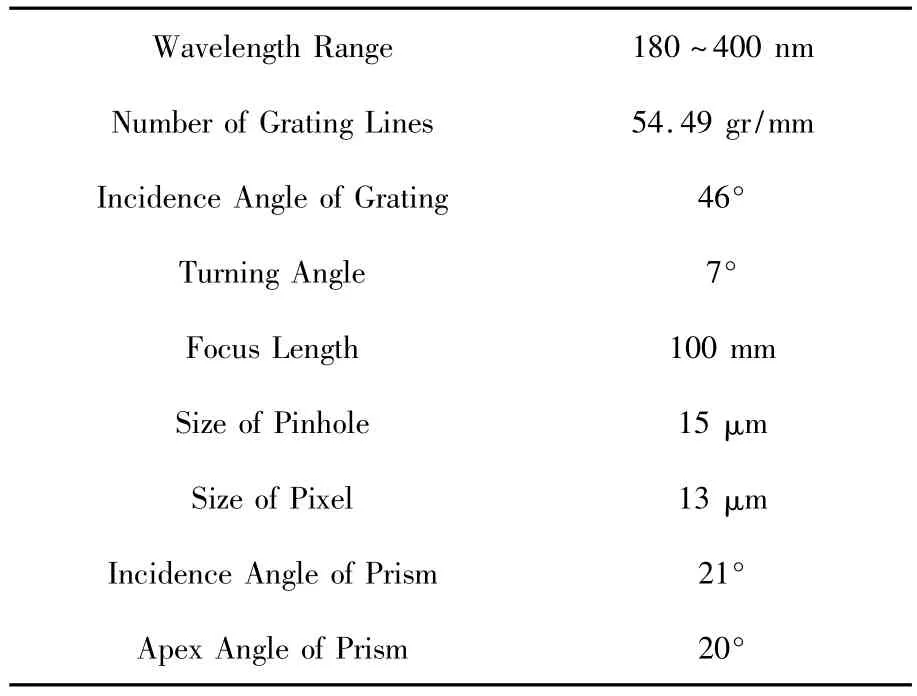
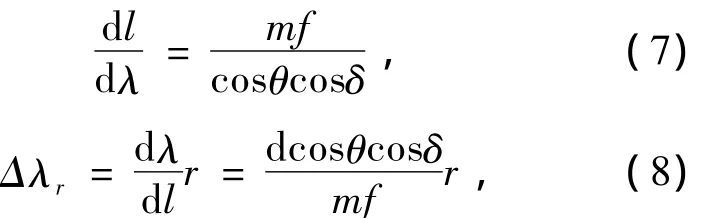
Table 1 Parameters in echelle spectrograph
3 Results and Discussion
If the echelle grating and the cross-disperser make a combination,this configuration can be simplified as a Czerny-Curner spectrometer.On the basis of Cary theorem,the aberration can be corrected by minimizing the off-axis angle of grating.This offaxis angle depends on the off-axis angles of the sphere mirrors and echelle grating.In order to meet the demand of image quality and system structure,the off-axis angles are 5°for the collimating mirror,3°for echelle grating,and-8°for the focusing mirror.The echelle grating is mounted in an off-plane mode,working at its blaze maximum,which takes advantage of the full resolution of the grating and any anamorphic effect of grating diffraction is avoided.Due to asymmetric of the system,the sagittal focal length and meridian focal length are not equal.A cylinder lens is adapted to correct the astigmatism.The optical design result is shown in Fig.4.
Fig.4 Optical design of echelle spectrograph
The optical design optimization was carried out using the optical design software ZEMAX.The precise locations and angles of all optical components are tuned in order to optimize image quality over the whole focal plane.High imaging quality could be achieved for minimum deviation angles at all optical parts.Fig.5 shows the spot diagram of a monochromatic point source.

Fig.5 Spot diagram
The practical structure is shown in Fig.6.Due to the limits of detector,the ultraviolet CCD camera is utilized to test the characteristic of portable echelle spectrograph,but intensified CCD camera was not used.
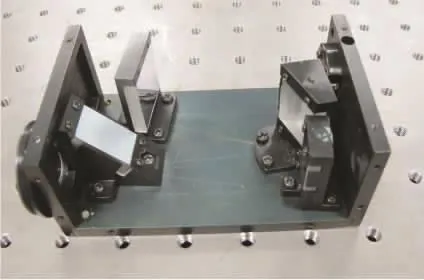
Fig.6 Practical structure of portable echelle spectrograph
The observation of the Hg lamp with different integration time is shown in Fig.7.The image point takes up 9 pixels,the half width of the spectral line is 0.0368 nm at 253.652 nm.

Fig.7 Echelle graphic of Hg lamp in different integration time.(a)Integration time is 80 s.(b)Integration time is 200 ms.
4 Conclusion
A portable echelle spectrograph is discussed and designed,and the desirable spectral resolution and image quality have been obtained.While limited by the effective area of CCD and the dispersive capacity of the prism,the system only has a good perform between 180 nm and 400 nm.Considering characteristic emission lines of most elements distribute between 180 nm and 400 nm,so echelle spectrograph allows simultaneous acquisition of the entire wavelength range of interest quickly,which can satisfy the requirments of LIBS application well.The peculiarity is that this echelle spectrograph is a stand-alone spectrograph,therefore it can be combined with different types of intensified and non-intensified CCD cameras and pinholes to adapt different applications.
Acknowledgements
The authors would like to thank Mr.Chen Jin-yong for the mechanical development,and Ning Chunli for the instrument adjustment.Financial support by the National Engineering Research Center for Diffraction Gratings Manufacturing and Application is acknowledged.
[1]Walid Tawfik Y Mohamed.Improved LIBS limit of detection of Be,Mg,Si,Mn,Fe and Cu in aluminum alloy samples using a portable Echelle spectrometer with ICCD camera[J].Optics& Laser Technology,2008,40(1):30-38.
[2]Leon J Radziemski.From LASER to LIBS,the path of technology development[J].Spectrochimica Acta Part B,2002,57(7):1109-1113.
[3]Ahmed R,Baig M.On the Optimization for enhanced dual-pulse laser-induced breakdown sectroscopy[J].IEEE Transactins on Plasma Science,2010,38(8):2052-2055.
[4]Tao M M,Yang P L,Liu W P,et al.Response characteristics of fiber Bragg gratings irradiated by high energy lasers[J].Chin.Opt.(中国光学),2012,(5):544-549.
[5]Ye J F,Hong Y J,Wang G Y,et al.Research progress in micro-laser plasma propulsion[J].Chin.Opt.(中国光学),2011,4(4):319-326(in Chinese) .
[6]Noll R,Bette H,Brysch A,et al.Laser-induced breakdown spectrometry-applications for production control and quality assurance in the steel industry[J].Spectromchimica Acta Part B,2001,56:637-649.
[7]Stankova A,Gilon N,Dutruch L,et al.A simple LIBS method for fast quantitative analysis of fly ashes[J].Fuel,2010,89(11):3468-3474.
[8]Huang Q.The Emission studies on ultraviolet laser ablation of copper in low pressure[J].Chin.J.Lumin.(发光学报),2006,27(6):1021-1025(in Chinese).
[9]Hu J,Chen G,Zen Y.Studies on laser-induced filuorimetry(IX)the luminescence mechanism and analytical application of Dy-AA-TOPO-SLS fluorescent system[J].Chin.J.Lumin.(发光学报),1991,12(1):66-72(in Chinese).
[10]Bauer H,Leis F,Niemax K.Laser induced breakdown spectrometry with an echelle spectrometer and intensified chage coupled device detection[J].Spectrochimica Acta Part B,1998,53(12):1815-1825.
[11]Haisch C,Panne U,Niessner R.Combination of an intensified charge coupled device with an echelle spectrograph for analysis of colloidal material by laser-induced plasma spectroscopy[J].Spectrochimica Acta Part B,1998,53:1657-1667.
[12]Florek S,Haisch C,Okruss M,et al.H.A new,versatile echelle spectrometer relevant to laser induced plasma applications[J].Spectrochimica Acta Part B,2001,56(6):1027-1034.
[13]Lindblom P.New compact echelle spectrographs with multichannel time-resolved recording capabilities[J].Analytica Chimica Acta,1999,380(2/3):353-361.
[14]Wu N,Tan X,Bayanheshig,Tang Y G,et al.Simulation and experiments of ion beam etching process for blazed holographic grating[J].Opt.Precision Eng.(光学 精密工程),2012,20(9):1904-1912(in Chinese).
[15]Tang Y G,He M,Cui J C,et al.Senamont based measuring method for birefringence of infrared crystal[J].Opt.Precision Eng.(光学 精密工程),2012,20(10):2176-2183(in Chinese).
[16]Tang Y,Chen H,Zhang Z,et al.Multi-Channel Spectrometer based on Linear CCD and its Application[J].Huazhong Univ.of Sci.& Tech.(华中科技大学学报),2002,30(10):96-98(in Chinese).