Study on Ecological Environment and Sustainable Land Use Based on Satellite Remote Sensing
2013-11-25JiankangZhangYanpeiChengHuaDongQingshiGuoKunLiuFawangZhang
Jiankang Zhang ,Yanpei Cheng , Hua Dong , Qingshi Guo ,Kun Liu , Fawang Zhang
1Institute of Hydrogeology and Environmental Geology, Chinese Academy of Geological Sciences, Shijiazhuang, China
2Remote Sensing Center of Hebei Province, Shijiazhuang, China
3Institute of Karst Geology, Chinese Academy of Geological Sciences, Guilin, China
ajiank_2004@126.com, byanpeicheng@tom.com ,cdonghua05003@163.com ,dguoqingshirs@263.net ,eliukun07078@163.com, ffawangzhang@sina.com
Abstract: GIS and RS techniques have been applied to interpret satellite data in 1992, 2000 and 2010.Further, the ecological environment factors of these three periods and the data for various types of land use have been obtained. LUDI in the Amur River Basin from 1992 to 2010 has been quantitatively analyzed by using the land use dynamic (LUDI) model and of land use transfer matrix model. The results indicated that from 1992 to 2010 the LUDI of land desertification is greatest, and is the most dramatic change. The comprehensive land use dynamic in the study area is 15.25, hence the land type is characterized by rapid change. In addition the area of woodland and farmland continues to increase, which has been mainly transformed from the mixture of forestland and grassland, marsh and wetland, this is an outcome of the production of shelter-forest plantation in North China, Northeast China and Northwest China. In the ten years period of the study, the area of desertified land has increased, changing mainly from a mixture of woodland and grassland. This study can rovide data for eco-geological environment management.
Keywords: GIS; RS; Amur River Basin; LUDI; transfer matrix; ecological environment
Introduction
Ecological environment changes are induced by both nature and human activities, and the land is the foundation for the human existence (Wei Suqiong and Chen Jianfei 1992). Ecological environmental changes and land use types exert extremely profound effect on the regional water circulation, The environmental quality, and regional environment sustainable development,and the Changes to the ecological environment and land use type are direct Consquence of the development of complex natural, social, economic and ecological systems (Feng Zhiming and Liu Yujie 2004) . Since the 1990s, as the competition between the population, resources and the environment increases, therefore on ecological environment and sustainable utilization of land resource research has entered a comprehensive,engineering and practical stage (FAO 1982; SGC 1991; Zheng Zhenyuan 1996; Chen Baiming 2000;Xie Junqi 1999; Li Xiubin 1999).
With the gradual development of 3S technique,remote sensing images with high spatial and temporal resolution has been widely applied to investigate land resources, particularly, land use dynamic monitoring and the research of land use change (Liu Jiyuan et al.2003; Yan Tailai and Wu Ping 2002; Zheng Shunyi and Zeng Xuegui 2000).In recent decades, with the rapid development of the economy and the change in climate, the ecological environment in Amur River Basin has been damaged to a certain extent, and even the junction of Sino-Mongolian border and Hulun Buir area appears to have suffered serious land desertification. Therefore, in this paper the remote sensing images for three periods of the Amur River Basin have been selected as data source, using land use dynamic and land use transfer matrix methods.This will enable to a quantitative study of the regional land dynamic change and analyze the factors impacting the change, thus provide data for the management of the local ecological environment.
Summary of study area
The Amur River is an international river flowing through Mongolia, China and Russia with a total length of 2,588 km. The Amur River Basin,covers an area of 1,855,000 km2, and is densely distributed with more than 10,000 tributary rivers and more than 60,000 lakes that include the Eergu'Na River as their source. The forest coverage is high and the vegetation coverage is unremarkable as shown in Fig. 1. The interpretation area of the remote sensing image is up to 2,162,000 km2as indicated in Fig. 2 with the geographic location of east longitude 121°29′-135°05′, north latitude 45°01′-53°33′. The area represents the cold temperate and temperate monsoon climate, with the average temperature of-24 ℃ approximately in January in the south and -33 ℃ in the north, 21 ℃ in July in the south and 18 ℃ in the north. The basin is mainly recharged by precipitation and secondly by snowmelt.Specifically, of all the runoff, rainwater recharge accounts for about 75%-80%, whereas snowmelt recharge accounts for about 15%-20% and groundwater recharge accounts for about 5%-8%.
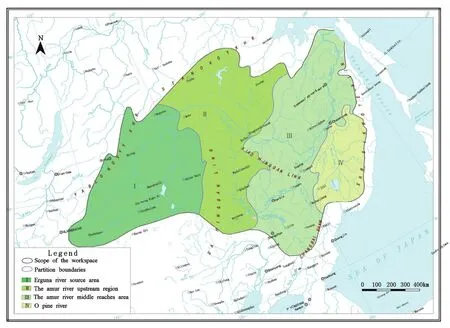
Fig.1 Map of Amur River Basin
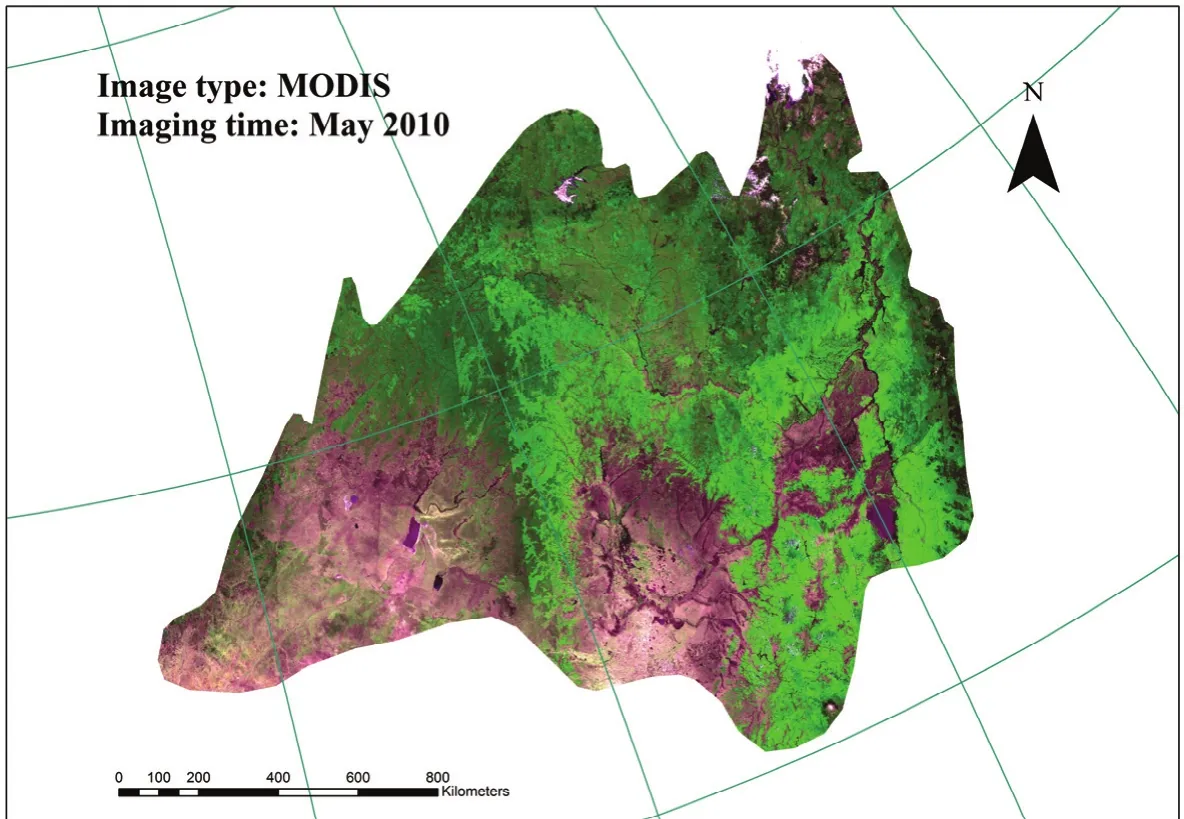
Fig.2 Primary remote sensing image of Amur River Basin in 2010
Satellite data and processing
The image data in obtained in 1992 and 2000 has been applied, to the original image obtained from the NOAA satellite images with a resolution of 1 km× 1 km. The image in 2010 is a synthetic image of MODIS for 8 days in May with resolution of 1km× 1km. MODIS is the moderate resolution imaging spectrometer installed on the Satellite Aqua and Terra of Earth Observing System (EOS) of United States NASA. It has 36 channels within 0.4-1
4.4μm spectrum range, and the data format is HDF.
The image data has been interpreted by using a supervised classification method, which mainly includes atmospheric correction, geometric correction, clipping, masking and false color synthesis of remote sensing images. T he study area has been classified into swamps and wetland,desertified land, woodland, grassland, farmland and mixture of woodland and grassland, based on field investigations and reviews of previous maps and text data,. The projection type for the image classification map is Geographic, and the geographic coordinate system is WGS-84. Fig. 3 shows the interpretation data in 2010.
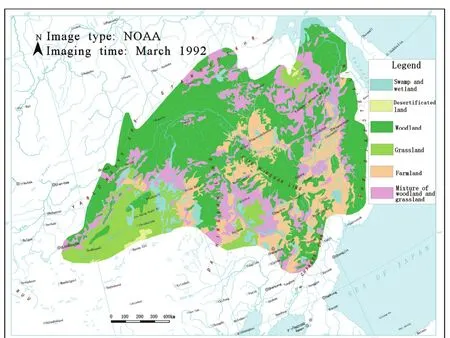
Fig.3 Remote sensing interpretation image of Amur River Basin in 1992
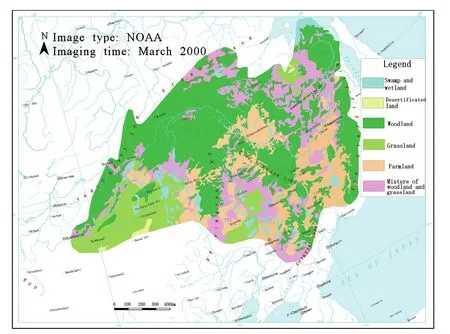
Fig.4 Remote sensing interpretation image of Amur River Basin in 2000
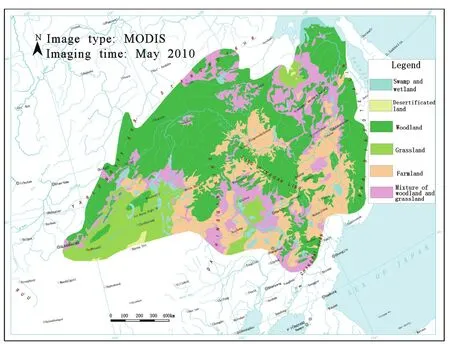
Fig.5 Remote sensing interpretation image of Amur River Basin in 2010
Methodology
Land use dynamic(LUDI)
LUDI represents the dynamic change of different land uses in a given study period. Liu Jiyuan (1996) divides LUDI into four types based on the magnitude of dynamic degree of land use,as shown in Table 1.

Table 1. Grading of land dynamic characteristics
LUDI includes both single land use dynamic and comprehensive land use dynamic.
(1) Single land use dynamic
This describes quantitatively the speed at which land type changes within a defined period and certain extent, and it plays an essential role in comparing the regional differences of land use change and in forecasting the changes in trends in future land use (Shi Peijun and Gongpeng 2000),This is expressed in Eq1:

Where K is a certain land use dynamic in study area; Ua, Ubare quantities of a certain type of land use at the beginning and end of study period;When the time period of T is year, yielding the value of K, annual the change rate of land use type in study area.
(2) Comprehensive dynamic degree of land use
This may be used to characterize the comprehensive change in speed of land use of the study area, this is expressed in Eq2:

Land use transfer matrix
The land use transfer matrix may be obtained through processing and calculating raster image by applying a land use algebra principle, when theland type is less than 10,and for any two periods of land use type map can be obtained by Eq.3:

In the land type transition matrix, each row represents each land use type before change respectively and each column represents each land use type after change respectively.
Result analyses
The calculated results of LUDI in the study area are shown in Table 2.
It can be demonstrated from table 2 that: From 1992 to 2000, the single land use dynamic from large to small are: desertified land > farmland>mixture of woodland and grassland > swamp and wetland > grassland > forest land. It can be seen that the desertified land has the maximum dynamic degree of 23.55, belonging to the dramatic change type; the woodland has the minimum dynamic degree of 2.86, belonging to the extremely slow change type;
From 2000 to 2010, the single land use dynamic from large to small are: desertified land >swamps and woodland > grassland > mixture of woodland and grassland> farmland > woodland. It can be seen that the desertified land has the maximum dynamic degree of 22.43, belonging to the dramatic change type;
However, from 1992 to 2010, the comprehensive land use dynamic in study area is 15.25, indicating that in the period of 18 years, the land type in the Amur River Basin belongs to the rapid change type.

Table 2 Land use dynamic degree of Amur River Basin Unit:104 km2
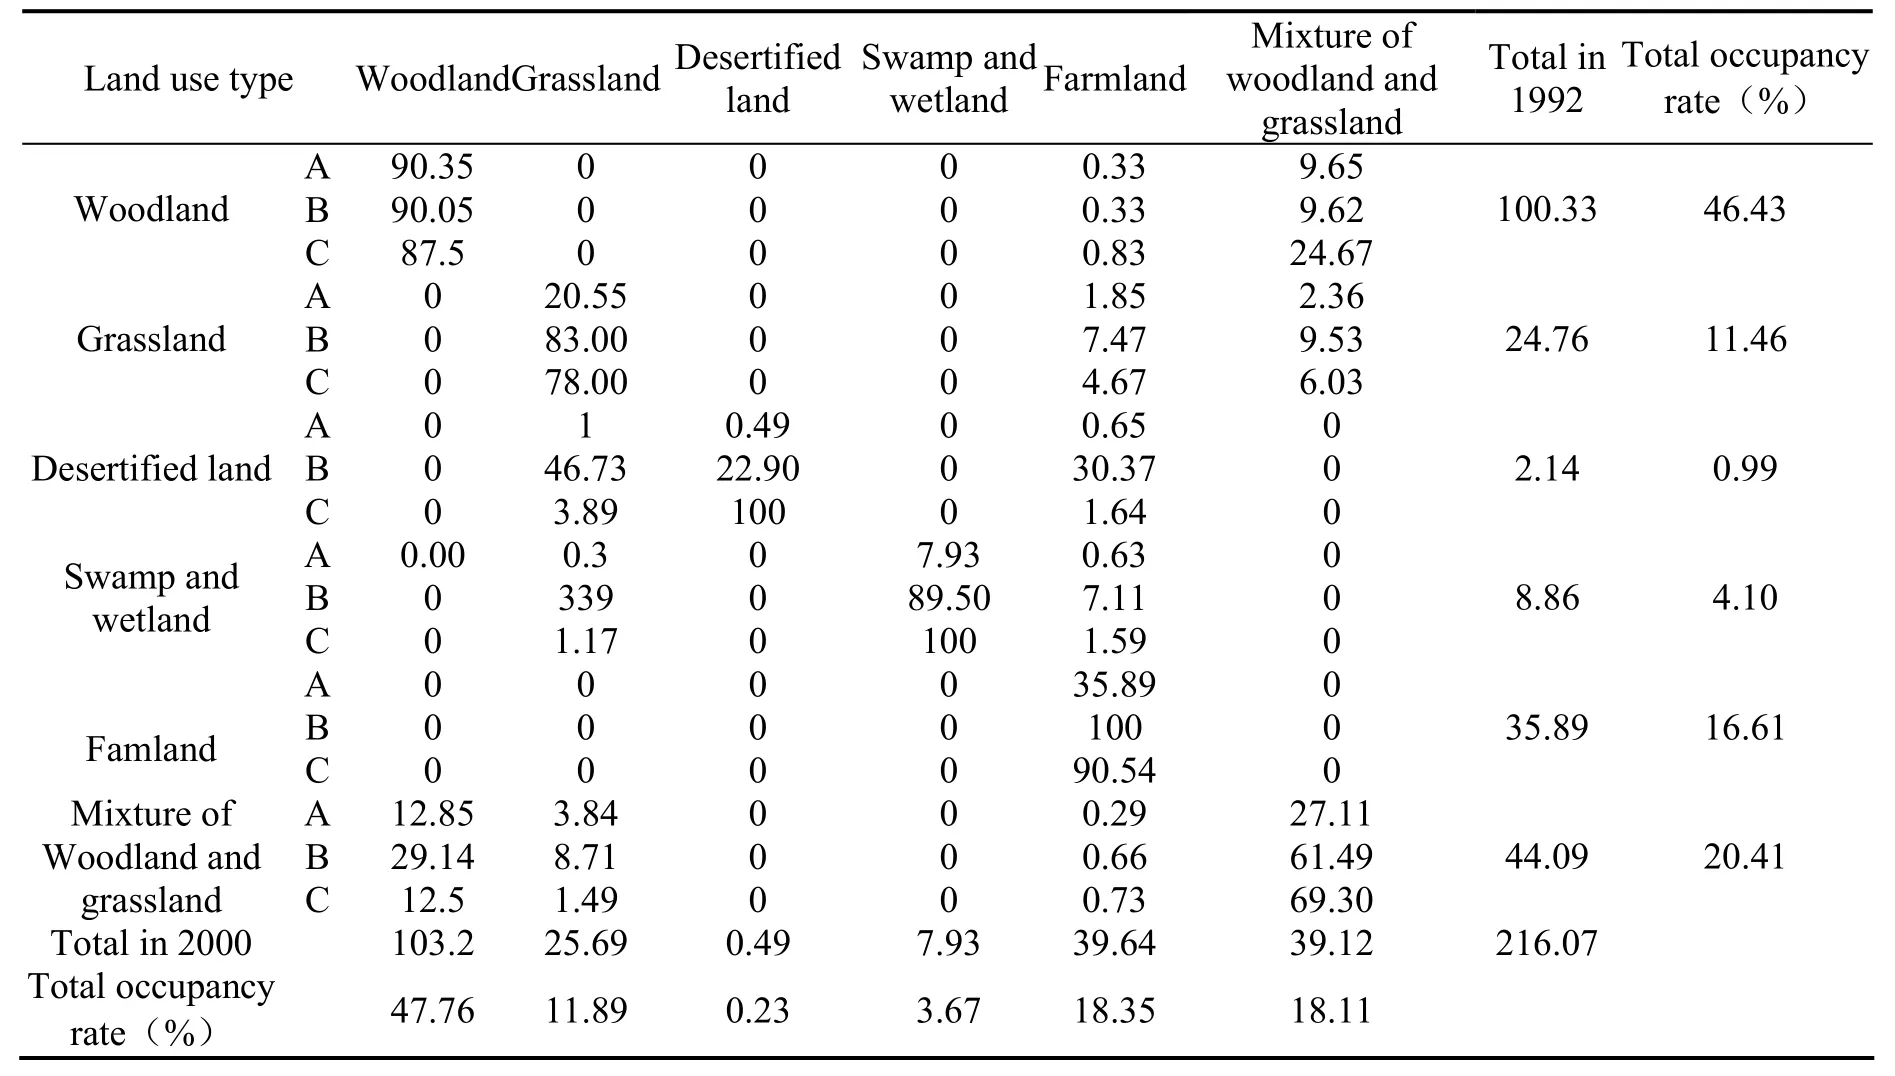
Table 3 Transfer matrix of land use type change from 1992 to 2000 Unit:104 km2
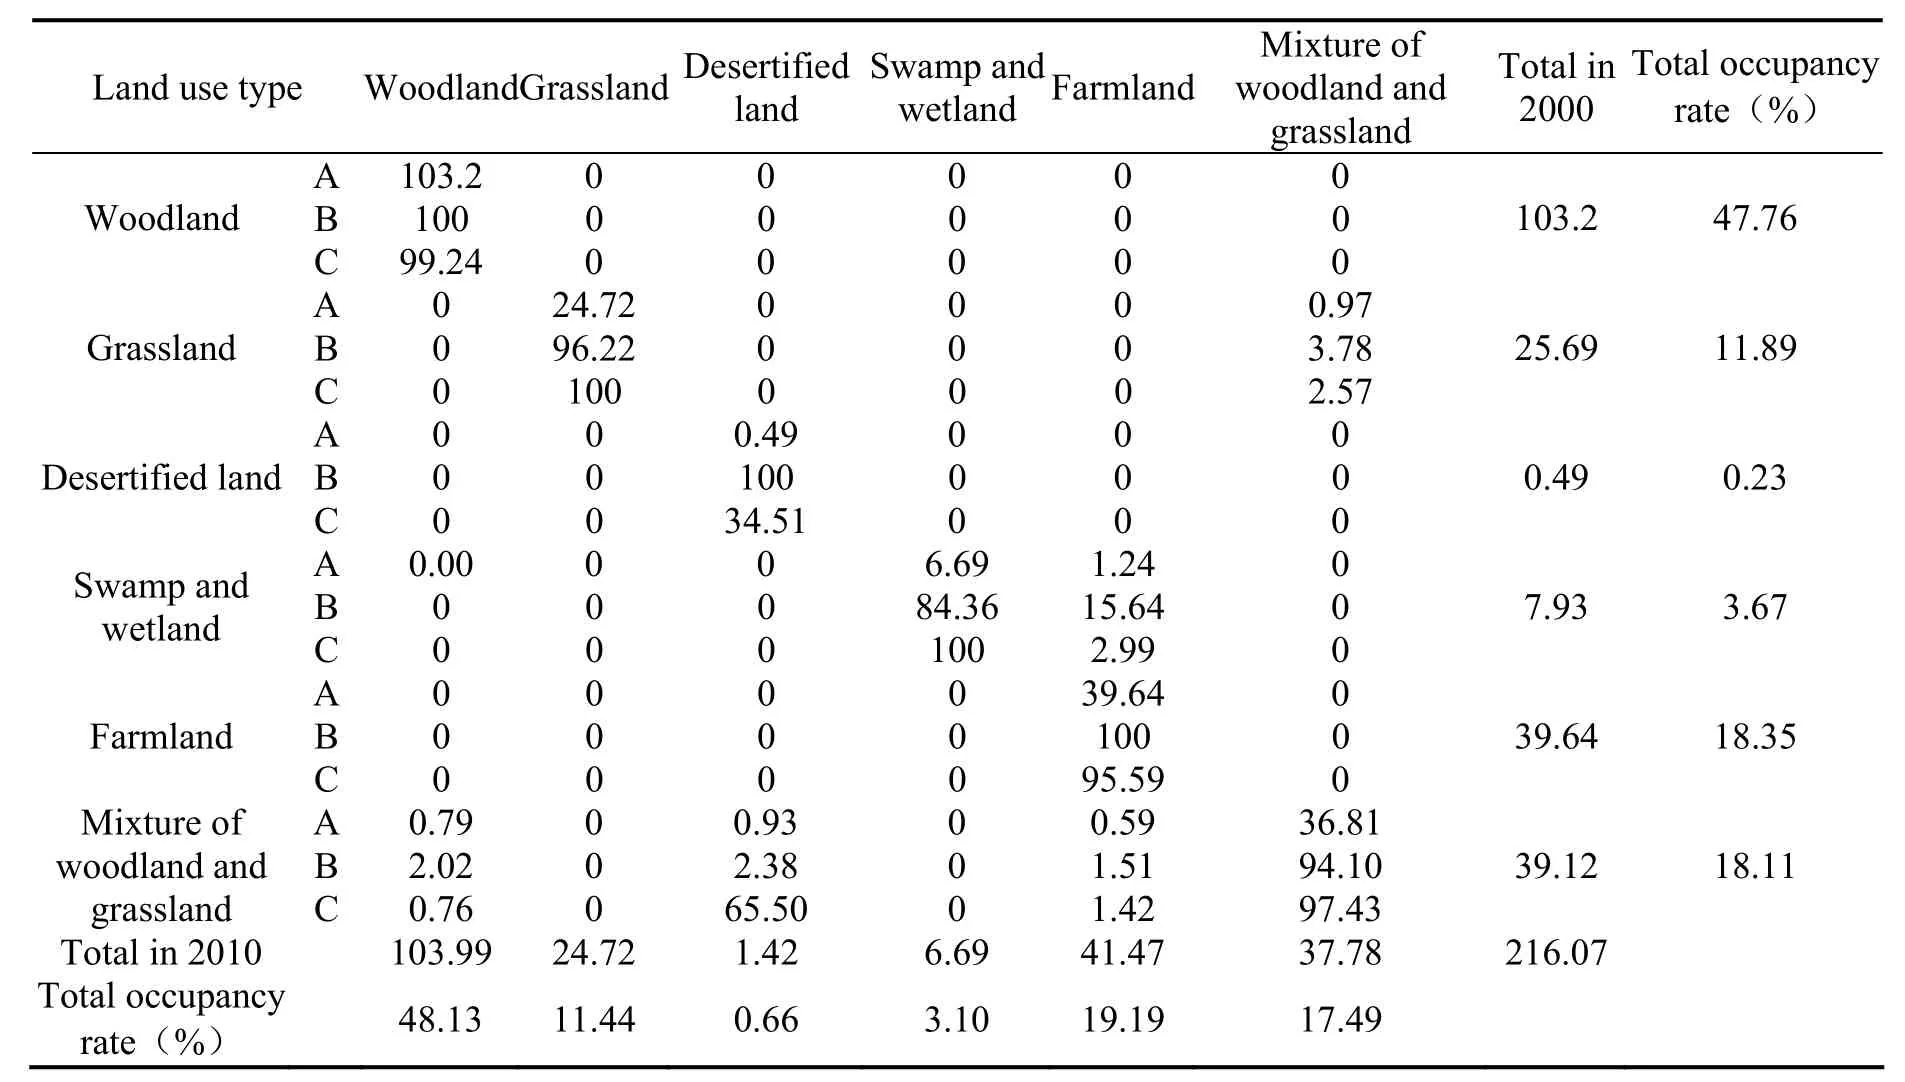
Table 4 Transfer matrix of land use type change from 2000 to 2100 Unit:104 km2
It can be seen from Fig.2 - Fig.4 that the woodland is mainly distributed in the higher terrains, such as Da Hinggan Mountains and Xiao Hinggan Mountains, Block Panov Mountains,Stanovoi Ranges and Sikhote-Alin Mountains.Therefore, the area of woodland has increased continuously, the woodland mainly changes into mixture of woodland and grassland with changing ratio of 12.5% from 1992 to 2000 and 0.76% from 2000 to 2010, showing decreasing tendency.
It can be seen from table 2 and Table 3 that the farmland area is increasing. From 1992 to 2000,the farmland mainly changed into swamp and wetland, woodland and mixture of woodland and grassland, with the changing ratio of 1.59%, 0.83 and 0.73% respectively However, from 2000 to 2010, the farmland mainly changed into swamp and wetland and mixture of woodland and grassland, with changing ratio of 2.99% and 1.42%respectively. The part of wetland reduced mainly converted to farmland, and the ratio of swamp and wetland into farmland is 7.11% from 1992 to 2000 and 15.64% from 2000 to 2010, showing remarkable conversion rate. The grassland area increased from 1992 to 2000, but decreased from 2000 to 2010. From 1992 to 2000, the grassland mainly changed into a combination of desertified land, a mixture of woodland and grassland, swamp and wetland, with changing ratio of 3.89%, 1.49%and 1.17% respectively. From 2000 to 2010, the grassland converted mainly from mixture of wood and grassland, with a converting area of 37,800 km2and a ratio of 2.57%.
It can be seen from Fig. 2 - Fig. 4 that desertified land is mainly distributed in Hulun Buir area of Inner Mongolia and the Sino-Mongolian bordering area, the covering area appeared to undergo a substantial reduction followed by an increase. From 2000 to 2010, the desertified land mainly changed into a mixture of woodland and grassland, with the changing ratio of 65.5%.Therefore, this indicated that in a period of 10 years, the land ecological environment in the Amur River Basin deteriorated markedly, and desertified land increased.
Conclusion and discussion
From the viewpoint of integrated land use dynamic(LUDI), from 1992 to 2010, the comprehensive land use dynamic in study area is 15.25, it can be seen that within 18 years the land type in the Amur River Basin underwent a rapid type change, and the human activities aggravate the dynamic change of land type.
The transfer matrix analysis showed that within 18 years, the area of forest land has continued to increase gradually into the mixture type of woodland and grassland, which is the result of construction of shelter-forest plantation in North China, Northeast China and Northwest China.Furthermore; the farmland area is also increasing,and this farmland mainly changes into the swamp and wetland, woodland, mixture of woodland and grassland. The swamp and wetland are shrinking significantly, the part of the wetland that has been reduced mainly converts to farmland, this is mainly caused by the reclamation of wetland and groundwater pumping for irrigation. In the last 10 years, the land ecological environment in the Amur River Basin has deteriorated markedly, specifically,the area of desertified land increases, which has changed mainly into the mixture of forest land and grassland.
In order to harness the ecological environment of the river basin, the normative development of natural wetland must be followed and the ecological security mechanism of wetland water utilization must be established. In Hulun Buir area of Inner Mongolia, management measures should be continuously taken, such as reducing herd numbers, banning seasonal grazing or permanent grazing. In the Sino-Mongolian border area,harnessing measures should also be taken to protect the area following the achievements of the initial results and preventing re-damage until it is able to fully recover. The effective protective measures for the mixture of forest land and grassland should be taken and the deforestation for cultivated land should be banned. The area of shelter-forest in North China, Northeast China and Northwest China should be further expanded with a result of truly sustainable development of the ecological environment in the Amur River Basin.
Acknowledgements
The project, entitled “Geological Environment Serial Map Compilation of Asia and Geological Environment Issues (1:5,000,000)”(1212011120137), is sponsored by China Geological Survey.
杂志排行
地下水科学与工程(英文版)的其它文章
- Source and Formation of the Arsenic in Ground Water in Hanoi , Vietnam
- Stable Isotope Composition of Rainfall, Surface Water and Groundwater along the Yellow River
- Organic Contamination of Soil and Goundwater in the Piedimont Plain of the Taihang Mountains
- Comparison of Three Brine Migration Models in Groudwater
- Effect of Farmyard Manure Application on Dissolution of Carbonate Rocks and Its Eco-environmental Impact
- Groundwater quality Management in China
