Dynamic test methods for natural frequency of footbridge*
2013-11-01WANGCaifeng王彩锋GAOShiqiao高世桥JINLei
WANG Cai-feng(王彩锋), GAO Shi-qiao(高世桥), JIN Lei(金 磊)
(School of Mechatronical Engineering, Beijing Institute of Technology, Beijing 100081, China)
Dynamic test methods for natural frequency of footbridge*
WANG Cai-feng(王彩锋), GAO Shi-qiao(高世桥), JIN Lei(金 磊)
(School of Mechatronical Engineering, Beijing Institute of Technology, Beijing 100081, China)
Using environmental random vibration as the excitation, traditional accelerometer method, non-contact video method and non-contact laser method were employed to determine the natural frequency of Kunyu River footbridge. All the results of these three methods are close to 2.70 Hz, which are concordant with each other and hence credible.
test method; non-contact; natural frequency; amplitude-frequency curve
In recent decades, more and more new materials are used in footbridges. From the view of aesthetics of public building, designers have tried various kinds of structure forms. Accordingly pedestrian bridges have become much lighter, slender and long-span. These trends cause the structures to become more susceptible to vibration when subjected to dynamic loads[1]. As a result, the serviceability and safety problems of structures have attracted more considerable attention. There have been many serviceability problems occurring in the last twenty years[2,3]. The infamous Millennium Bridge in London is a prime example of vibration serviceability problem.
The dynamic loads causing footbridges vibration are mainly man-induced loads due to using function of bridges. This kind of load is different from the load due to vehicle, wind, earthquake, etc. Moreover, it is more complex than other loads. The different man actions, such as walking, running and jumping, will cause different properties of dynamic loads[1,4,5]. The step frequency of people's normal walking is from 1.6 Hz to 2.4 Hz, meanwhile step frequency of running ranges from 2.0 Hz to 3.5 Hz, step frequency of jumping is from 1.8 Hz to 3.4 Hz[6,7]. In fact, if the frequency of human action is vicinal to the natural frequency of footbridge, it may cause safety and serviceability issues[8]. So design frequency of footbridge must avoid the frequency domain mentioned above. For the bridges in service, the key is to get its exact natural frequency.
According to bridge vibration theory[9], the vibration frequency is closely related to the stiffness and mass of the bridge, which is an important index of characteristics of bridge. The modal parameters includes frequency, damping and model shape. However, in practical dynamic test on the bridge, it is only the frequency that has high precision and good reproducibility. The recognition of vibration frequency of newly-built bridge, especially the first natural frequency, plays an important role in validating the material parameters and boundary conditions of numerical model, which can also give a further revision. For the bridges in use, long-term monitoring for the vibration frequency of the structures is very useful for the evaluation of stiffness and strength. Based on the frequency, we can identify the potential damage of the bridge, for instance, we can estimate whether the bridge endures long-time overload[10]. So investigation on how to acquire the natural frequency of the used bridge accurately, quickly and conveniently has far-reaching theoretical significance and engineering value.
1 Test methods of bridge
The traditional methods for determining the frequency are most by aid of dynamic response signal of the bridge. In civil engineering there are three means: forced vibration method, free vibration method and environmental random vibration method. Forced vibration method is based on determined input signal known yet. Free vibration method is to record damped free vibration information with the structure imposed an impulse load. Because the real bridge has a huge and complicated structure, it has a low natural frequency and hence it is susceptible to external environment. In practice, it is not easy to make sure the input excitation signal and impulse signal. Environmental random vibration method is a low-cost way that utilizes natural excitation[11], for instance, wind and traffic load, and of the three methods it is the most commonly used one.
2 Practical tests and results
In this article, the research object is a three-span footbridge crossing Kunyu River in Beijing. Its overall length is 120.8 m, including the mid-span 48.1 m and each side-span 36.35 m, with its width 4.38 m. The main material of bridge deck is reinforcing steel and it is about 100 t. Fig.1 is the footbridge we researched. Since the vehicle flow rate is considerable, we adopt environmental random vibration method.

Fig.1 Kunyu River footbridge
In good weather condition we conducted the tests. During the tests anyone was forbidden onto the bridge. In this article, in addition to the traditional accelerometer measurement, we explored two other means for determining the vertical natural frequency together with other dynamic parameters of the footbridge, which are non-contact video measurement and non-contact laser measurement.
2.1 Traditional accelerometer measurement
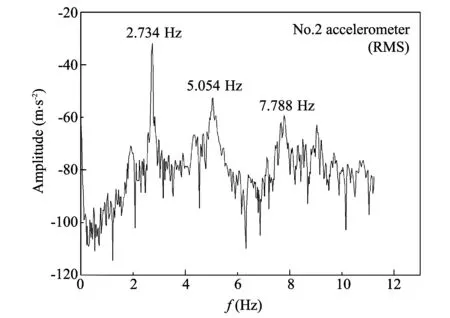
This suit of test system is composed of CoCo-80 dynamic signal analyzer (shown in Fig.2) and three piezoelectric acceleration sensors (shown in Fig.3). CoCo-80 dynamic signal analyzer is made by crystal-instrument Co.Ltd, which has 8 input channels with the maximal sampling frequency 102.4 kHz. No.1 accelerometer was located at the midpoint, and No.2 accelerometer and No.3 accelerometer were respectively fixed at the position with a distance 12 m away from midpoint along the two directions of deck. Firstly we got the accelerations of the three positions of the footbridge, and then we computed their amplitude-frequency curves by fast Fourier transform algorithm. Fig.4,Fig.6 and Fig.8 show the vertical accelerations of each position, and their corresponding root-mean-square (RMS) values of the amplitude are shown in Fig.5,Fig.7 and Fig.9, respectively.

Fig.2 CoCo-80 dynamic signal analyzer

Fig.3 Piezoelectric acceleration sensor

Fig.4 Acceleration of No.1 accelerometer

Fig.5 Amplitude-frequency curve of No.1 accelerometer

Fig.6 Acceleration of No.2 accelerometer

Fig.7 Amplitude-frequency curve of No.2 accelerometer

Fig.8 Acceleration of No.3 accelerometer
From Fig.5,Fig.7 and Fig.9 we can obtain the first three orders of natural frequency of the footbridge in vertical direction, which are respectively 2.734Hz,5.054Hz,7.788Hz with good consistency.

Fig.9 Amplitude-frequency curve of No.3 accelerometer
2.2 Non-contact video measurement
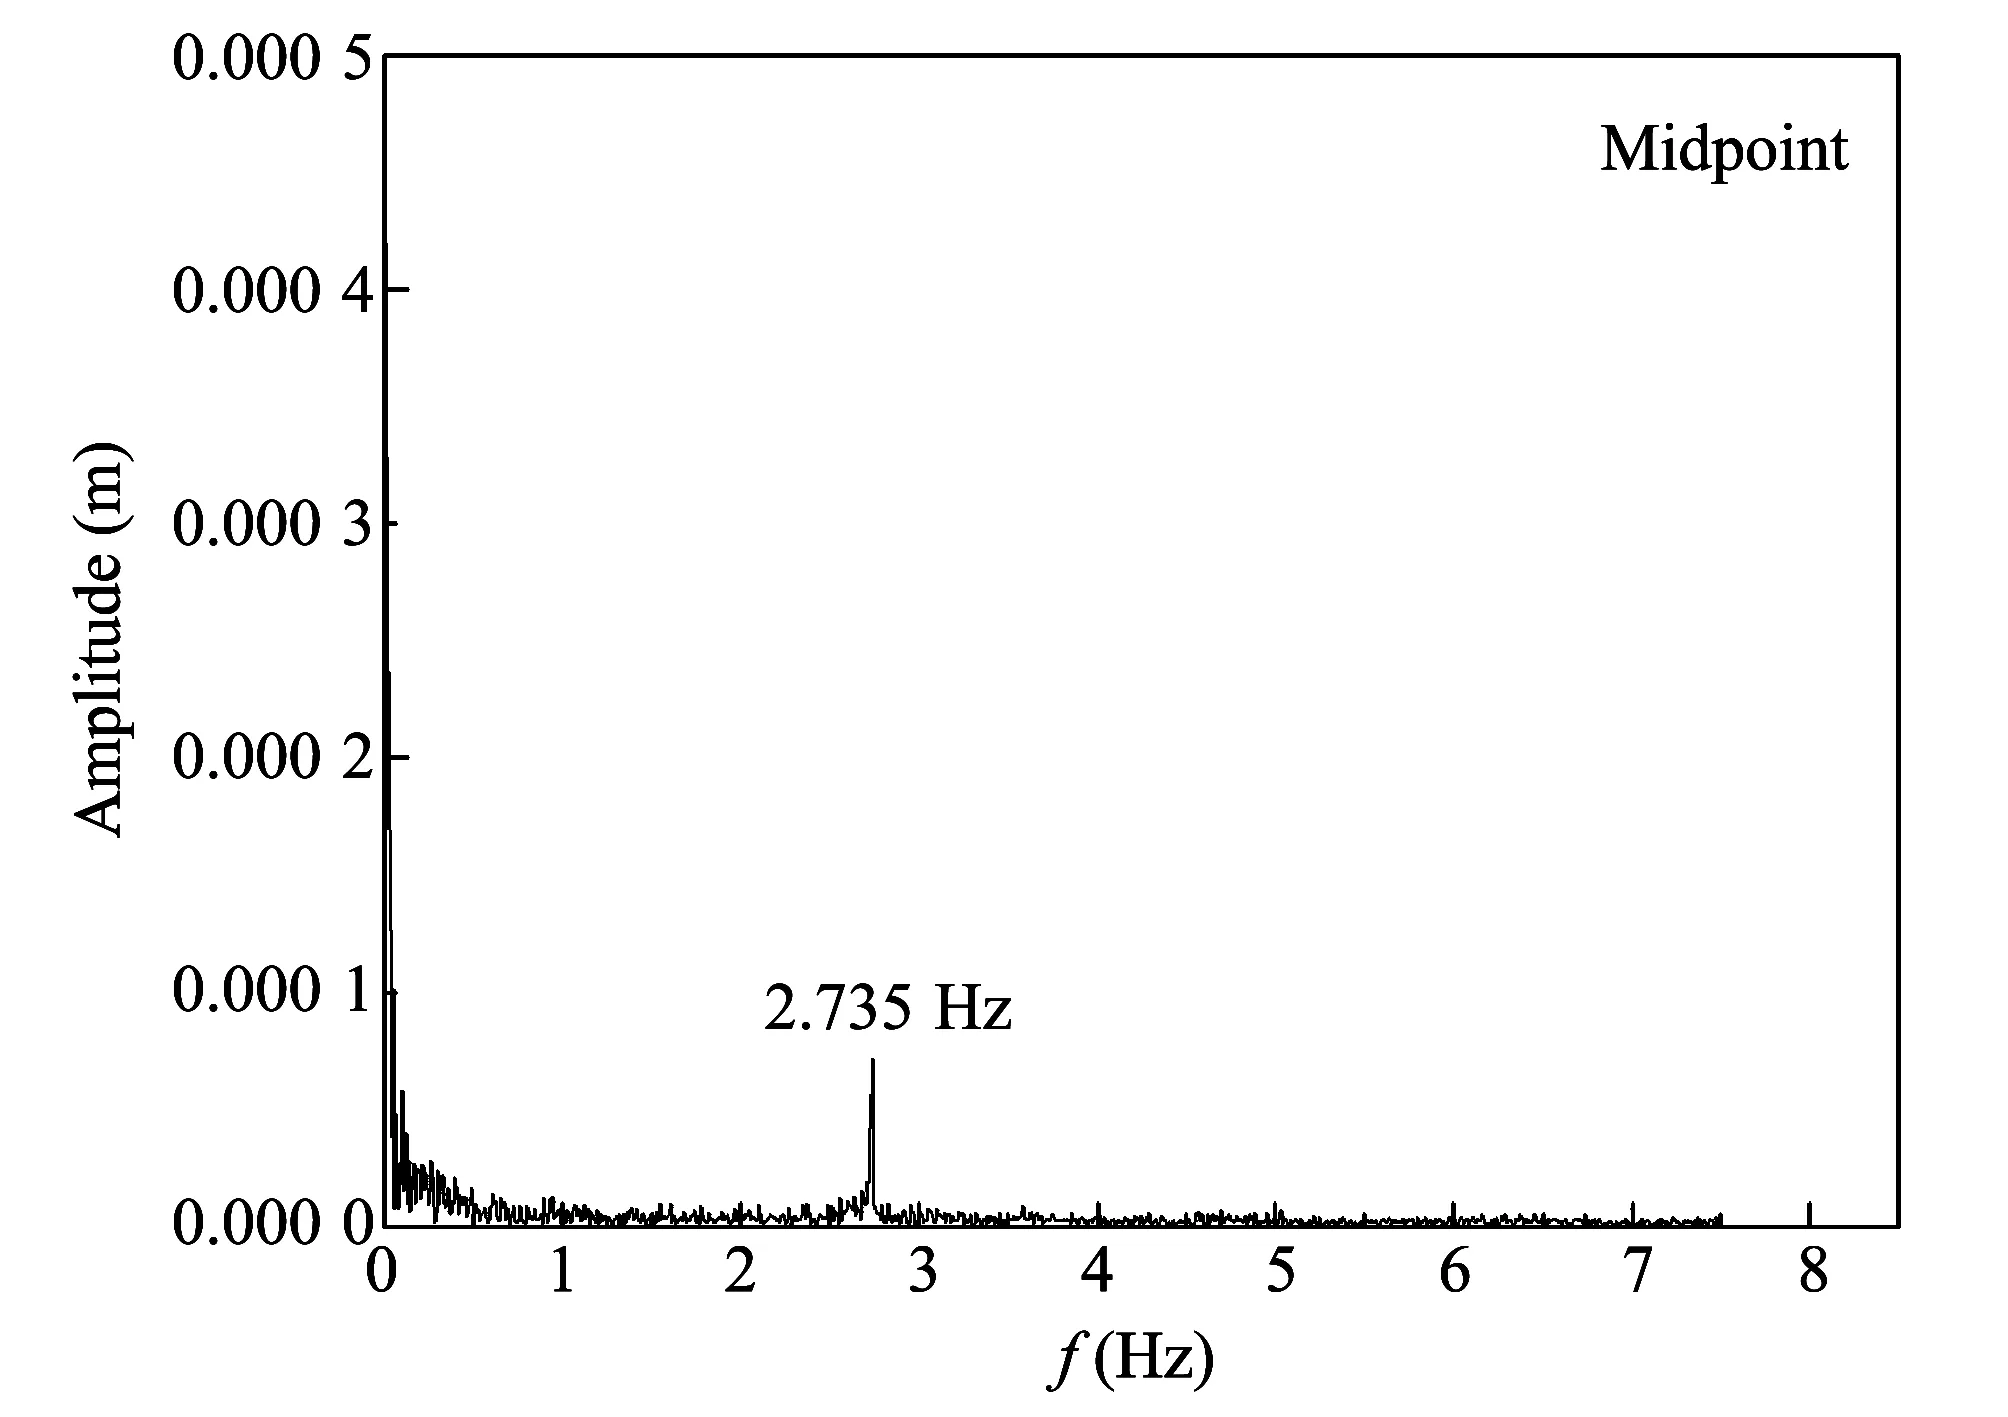
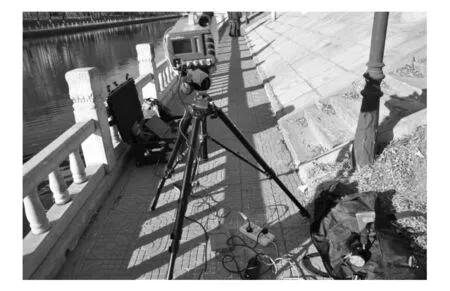
This suit of test system (shown in Fig.10) includes a video camera and a post process software installed in a laptop. Focusing on one target (shown in Fig.11) easily discriminated in the side face of the deck using the video camera, we obtained some basic information of the deck. Fig.12 presents the displacement of the midpoint of the footbridge, and Fig.13 is its amplitude-frequency curve.

Fig.10 Non-contact video measurement system

Fig.11 Target

Fig.12 Displacement of midpoint

Fig.13 Amplitude-frequency curve of midpoint
Considering the limitation of this system, with the known data we can only read its first order natural frequency in the vertical direction, which is 2.735 Hz.
2.3 Non-contact laser measurement
Non-contact laser test system (shown in Fig.14) adopts a digital laser doppler vibrometer (LDV) and PicoScope4000 software installed in a laptop.

Fig.14 Non-contact laser measurement system
LDV produced by OptoMET Co.Ltd achieves mechanical and acoustical parameters by Doppler principle of laser without contacting the object. It has very high linearity, precision and accuracy. By use of this system we can read out the frequency instantaneously.
In our experiment, we enable the laser beam shoot on the bottom surface of the bridge deck vertically. Here we conducted the test via three options of LDV, displacement method, velocity method and acceleration method, respectively. The corresponding testing results are shown separately in Fig.15, Fig.16 and Fig.17.

Fig.15 Amplitude-frequency curve of displacement method

Fig.16 Amplitude-frequency curve of velocity method

Fig.17 Amplitude-frequency curve of acceleration method
From three amplitude-frequency curves presented in Fig.15, Fig.16 and Fig.17, we can easily read the frequency at peak amplitude, which is respectively 2.731 Hz by displacement method, 2.721 Hz by velocity method, 2.709 Hz by acceleration method. The three results are quite close.
3 Summary and conclusion
By the foresaid three methods we can get the first order natural frequency. The frequency from traditional accelerometer method is averagely 2.734 Hz, the frequency by non-contact video method is 2.735 Hz, and the frequency by non-contact laser method is averagely 2.720 Hz. The results are all adjacent to 2.70 Hz, proving that the three methods are all feasible and believable. Of the three methods, result of traditional accelerometer measurement and result of non-contact video measurement are a!little higher than the result of non-contact laser measurement, the reason is that the signal from accelerometer contains some environmental noise which cannot be easily filtered out, while the non-contact video method is based on image recognition and conversion from pixel to actual distance, where it is hard to avoid some errors. Thus the result by non-contact laser method is much more reliable. This method is simple with equipment easily taken and operated, which should be developed further.
[1] GAO Shi-qiao, WANG Dong, JIN Lei. Influence of the human body on the characteristics of a pedestrian bridge. In: Proceedings of the 18th ISSAT International Conference on Reliability and Quality in Design, Boston, Massachusetts, USA, 2012.
[2] WANG Dong, GAO Shi-qiao, Kasperski M, et al. The dynamic characteristics of a couple system by pedestrian bridge and walking persons. Applied Mechanics and Materials, 2011, 71-78: 1499-1506.
[3] WANG Dong, GAO Shi-qiao, Kasperski M, et al. Simulation of the dynamic characteristics of the coupled system structure. Applied Mechanics and Materials, 2011, 71-78: 1507-1510.
[4] WANG Dong, Kasperski M, GAO Shi-qiao. Change of the dynamic characteristics of a pedestrian bridge during a mass event. In: Proceedings of the 8th European Conference on Structural Dynamics, Leuven, Belgium, 2011.
[5] Zivanovic S. Probability-based estimation of vibration for pedestrian structures due to walking. Sheffield: The University of Sheffield, 2006.
[6] Pedersen L, Frier C. Sensitivity of footbridge vibrations to stochastic walking parameters. Journal of Sound and Vibration, 2010, 329: 2683-2701.
[7] Ingolfsson E T, Georgakis C T, Ricciardelli F, et al. Experimental identification of pedestrian-induced lateral forces on footbridges. Journal of Sound and Vibration, 2011, 330: 1265-1284.
[8] Qin J W, Law S S, Yang Q S, et al. Pedestrian-bridge dynamic interaction, including human participation. Journal of Sound and Vibration, 2013, 332(4): 1107-1124.
[9] LI Guo-hao. Stability and Vibration of Bridge Structure. Beijing: China Railway Publishing House, 1996.
[10] Fujino Y, Abe M, Shibuya H, et al. Forced and ambient vibration tests and vibration monitoring of Hakucho suspension bridge. Transportation Research Record, 2000, 1696(2): 57-63.
[11] Zuo D L, Hua J Y, Landuyt D V. A model of pedestrian-induced bridge vibration based on full-scale measurement. Engineering Structures, 2012, 45: 117-126.
date: 2013-03-06
Ministry of Science and Technology of China for sponsoring the “Cooperation Research on the Dynamic Safety and Serviceability of Public Structures Servicing for Human” (No. 2010DFB74280) between Beijing Institute of Technology and Ruhr-University Bochum
WANG Cai-feng (rudygey@126.com)
CLD number: TU997 Document code: A
1674-8042(2013)03-0218-05
10.3969/j.issn.1674-8042.2013.03.004
杂志排行
Journal of Measurement Science and Instrumentation的其它文章
- Test on oxygen and benzene contents in gasoline by mid-infrared spectroscopy*
- Particle-filter-based walking prediction model for occlusion situations*
- Automatic estimation and removal of noise on digital image*
- Application of signal sparse decomposition in dynamic test*
- Kravchenko probability weight functions in problems of radar signals correlation processing*
- AC current automatic calibration using two different TCC designs*
