EDTA辅助水热法制备性能优异的棒状LiFePO4/C材料
2013-10-17钟本和钟艳君郭孝东
董 静 钟本和 钟艳君 唐 艳 刘 恒 郭孝东*,
(1四川大学化学工程学院,成都 610065)
(2四川大学材料科学与工程学院,成都 610065)
Since the pioneering work of Padhi et al.[1],the olivine-type phosphates LiFePO4has received extensive attention with respect to its application as a cathode material in rechargeable Li-ion batteries,owing to its high theoretical capacity (170 mAh·g-1),low cost,environmental benign and high safety.In addition,LiFePO4has good cycle stability and a flat discharge potential of 3.45 V versus Li+/Li.Despite the above mentioned advantages,the main obstacles for LiFePO4are its intrinsic low electronic conductivity(~10-9cm2·s-1)[2]and low lithium ion diffusivity(~10-18cm2·s-1)[3].Great progress has been made to improve the performances and synthesis techniques of LiFePO4up to now.To eliminate the impediments of LiFePO4materials,numerous approaches have been reported,such as coating different conductive materials(conductive carbon or polymers)[4-5],minimizing the particle size[6-8]and doping with supervalence cation[9].Furthermore,numerous synthetic strategies have been developed to synthesize LiFePO4,such as co-precipitation,solid-state reactions,sol-gel,solvothermal and hydrothermal method.Among them,the hydrothermal synthesis of LiFePO4is a promising method due to its narrow particle size distribution,fast reaction rate and facile size control.
Owing to the importance of particle shape on the performance of LiFePO4,lots of studies have been devoted to the preparation of olivine LiFePO4with various morphologies and reduced particle size in hydrothermal method.For instance,Fei Teng et al.synthesized LiFePO4nanodendrites in the ethylene glycol/water (EG/W)system using dodecyl benzene sulphonic acid sodium(SDBS)as the surfactant[10]and developed to fabricate LiFePO4nanorod arrays using anodic aluminum oxide(AAO)as the template[11].Lu et al.[12].reported that LiFePO4with a variety of unusual morphologies was prepared in the presence of ammonium ions and citric acid.Dinesh Rangappa et al.[13]synthesized hierarchical flower-like LiFePO4using ethylene glycol as the solvent with oleic acid and hexane as the surfactant and co-solvent.In general,the primary approaches to prepare welldefined morphology and smallerparticlesizein hydrothermal method are using organic solvent or template,which make the preparation process more complex and more expensive.We report here a simple,quick and low cost hydrothermal synthesis onlyusingEDTA asthecomplexingagentand dispersing agent to prepare the defined morphology with reduced particle size.The obtained rod-like LiFePO4exhibits narrow particle size distribution and better electrochemical properties.
1 Experimental
1.1 Synthesis of LiFePO4/C
All the reactants were of analytical grade and used without further purification.In a typical synthesis,0.3 mol H3PO4,0.3 mol FeSO4·7H2O and 0.9 mol LiOH·H2O were dissolved in deionized water,respectively.First,the lithium source and phosphorus source were blended under magnetic stirring,and then FeSO4solution slowly added to the above solution to keep the molar ratio nLi∶nFe∶nP=3∶1∶1.Finally,0.03 mol EDTA was added to the obtained solution.After that,the resulting mixture was transferred into a 2L-capacity Teflon-lined stainless steel autoclave,and then heated at 180 ℃ for 10 h.After being cooled to room temperature,the productwas centrifuged,washed severaltimeswith absolute alcoholand distilled water and then dried in a vacuum oven at 90℃ for 12 h.For further carbon coating on LiFePO4nanostructures,the powders after drying mentioned above were mixed with glucose (20wt%)as a carbon source by planetary ball milling,and then the blend was calcined at 700℃ for 5 h in an inert atmosphere.In order to confirm the influence of EDTA on the products,a control experiment was also carried out.The LiFePO4/C materials prepared with EDTA and without EDTA were denoted as sample A and B.
1.2 Materials characterization
The phase structures ofthe samples were investigated by X-ray diffraction (XRD,D/max-rB,Rigaku,Cu Kα radiation)(λ=0.154 18 nm,40 kV,40 mA,scintillation counter,scanning range (2θ):10°~70°,step scanning:0.5°·min-1).The morphology and particle size ofthe prepared nanocrystals were observed by scanning electron microscopy(HITACHI S-4800).The microstructure and the surface texture of crystal were observed by transmission electron microscopy (JEM-2100) operated at 200 kV acceleration voltage.The particle size distribution was estimated by laser particle size distribution tester(JL-1155).The electronic conductivities of the samples were measured by a four-point probe method(KDY-1).The cyclic voltammetry tests and electrochemical impedance spectroscopy were performed on electrochemical workstation (CHI660B).The carbon content was measured by analytical instrument(CS-902).
1.3 Electrochemical characterization
The positive slurry was prepared with 80wt%active material,13wt%acetylene black(conducting additive), 7wt% polyvinylidene fluoride (PVDF,binder)and N-methylpyrro lidone(NMP,solvent).The slurry was spread uniformly onto a thin aluminum foil,dried in vacuum at 100℃for 16 h and then cut into pieces.The formed cathode was assembled into a CR2032 button battery in an argon-filled glove box,with Li anode,1 mol·L-1LiPF6in a mixed solvent of ethylene carbonate (EC)and dimethyl carbon(DMC)(VEC∶VDMC=1∶1)electrolyte and a Celgard-2400 separator.The electrochemical performance of the cells was tested by a high precision battery performance testing system.The cells were galvanostatically charged and discharged at room temperature between 2.5 and 4.3 V versus Li+/Li.
2 Results and discussion
2.1 Structure and morphology analysis
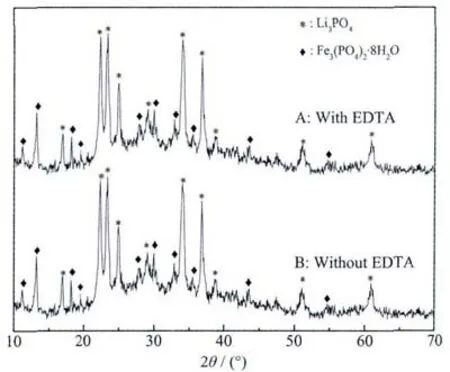
Fig.1 XRD patterns of precursors prepared with EDTA and without EDTA
Fig.1 shows the XRD patterns of precursors prepared with and without EDTA.The precursors were the precipitation prepared from the mixing of the raw materials.Itisfound thatthere isnoobvious difference between the two precursors.Allmain characteristic peaks ofthe two precursors are coincided with the diffraction peaks of Fe3(PO4)2·8H2O(PDF#30-0662)and Li3PO4(PDF#25-1030)without any obvious impurity phase.The results are consistent with previous reports[14-15]that Fe3(PO4)2·8H2O and Li3PO4must be the intermediate in the formation of LiFePO4.These observed results clearly indicate Fe-EDTA is not in the precursors,maybe it is dissolved and then not in the precursor or it could not be characterized by XRD.
The XRD patterns of LiFePO4/C composites are displayed in Fig.2.All the diffraction peaks in the XRD patterns could be indexed to an orthorhombic space group,Puma(PDF#83-2092).The XRD pattern clearly shows the single-phase formation of LiFePO4without any observable impurity phases (such as Fe3(PO4)2,Li3PO4,FeP).It demonstrates that the introduction of complexing agent does not change the sample′s crystal structure.Additionally,the intensity of all the diffraction peaks of sample A is stronger than sample B.This suggests that using EDTA as complexing agent isfavorableforincreasingthe crystallinity of the LiFePO4.The obtained lattice parameters are(a)a=1.029 656 nm,b=0.598 161 nm,c=0.467 506 nm with a cell volume of 0.287 94 nm3;(b)a=1.029 92 nm,b=0.598 68 nm,c=0.467 26 nm with a cell volume of 0.288 11 nm3for the two LiFePO4/C samples with EDTA (a)and without EDTA (b),respectively.It is clear that sample A owns smaller cellvolume,which mayberelated toabetter crystallinity with EDTA as complexing agent.These values are comparable with those reported earlier in the literatures[16-17].
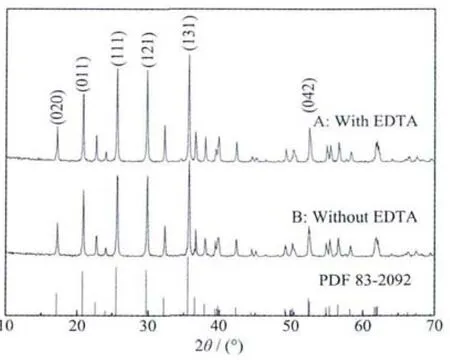
Fig.2 XRD patterns of sample A and sample B
There is no carbon observed in the XRD patterns,because the residual carbon decomposed from glucose and EDTA is amorphous in the LiFePO4/C composite[18].The carbon content of LiFePO4/C obtained with EDTA is 5.5%and another sample is 5.2%.Clearly,EDTA is not washed off completely during the filtering process.This can be ascribed to the remnant carbon after the pyrolysis of EDTA.Therefore,the carbon content of the sample A is a little more than that of sample B.
Fig.3 shows the SEM images of LiFePO4/C.By adding EDTA,rod-like LiFePO4is obtained,otherwise only irregular particles are prepared and the size of sample B is much larger than that of sample A.It demonstrates that EDTA chelation-assisted hydrothermal method can effectively decrease the particle size and control the morphology.As reported in the literatures[18-20],EDTA has been widely used as chelating agent and structure-directing template.The chelating role of EDTA group in the synthesis process is to greatly control the concentration of Fe2+,thus to modulate the growth rate ofLiFePO4crystallite.Therefore,the use of EDTA can effectively decrease the crystal size and modulate the crystal growth to obtain the defined shape.
The particle size distribution of sample A and sample B is shown in Fig.4.Sample A presents unimodal distribution,but bimodal distribution for sample B.The peak located between 10~100 μm is absence for sample A.As reported in the literature[21],EDTA has the function of dispersive action.Furthermore,the peak value of 0.1~1 μm for sample A is bigger than sample B,which coincides with the results of SEM.It indicates that adding EDTA in hydrothermalmethod can effectively reduce the particle agglomeration.
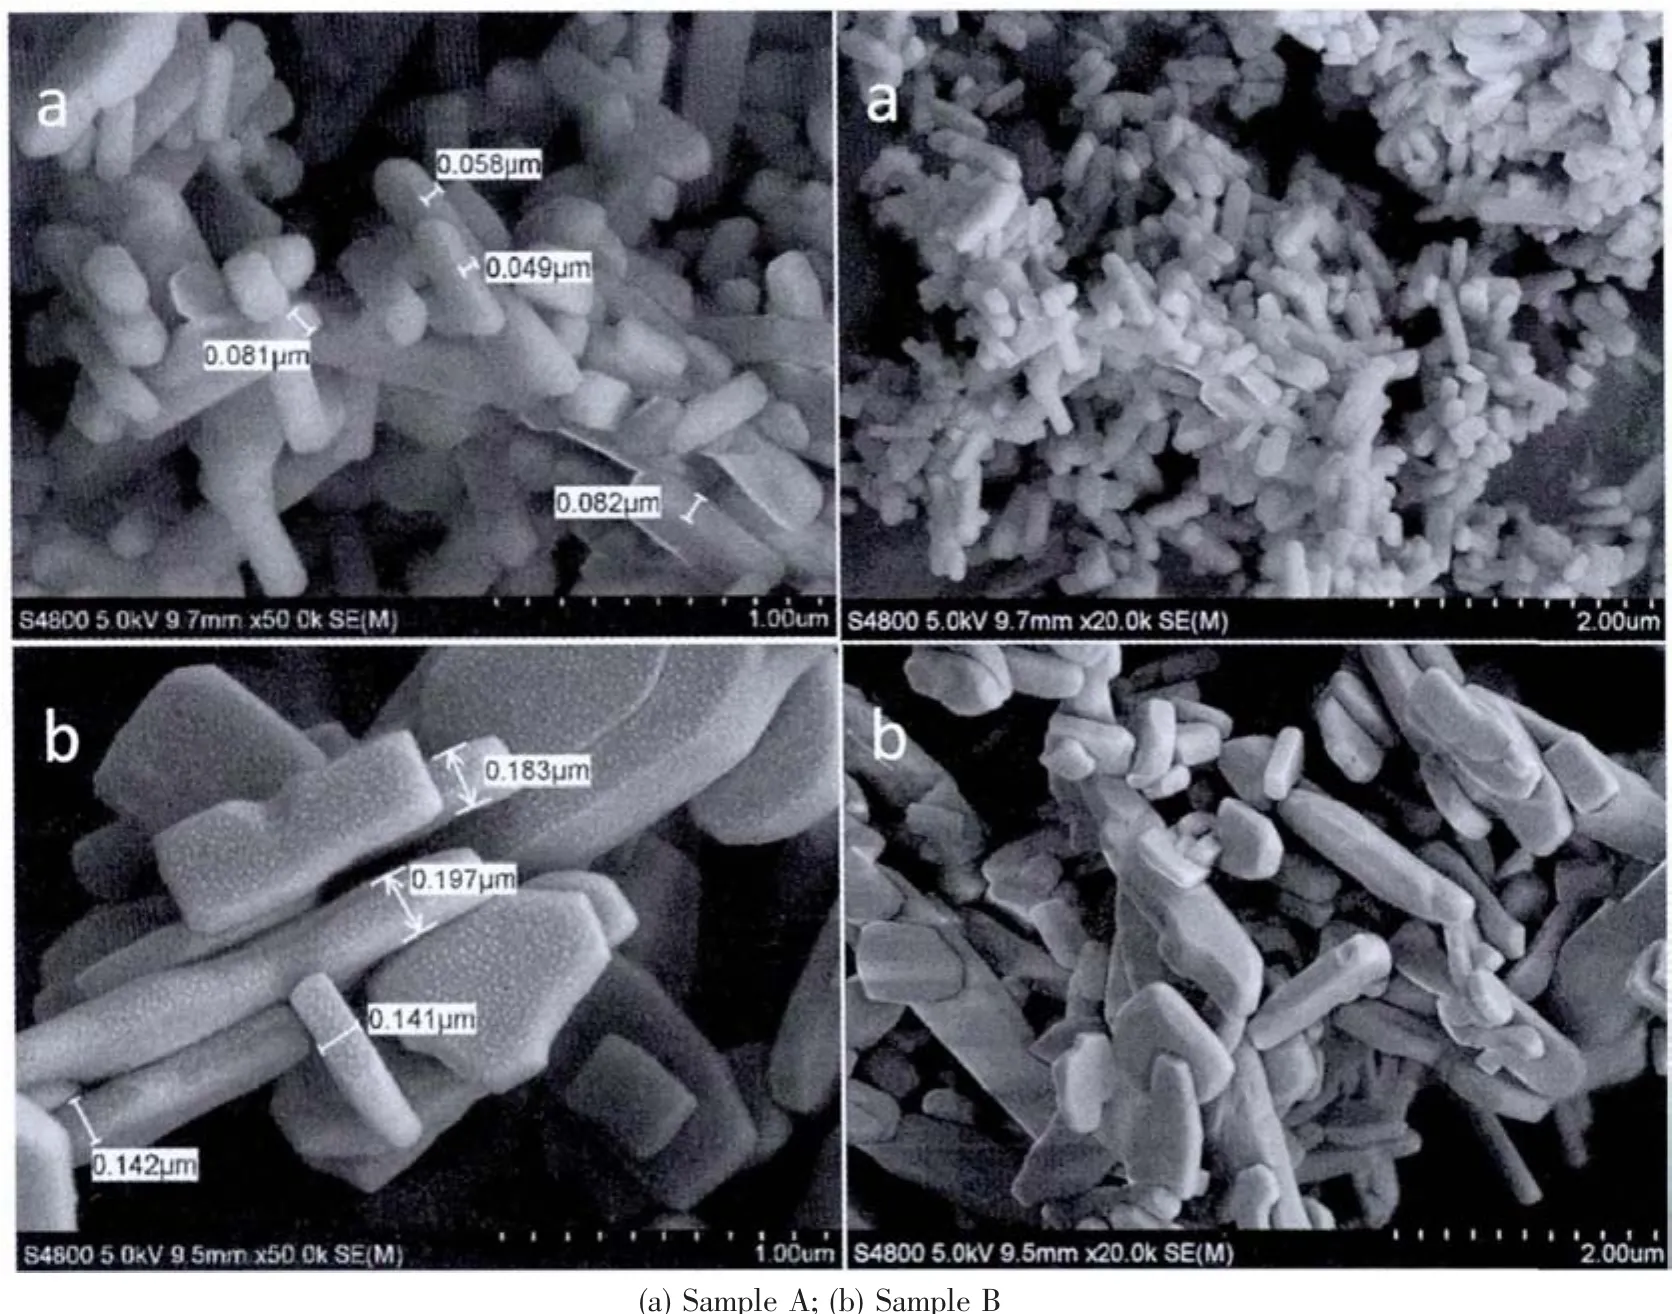
Fig.3 SEM images of LiFePO4/C
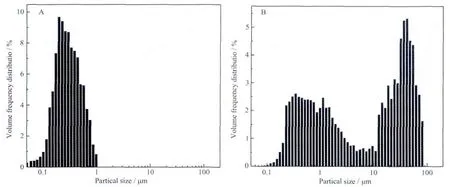
Fig.4 Particle size distribution of sample A and sample B
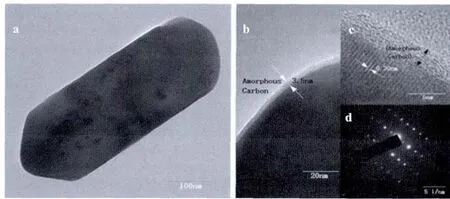
Fig.5 TEM,HRTEM image and SAED of LiFePO4/C obtained with EDTA
The morphology and microstructure of the rodlike LiFePO4obtained with EDTA were further characterized by TEM,high resolution TEM(HRTEM)and the selected area electron diffraction(SAED)images.Fig.5a presents the typical TEM image of LiFePO4/C.The morphology of the particles is nanosized rods,which is in good agreement with the above SEM observations.Fig.5b shows that an armorphous carbon coating layer with a thickness of ~3.5 nm is homogenously distributed on the LiFePO4particles,the uniform carbon layer is beneficial to improve the conductivity of the material.The HRTEM image displays clear crystal lattices with d-spacing of 0.30 nm,corresponds to the (020)plane of LiFePO4(Fig.5c).The SAED pattern in Fig.5d with clear lattice fringes suggests that the good crystalline LiFePO4nanostructures are formed under hydrothermal conditions by adding EDTA.
2.2 Electrochemical measurements
Fig.6a presents the galvanostatic charge/discharge curves of sample A and sample B measured at 0.1C in the potential range of 2.5 to 4.3 V.Both the samples possess a flat plateau around 3.4 V,which corresponds to the redox couple of Fe3+/Fe2+.Sample A delivers a higher discharge capacity of 167 mAh·g-1,but sample B presents a discharge capacity of 150 mAh·g-1.Meanwhile,sample B display a wider space of the charge-discharge voltage profiles than sample A,which indicates that sample A may possess lower electrode polarization and higher reversible capacity at a higher rate.Fig.6b shows the rate capability ofsample A and B.The discharge capacities of sample A are 167,157,147,134,120,101,79 mAh·g-1at 0.1C,0.2C,0.5C,1C,3C,5C and 10C,respectively,and sample B is 150,139,121,90,65,45,23 mAh·g-1at 0.1C,0.2C,0.5C,1C,3C,5C and 10C,respectively.It is obvious that sample A shows a higher capacity at every testing rate than sample B.The electronic conductivity of LiFePO4/C materials obtained with EDTA is 1.18 ×10⁻²S·cm-1and the LiFePO4/C materials obtained without EDTA is 8.13×10⁻³S·cm-1as measured by a four-point probe method.The better electrochemical properties of the sample A could be attributed to its smaller particle size and the less particle agglomeration.This is because the smaller particle size shortens the distance of the transport passage, and increases the conductivity of the sample.Therefore,electrochemical performance of LiFePO4/C material can be effectively improved by adding EDTA.
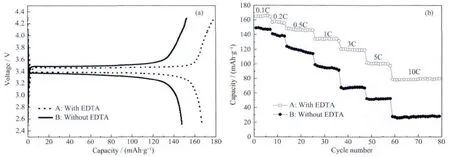
Fig.6 (a)Charge/discharge curves of A and sample B;(b)Rate performance of sample A and sample B
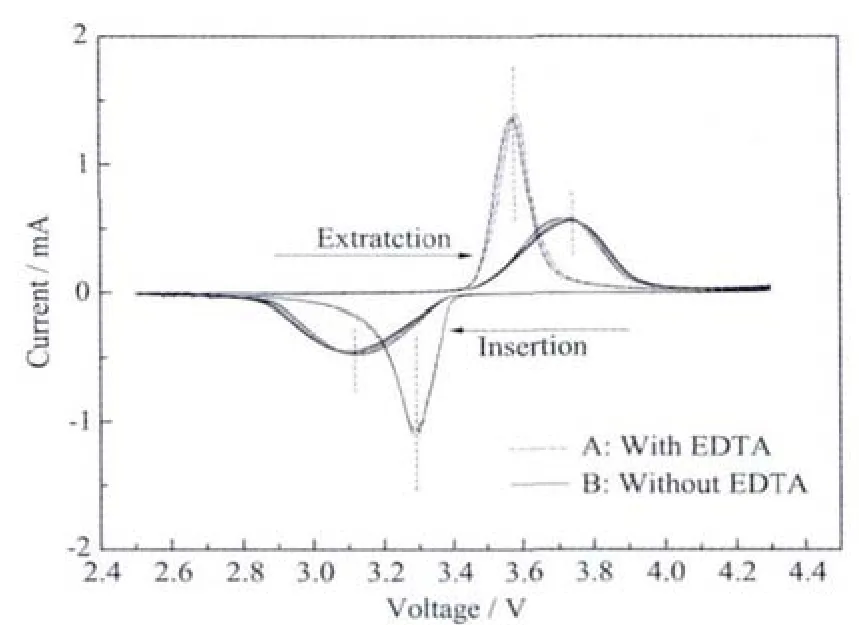
Fig.7 CV curves of sample A and sample B at a scan rate of 0.1 mV·s-1
The first five cyclic voltammogram curves of LiFePO4/C composite in the voltage range of 2.5~4.3 V at a constant scanning rate of 0.1 mV·s-1are shown in Fig.7.The voltage charge/discharge profiles of all five cycles are almost reduplicative,suggesting the good reversibility of lithium extraction/insertion reactions in the LiFePO4/C composites prepared through hydrothermal method.In the CV plots of LiFePO4cathode material,the higher and sharper current peaks and the smaller charge and discharge voltage plateaus difference imply better electrode reaction kinetics and better rate performance[23].The CV curves of sample A show more symmetrical and sharper shape of the anodic/cathodic peaks,which indicates an improvement in the kinetics of the lithium insertion/extraction at the electrode/electrolyte interface[22-23].In contrast,sample B electrode has lower peaks in CV curves.Furthermore,the higher peak voltage separation of sample B indicates that electrochemical kinetics could be strongly inhibited and that high polarization overpotential is present.Thus,sample A shows better electrochemical property.The result is in coincidence with the electrochemical measurements.
Fig.8 presents the Nyquist curves of the two samples and an equivalent circuit fitted by Zview2.0 program.An interceptatthe Zrealaxis in high frequency corresponds to the Ohmic resistance(RΩ),which represents the resistance of the electrolyte.The diameter ofthe semicircle on the Zrealaxis is approximately equal to the charge transfer resistance(Rct).The inclined line in the lowerfrequency represents the Warburg impedance, which is associated with lithium-ion diffusion in the LiFePO4particles[24].The lithium-ion diffusion coefficient(DLi)could be calculated using the formula 1[25].Formula 1:
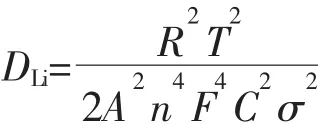
where R is the gas constant,T is the absolute temperature,A is the surface area of the cathode,n is the number of electrons per molecule during oxidization,F is the Faraday constant,C is the concentration of lithium ion (7.69 mol·L-1),and σ is the Warburg coefficient.The Warburg coefficient σ is calculated by the linear fitting result of Z′and ω-1/2from the EIS data.All the parameters obtained and calculated from EIS are shown in Table 1.It is obvious that the Rctdrastically decreases and lithium-ion diffusion coefficient increases for sample A.The reasons can be explained in terms of particle size,as reported previously[26],because smallparticle can shorten the distance of the transport distance.
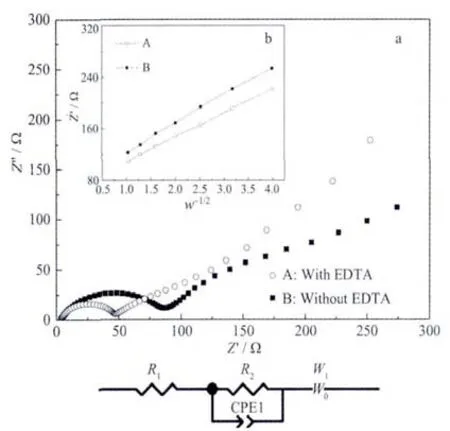
Fig.8 (a)Electrochemical impedance spectra of sample A and sample B;(b)Relationship plot between Z′and ω-1/2at low-frequency region

Table 1 Impedance parameters of LiFePO4/C cells(A with EDTA B without EDTA)
3 Conclusions
In summary,we propose a simple,quick and low costhydrothermalsynthesisroute to controlthe morphology of LiFePO4/C only by adding EDTA,rather than by changing the temperature,pH value,concentration or solvent.The prepared LiFePO4/C with EDTA presents a well-crystallized nanorod structure and coated with carbon layer of ~3.5 nm.The chelating role of EDTA group in the synthesis process is to greatly control the concentration of Fe2+,and to modulate the growth rate ofLiFePO4crystallite.Therefore,rod-like LiFePO4with reduced size is obtained, otherwise only irregular particles are prepared.Moreover,EDTA hasthe function of dispersive action and then restraints the sample′s aggregation.TheLiFePO4/C obtained with EDTA exhibits excellent reversible capacities at galvanostatic charge-discharge test.The specific discharge capacities have been reached 167,157,147,134,120,101,79 mAh·g-1at 0.1C,0.2C,0.5C,1C,3C,5C and 10C,respectively.The significantly improved electrochemical performances of the material could be attributed to the largerproportion ofnano-sized particles which is originated from EDTA as chelating agent and dispersing agent.
Acknowledgements:This work was supported by the Sichuan University Funds for Young Scientists(2011SCU11081),and the Research Fund for the Doctoral Program ofHigherEducation,the MinistryofEducation(20120181120103).
[1]Padhi A K,Nanjundaswamy K S,Goodenough J B.J.Electrochem.Soc.,1997,144(4):1188-1194
[2]Chung S Y,Chiang Y M.Electrochem.Solid-State Lett.,2003,6:A278-A281
[3]Srinivasan V,Newman J.J.Electrochem.Soc.,2004,151:A1517-A1529
[4]Chen Z H,Dahn J R.J.Electrochem.Soc.,2002,149:A1184-A1189
[5]Wilcox J D,Doeff M M,Marcinek M,et al.J.Electrochem.Soc.,2007,154:A389-A395
[6]WANG Xiao-Juan(王小娟),LI Xin-Hai(李新海),WANG Zhi-Xing(王志兴),et al.J.Funct.Mater.(Gongneng Cailiao),2009,40(12):1996-2003
[7]YU Hong-Ming(于红明),ZHENG Wei(郑威),CAO Gao-Shao(曹高劭),et al.Acta Phys.-Chim.Sin.(Wuli Huaxue Xuebao),2009,25(11):2186-2190
[8]XU Rui(徐瑞),ZHONG Ben-He(钟本和),GUO Xiao-Dong(郭孝东)et al.Chinese J.Inorg.Chem.(Wuji Huaxue Xuebao),2012,28(7):1506-1512
[9]TANG Hong(唐红),GUO Xiao-Dong(郭孝东),TANG Yan(唐艳),et al.Chinese J.Inorg.Chem.(Wuji Huaxue Xuebao),2012,28(4):809-814
[10]Teng F,Santhanagopalan S,Lemmens R,et al.Solid State Sci.,2010,12:952-955
[11]Lu Z G,Chen H L,Robert R,et al.Chem.Mater.,2011,23:2848-2859
[12]Rangappa D,Sone K,Kudo T,et al.J.Power Sources,2010,195:6167-6171
[13]Lee M H,Kim J Y,Song H K.Chem.Commun.,2010,46:6795-6797
[14]He L H,Zhao Z W,Liu X H,et al.Trans.Nonferrous Met.Soc.China,2012,22:1766-1770
[15]Saravanan K,Balaya P,Reddy M V,et al.Energy Environ.Sci.,2010,3:457-464
[16]Wang Z L,Su S R,Yu C Y,et al.J.Power Sources,2008,184:633-636
[17]Li C F,Hua N,Wang C Y,et al.J.Solid State Electrochem.,2011,15:1971-1976
[18]Zhu Z F,Du J,Li J Q,et al.Ceram.Int.,2012,38:4827-4834
[19]Ha J H,Muralidharan P,Kim D K.J.Alloys Compd.,2009,475:446-451
[20]Adldinger H K,Calnek B W.Archiv Für Die Gesamte Virusforschung,1971,34:391-395
[21]Lan Y C,Wang X D,Zhang J W,et al.Powder Technol.,2011,212:327-331
[22]Dimesso L,Spanheimer C,Jacke S,et al.J.Power Sources,2011,196:6729-6734
[23]Shin H C,Cho W I,Jang H.Electrochim.Acta,2006,52:1472-1476
[24]Yang K R,Deng Z H,Suo J S,J.Power Sources,2012,201:274-279
[25]Kwon S J,Kim C W,Jeong W T,et al.J.Power Sources,2004,137:93-99
