Study on the method of chaotic oscillator in we ak signal detection
2013-09-20GAOZhenbinLIUXiaozheZHENGNa
GAO Zhenbin,LIU Xiaozhe,ZHENG Na
(1.Information Engineering Institute,Hebei University of technology,Tianjin 300401,P.R.China;2.State Radio Monitoring Center,Beijing 100037,P.R.China)
1 Introduction
Weak signal detection technology is an emerging technology and an important part of modern information theory,which extracts the useful weak signal from the strong noise,based on the theory of modern electronics and signal processing methods.As one of the classic nonlinear dynamic systems,Duffing chaotic oscillator has potential application outlook in weak signal detection[1],because of the properties which are sensitive to certain signals and immune to noise at the same time.DONALD L B had the first attempt to detect weak signal by using chaotic oscillators in 1992[2],since then,the theory of chaotic oscillator was improved and devel-oped constantly.WANG Guanyu put forward a new frequency-locking principle based on the periodic characteristic of the intermittent chaos[3].LI Jian from Sichuan university proposed and proved a method of using a group of nonlinear differential equations to detect phase randomly distributed weak signal[4].WEI Jianxin from Tianjin university used an improved array of the oscillators to detect the weak signals of unknown frequency[5].NIE Chunyan from Jilin university presents a method to detect the frequency of the weak signal based on the optimization theory[6].
The above research proved the feasibility about using chaotic oscillator to detect the weak signal,and introduced the method of implementation.In this paper,we will have a further study on the performance of frequency detection,analyze the result which is under the influence of the sampling frequency,and measure the frequency of the signal with an initial phase.
2 Fundamental principles for using Duffing oscillator in signal frequency detection
2.1 Duffing chaotic oscillator

In this paper,the Holmes-Duffing chaotic oscillator is used for detecting the weak signal[7],the perturbed Duffing equation is:Where k is the ratio of damping,in this paper,we let k=0.5,γcos(t)is the periodic driving force and -x+x3is the nonlinear restoring force.
For the purpose of applying(1)to detect weak signals with different frequencies,we must do some frequency transformation.
Defining t=ωτ,and adding the input signal,we obtain
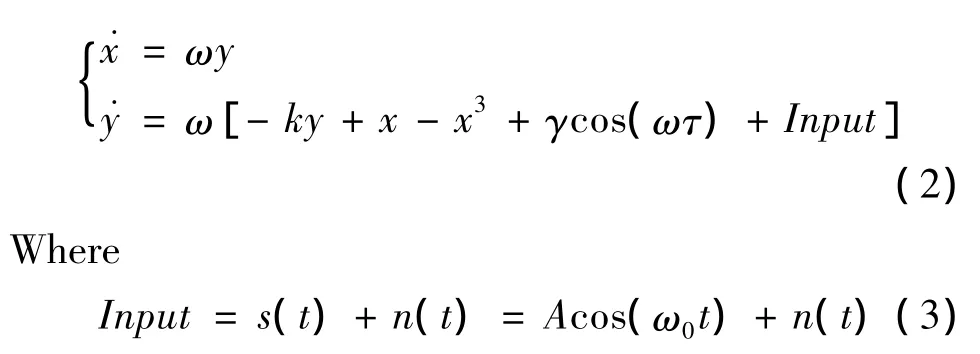
Here,n(t)is the Gaussian white noise.Since(2)is derived from(1),the system is seen on another time scale,and the dynamic properties and critical values are not changed.The difference consists in the running speed,for˙x and˙y are ω times as large as before.
We can perform frequency scanning by changing the value of ω in(2).
2.2 Principle of measuring the frequency of the sinusoidal signal
Through the research[8],it was found that the variance of the output variable x of the Duffing system is different when the system is in chaotic state and periodic state,and it happens with enough regularity:when the periodic driving force frequency is equal to the signal frequency,the system output variance will reach a maximum,and when the periodic driving force frequency is greater or less than the signal frequency,the system output variance will be less than the one when the frequency are equal to each other,as Fig.1 shown.According to this nature,we can use the method of searching for the maximum variance by computer programming.By changing the periodic driving force frequency,the weak signal with different frequencies can be measured,that is,the corresponding frequency of the maximum variance is the signal frequency to be measured.
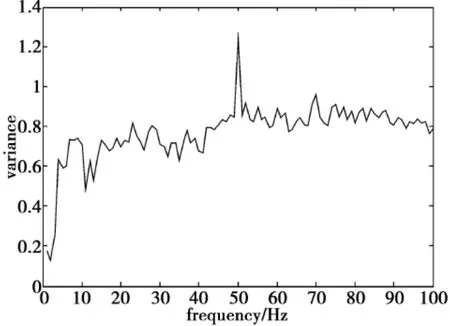
Fig.1 Variance corresponding to different reference frequency
In the above theory,the initial phase of the periodic driving force and the external signal is zero.In this paper,we measure the weak signal frequency based on the above theory,analysis how the sampling frequency influences the accuracy rate at certain signal to noise ratio,and in order to detect the signal frequency in lower signal to noise ratio,we have a research on the demand for the sampling frequency,moreover,for the signal which has a random initial phase,we also have a further research on its frequency measuring and applying.
3 Analysis of the detection performance

Equation(4)is the Duffing chaotic oscillator which detect the weak signal under the Gaussian white noise environment.And ω =2πf(f is the frequency of the reference signal),Acos(ω0t)is the weak signal to be detected and ω0=2πf0(f0is the signal frequency).n(t)is the Gaussian white noise.In this paper,MATLAB software is used to build the mathematical models.In the simulation,we choose the fourth-order Runge-Kutta algorithm to solve the Duffing equation and the integration step is equal to the sampling period(1/fs).
3.1 Influence of sampling frequency on the accuracy rate
Through experiments,it is found that under certain conditions,when using the above theory to detect the signal frequency,the result will have an error due to the existence of the random noise.The procedure of analyzing the accuracy rate under the influence of sampling frequency is described as follows.
Step 1 Switch γ = γc=0.82(γcrefers to the critical value),and the system is put into the critical state(chaos,but on the verge of changing to the periodic motion).
Step 2 A weak sinusoidal signal buried in the intense noise environment with A=0.02,f0=50 Hz,is fed into the chaotic oscillator.
Step 3 Set the range of f from 30 Hz to 70 Hz and the step size fstep=0.5 Hz.The same number of the simulation cycles is P=N/f corresponding to different f,in this experiment,set N=60.
Step 4 Calculate the variance of the output variable x corresponding to the reference signal with different f,the frequency corresponding to the maximal variance is f'0.
Step 5 Repeat the above steps for 100 times,and calculate the times when f'0=f0,then the latter divided by the former is the accuracy rate.
Tab.1 illustrates the relation between fsand the accuracy rate under the condition of signal to noise ratio SNR= -20 dB and SNR= -25 dB respectively.

Tab.1 Relation between the sampling frequency and the accuracy rate
It can be seen from Tab.1 that under the condition of SNR= -20 dB,as fsincreased from 1 500 Hz to 3 000 Hz,the accuracy rate is improved,even reach to 100%,and in the lower signal to noise ratio SNR=-25 dB,when fsincreased to 6 000 Hz,the accuracy rate can also reach a high level of 98%.
Numerical results have indicated that when the frequency of a signal buried in noise is to be detected,we can improve the accuracy rate by the method of increase fsappropriately.
3.2 Influence of sampling frequency on signal to noise ratio threshold
From the above experiment,comparing the results under the condition of SNR= -20 dB and -25 dB,we can also infer that the signal frequency can be detect in lower SNR by increasing sampling frequency fsso,in this section we will analyze the relation between fsand SNR threshold.
In this simulation experiment,the frequency of a sinusoidal signal with A=0.02,f0=50 Hz is detected under the condition of SNR=-40 dB to-20 dB(the step size is -5 dB).And set the range of reference frequency f from 30 Hz to 70 Hz,the step size fstep=0.2 Hz.Comparing to different f,the same number of simulation cycles is P=N/f and N=50.The below Fig.2 is corresponding diagram on SNR threshold-sampling frequency whose accuracy rate achieved to 95%.
As Fig.2 indicates,in order to detect the signal frequency in lower SNR,it is necessary to increase fs,and the lower SNR is,the greater the increase rate of fs.In addition,for the further research,it is found that we can also successfully find out the signal frequency under lower signal to noise ratio-45 dB by increasing sampling frequency to fs=600 kHz and the simulation cycles to N=100.

Fig.2 Relation between SNR threshold and sampling frequency
Through the simulation experiment,it can be seen the advantage of Duffing chaotic oscillator in weak signal detecting.But with the signal to noise ratio reduced,the noise intensity is increased,although we can increase the sampling frequency and simulation cycles to a certain degree to detect the signal,the run time of the computer is corresponding extended.
4 Measuring the frequency of a signal with initial phase
For the signal which has a phase difference with the periodic driving force,we have a further research on its frequency detected.
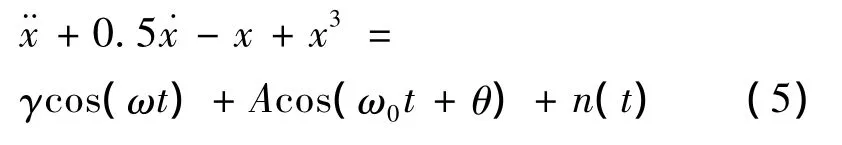
A signal with an initial phase θ is fed into the chaotic oscillator,as(5)shows.And n(t)is the Gaussian white noise.Through a mass of experiments,it can be seen that the output variance still has a dramatic change when f=f0.The following experiments are based on this property.
4.1 MATLAB simulation experiments
Two sinusoidal signals with different frequency and random phase are detected respectively in the following experiments to verify this theory.In MATLAB simulation,first let γ = γ0=0.82,the system is in the state of critical,then the weak signal with A=0.02 under a-25 dB signal to noise ratio is merged into the system,and set the signal initial phase θ=2π ×rand(1).
When the signal frequency f0=500 Hz,set the range of the reference frequency f from 1 Hz to 1 kHz,the frequency step fstep=1 Hz,and the sampling frequency fs=30 kHz,set the simulation cycles N=80,The corresponding diagram of frequency-variance is shown in Fig.3.

Fig.3 Variance corresponding to different reference frequency and f0=500 Hz

Fig.4 Variance different of the moved window
In order to see the change of the variance clearly,we have a further processing on the above results.A window with the length of five frequency step is uxed,reference frequency,and it is moved from f=1 Hz to f=1 000 Hz with the unit of its length.Calculate the difference of the maximum variance and the minimum variance of the moved window,the processed result is shown in Fig.4.
Combining Fig.4 with Fig.3,it can be seen that the output variance has the greatest change when f=f0=500 Hz.
When the signal frequency f0=500 kHz,set the range of reference frequency f from 400 kHz to 600 kHz,the frequency step fstep=500 Hz,and fs=60 MHz,set the simulation cycles N=80,the results show in Fig.5,and Fig.6 is the processed results,the length of the window is five frequency steps.

Fig.5 Variance corresponding to different reference frequency and f0=500 MHz

Fig.6 Variance difference of the moved window
Combining Fig.6 with Fig.5,it is found that when f=f0=500 kHz,the output variance appears the greatest change.
Through the above experiments which detect the signal with an initial phase in different frequency range,it can be seen that the output variance has a dramatic change when f=f0,we can obtain the signal frequency by this change.
4.2 Processing the signal produced by signal generator
An amplitude-modulated(AM)signal is produced by signal generator with f0=30 MHz,the power of the signal is-70 dBW.Since there is a frequency difference between the AM signal and the local signal produced by the receiver oscillator,the output of the receiver will have a signal whose frequency is equal to the frequency difference.We can conclude whether a weak radio signal of the receipt signal exists or not by detecting that signal.
Set the lower limit of the reference frequency f1=10 Hz,and the upper limit f2=20 Hz,the frequency step fstep=0.02 Hz,then detect the signal under the condition of signal to noise ratio SNR= -30 dB,which is the output of the receiver,The Fig.7 shows the corresponding diagram on frequency-variance.
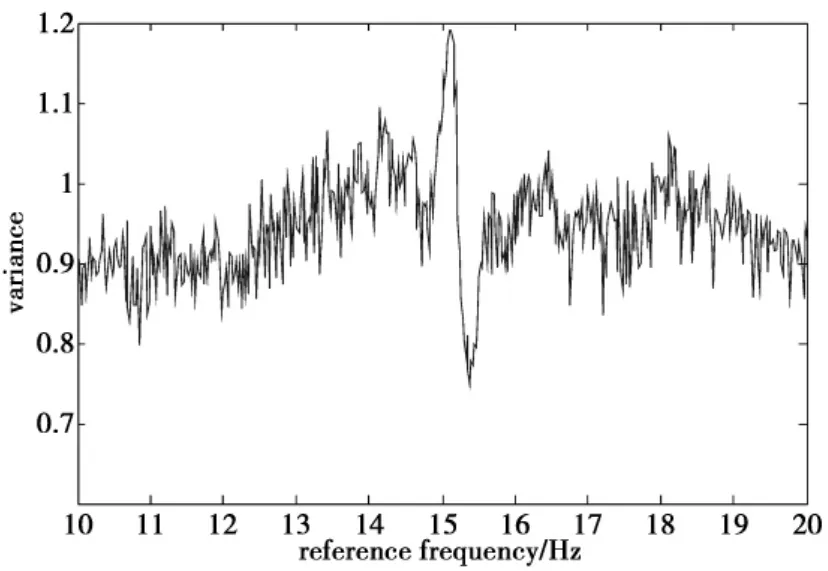
Fig.7 Variance corresponding to different reference frequency
As Fig.7 shows,it can be seen that near the reference frequency f=15 Hz,there appears the greatest change in the output variance,with a maximum value and a minimum value.According to the results,we can conclude that there is a weak radio signal existing in the receipt signal,and the frequency of which is approximately 15 Hz different from the local oscillator signal.
5 Conclusions
In this paper,the frequency of a weak sinusoidal signal buried in the noise is measured on the basis of the theory that the output variance will reach a maximum when the reference frequency is equal to the signal frequency.
We have analyzed the results which are under the influence of the sampling frequency.Through the simulation experiments,we can obtain that by increasing the sampling frequency to a certain degree,the accuracy rate of the result will be improved and the signal to noise ratio threshold is reduced,in the meanwhile,if we increase the simulation cycles,the signal to noise ratio will be lower,in this article,we successfully detect the signal under the condition of SNR= -45 dB.
For the signal with initial phase,it was testified that the output variance still has a dramatic change when the reference frequency is equal to the signal frequency.And this property was applied to detecting the frequency of an AM signal produced by the signal generator.
[1]WANG Guangrui.Contrl,synchronous and the use of chaotic[M].Beijing:National Defense Industry Press,2001:23-26.
[2]DONALD L B.Chaotic oscillators and CMFFNS for signal detection in noise environments[C]//In Proceedings of IEEE International Joint Conference on Neural Networks.[s.l.]:Conference Publications,1992(2):881-888.
[3]WANG Guanyu.The Application of oscillators to weak signal detection[J].IEEE Trans on Industrial Electronics,1999,46(2):440-444.
[4]LI Jian,HE Kun,XIAO Qiang,et al.Detection of a weak signal by using chaotic systems[J].Journal of Sichuan University:Natural science edition,2004,41(6):1180-1183.
[5]WEI Xinjian.Detecting weak signal based on the duffing chaotic oscillator[D].Tianjin:Tianjin University,2010.
[6]NIE Chunyan.Research on the weak signal detection method based on the chaos theory and specific chaotic system[D].Changchun:Jilin Univerity,2006.
[7]LI Yue,YANG Baojun,SHI Yaowu,et al.The application of the chaotic oscillator to weak sine signal detection in strong noise based[J].Acta scientiarum naturalium universitatis jilinensis,2001(1):5-77.
[8]CUI Qin.Weak signal detection based on chaos theory[D].Harbin:Harbin Engineering University,2008.