Zea mays(L.) P1 locus for cob glume color identified as a post-domestication selection target with an effect ontemperate maize genomes
2013-03-13ChunxioXieJinfengWengWenguoLiuChengZouZhunfngHoWenxueLiMinshunLiXiosenGuoGengyunZhngYunbiXuXinhiLiShihungZhng
Chunxio Xie,Jinfeng Weng,Wenguo Liu,Cheng Zou,Zhunfng Ho,Wenxue Li,Minshun Li,Xiosen Guo,Gengyun Zhng,Yunbi Xu,b,Xinhi Li,*,Shihung Zhng,*
aInstitute of Crop Science,Chinese Academy of Agricultural Sciences/The National Key Facility for Crop Gene Resources and Genetic Improvement,Beijing 100081,China
b International Maize and Wheat Improvement Center(CIMMYT),Mexico,D.F.06600,Mexico
1.Introduction
Maize (Zea mays L.) is one of the most important crops for producing grain,starch,feedstuffs,and silage with the second largest harvested area(~163 Mha in 2010)in the world[1].As a crop,maize was subjected to artificial selection during domestication [2–4] with subsequent episodes of post-domestication selection or improvement [5] and innovative agronomic practices.Strong selection pressure directed at genes controlling traits of agronomic importance shapes genetic variation that is available to modern breeders as it affects genome-wide nucleotide diversity and patterns of linkage disequilibrium(LD)[6].Thus,the variation can be optimized and the direction of recombination enhanced via evolutionary analyses using genomics information to exploit the variation acted on by artificial selection [6].Human selection of maize has largely focused on grain since its early domestication.Therefore,a number of genes associated with maize ears,including those for kernel color (c1 [7] and y1 [8]),and kernel composition (bt2 and su1 [9],su1 [10],sh2 [11]),were analyzed for the effects of their association with selection[3].
The maize P locus is involved in the synthesis of a red flavonoid pigment in cobs,in the kernel pericarp,and in other floral tissues[12].Gene P1,encoding a Myb transcription factor[13–15],confers different color phenotypes on pericarp and cob glumes through different epigenetic alleles or forms [14–19].A sharp probability peak (highest,P = 10-17) in a mapping study was found to coincide with the known location of P1(Fengler K,personal communication in reference[20]).QTL mapping based on a number of populations developed by crossing two functional,but distinct,P alleles has identified a QTL in bin 1.03 [21].It had also been an important model for gene expression regulation since the early days of modern genetics[22].Other findings suggested that the P locus is a complex locus with different copy-number variants in a tandem repeat pattern and regulated by methylation [12,13].Candidate gene association was conducted to verify that P1 was associated with pericarp,cob,and silk pigmentation in 76 maize lines[23].In addition,P1 was suggested to be tightly linked with a chromosomal region that is important for controlling yield in those source populations [24].Later work demonstrated that selection for cob color had effects on several other traits including grain yield in different genetic backgrounds [25].It was suggested that some maize color components were less preferred,by or more toxic,to caterpillars such as Helicoverpa zea (Boddie) and sap beetles such as Carpophilus lugubris [26],which are major pests of maize during kernel storage.All this information suggests that cob glume color might be a trait under selection or a result of selection during breeding and consumer preference during the post-domestication period.
In summary,genetic and genomic changes might have resulted in lower diversity due to selection during domestication and breeding where selection was strong.Meanwhile,genomic data from 27 diverse maize inbred lines showed that the genome consists of highly divergent haplotypes with 10-to 30-fold variations in recombination rates [27].This reinforces the concept that maize is a highly polymorphic species.However,it also shows that there are often large genomic regions that have little or no variation [28].Much valuable information likely underlies the genome signature due to selection that can be exploited for breeding.The objectives of this study were to (i) confirm the genetic locus for cob glume color using a genome wide association study(GWAS)with high resolution SNPs,(ii) reveal the genome pattern surrounding it,and(iii)find evidence of the effects of selection across the target region.The results reported here may provide insights as to the manner by which breeding efforts have affected and will affect genome evolution.
2.Materials and methods
2.1.Plant materials and phenotyping of cob glume color
A set of 283 diverse inbred lines,representing the modern temperate maize elite inbred lines in China[29,30],was used for genotyping with 55,000 SNPs and GWAS.Forty of the lines from this association panel and 47 tropical lines with white cob glumes were re-sequenced 10× through an international collaboration(Xu et al.,in preparation).These plant materials were grown in Sanya,Hainan province (18°45°N,109°30°E),during the winter of 2011–2012.Each line was planted in a plot with 20 plants in a 4.5 m row with 0.6 m spacing between rows.Normal agronomic practices were used in field management.After harvest,cob glume color was scored for each line as “0” for white and “1” for other colors.The scores were used for GWAS.
2.2.SNP calling and genome resequencing
Based on the B73 reference sequence,56,110 evenly spaced SNPs were featured on the MaizeSNP50 BeadChip (Illumina,Inc.).These were selected from several public and private sources and included 984 negative controls.DNA was extracted from the 283 temperate lines by a modified CTAB procedure[31].Before genotyping,each DNA sample was evaluated using gel-electrophoresis and spectrophotometry (NanoDrop 2000,Thermo Scientific).As controls,four lines (Qi 319,Huangzao 4,Ye 478 and Dan 340)were added to each of the six independent BeadChips.SNP genotyping was performed using the MaizeSNP50 BeadChip by Emei Tongde (Beijing,China).SNP calling for the 283 samples was implemented according to the Infinium HD Assay Ultra Protocol Guide (Illumina,Inc.).After filtering out monomorphic and non-specific SNPs,a subset of 44,235 SNPs with known physical positions was generated,with an average heterozygosity of 0.5%.Within the four controls,the mean reproducibility between replicates across all data points was 99.9%,which is consistent with high-quality data for replicates of the B73 maize line using the same chip(Illumina,Inc.).The error rate(ER)for genotyping was 0.0353%.
The whole genomes of the 87 accessions were obtained with a mean (Poisson-distributed) sequencing depth of 10×per individual.The Site Frequency Spectrum (SFS) was estimated by an empirical Bayesian approach.Allele frequencies for each site were calculated from the raw sequencing reads for estimating Minor Allele Frequency(MAF).Then,with the genotype likelihood information and site allele frequency,the sample allele frequency was estimated using a dynamic programming algorithm with the program realSFS (BGI,Shenzhen,Guangdong,China).SNP calling proceeded in a probabilistic fashion by choosing a cut-off for posteriori probability (≥0.99) [32].Only the data from the targeted maize genomic region within the LD block (Table 1 and Fig.1)were selected for analysis in this study.
2.3.Genome-wide association mapping
Population structure and kinship information for the 283 lines were generated using software STRUCTURE version 2.3 [33]and SPAGeDi with 5000 SNPs (MAF ≥0.2),respectively.SNPs with MAF above 0.05 were collected for GWAS using a general linear model(GLM)and a mixed linear model(MLM)in TASSEL version 3.0 [34].The original sequences of SNP regions were used for BLAST comparisons with the MaizeGDB (B73 RefGen_v2)to update the physical positions.
2.4.Bonferroni thresholds
The thresholds for association detection were set using a Bonferroni correction.For testing n dependent or independent hypotheses,one way to maintain the family-wise error rate is to test each hypothesis at a statistical significance level of 1/n times what it would be if only one hypothesis was tested.Our setting for this probability is to equal α,and the significance level for the entire series of tests would be β = α/n,where n,the marker number,was 44,236.Therefore,when we set α levels at 0.1,0.05,0.01,0.005 and 0.001,a set of β (α/n) and the corresponding Bonferroni thresholds(-log10β)were calculated.
2.5.Linkage disequilibrium
The square of the correlation coefficient(R2)and D between two alleles were calculated to measure LD with the described algorithm [35] in two independent analyses with different genotyping systems (maizeSNP50 on a 283 temperate-line GWAS panel and 87 10-fold resequencing lines).TASSEL software version 3.0 was used to measure LD level in the temperate GWAS association panel based on the maizeSNP50 genotyping system.The LD analysis window size was set to 50 markers.To view the structure of LD,the view window was moved to show the region of interest in the center of the window.HaploView V4.2 was used to calculate the LD level in both temperate and tropical resequencing lines.The parameters were set as-dprime-minMAF 0.01-hwcutoff 0.001-maxdistance 200-minGeno 0.6.Markers with a Hardy–Weinberg P-value less than the cutoff set by the hwcutoff option were identified,and all markers with MAF below the cutoff were excluded from further analysis.
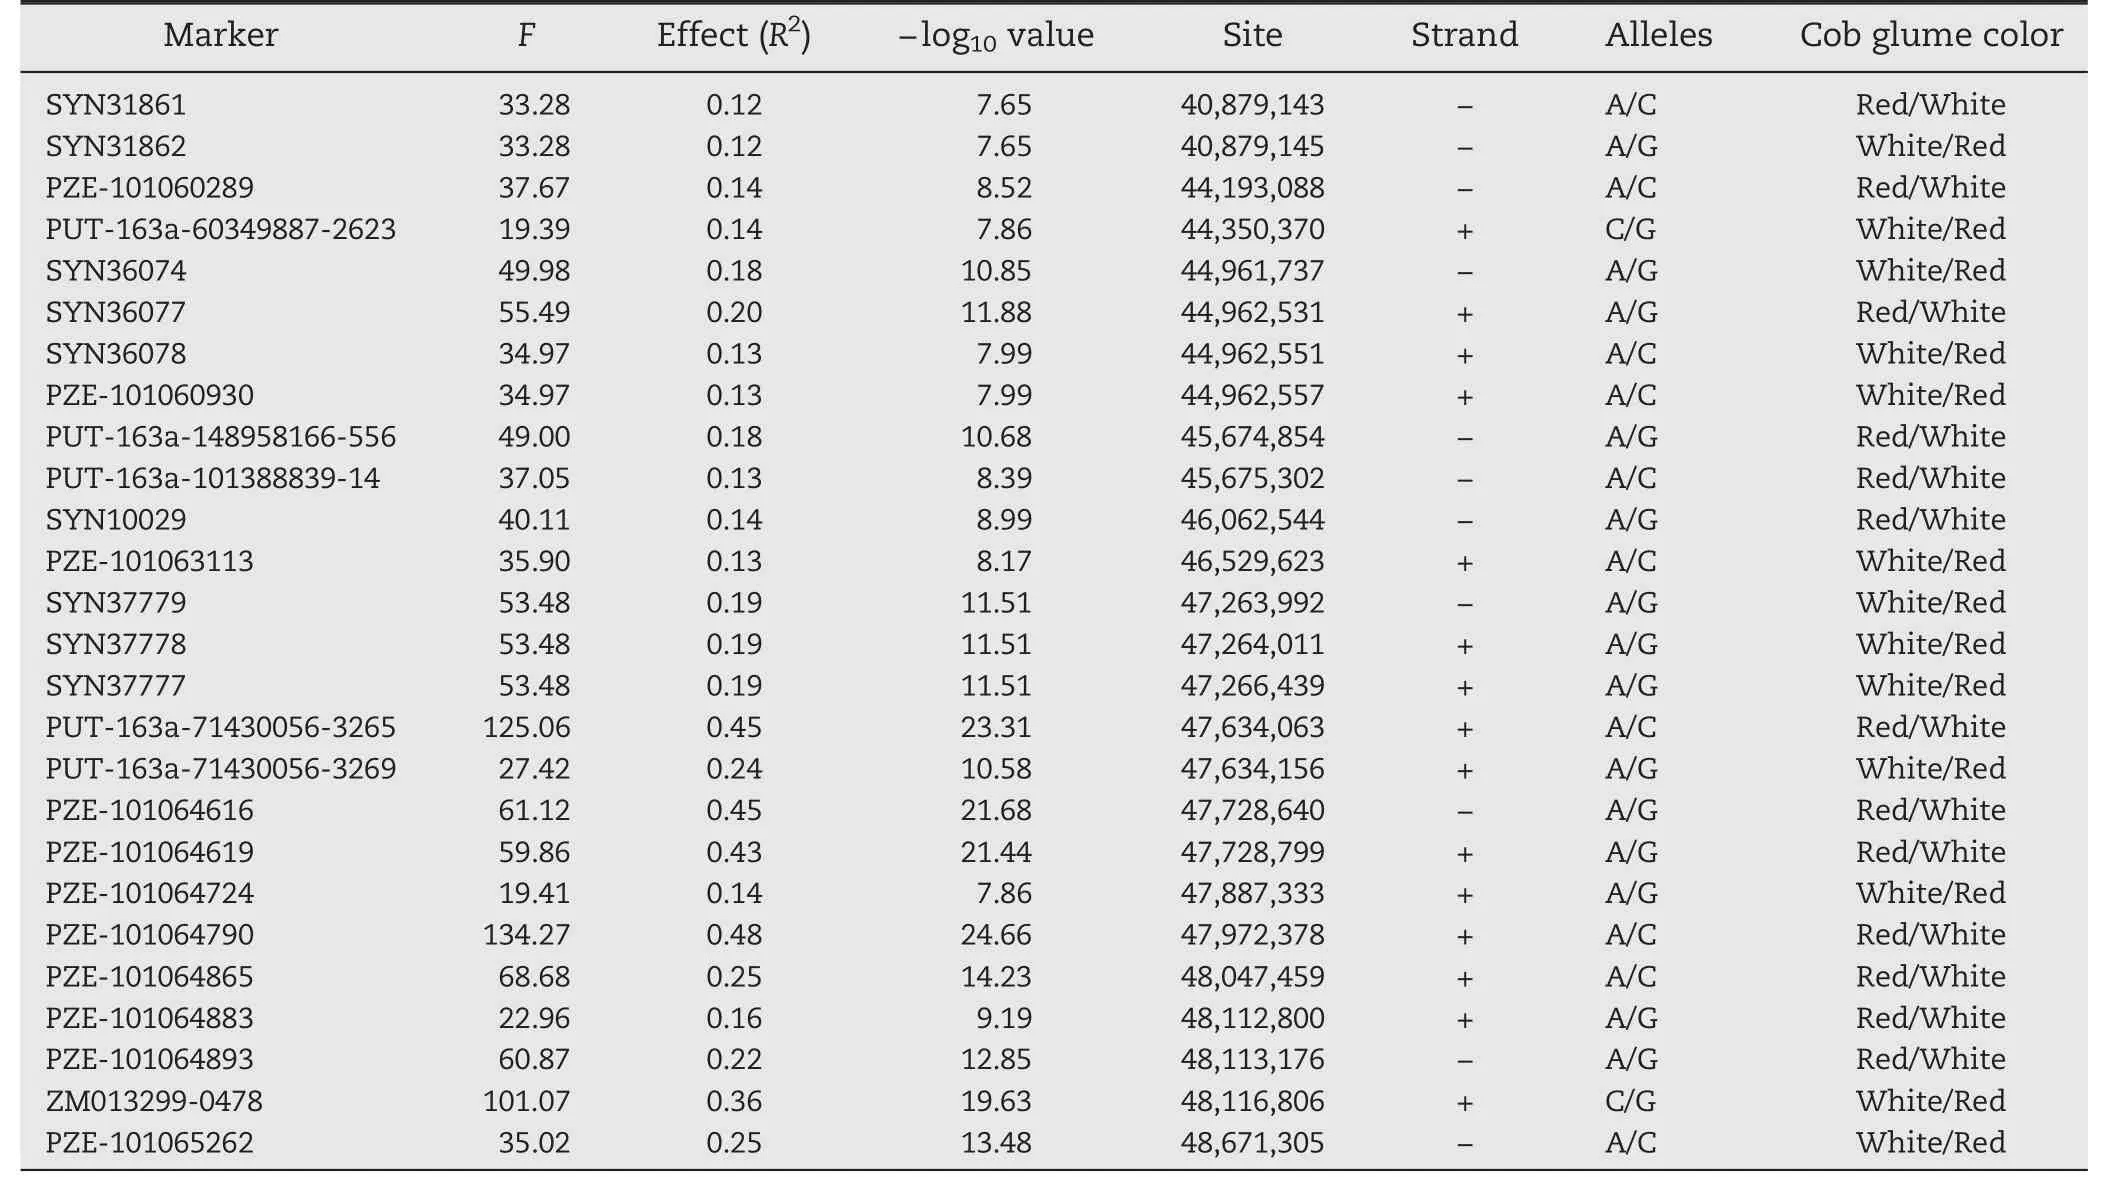
Table 1-Identified markers surrounding the P1 locus associated with cob glume color in 283 temperate lines by GWAS.

Fig.1-Genome-wide-log10 P plot from association analysis of cob glume color that identified SNPs for cob glume color on maize chromosome 1S and strongly associated with the maize P1 locus.(A)The whole genome,(B)chromosome 1,and(C)the target region.The red dot is ZM013299-0478,located within the P1 gene.
2.6.π-and Tajima's D-value estimated for 283 temperate lines
The π-and Tajima's D-values for the 283 temperate lines were also calculated using software package tools provided by TASSEL 3.0.The Sliding-Window was set as 500 with a step of 50 markers.Only the markers within chromosome 1 were filtered for analysis at the entire chromosome level.
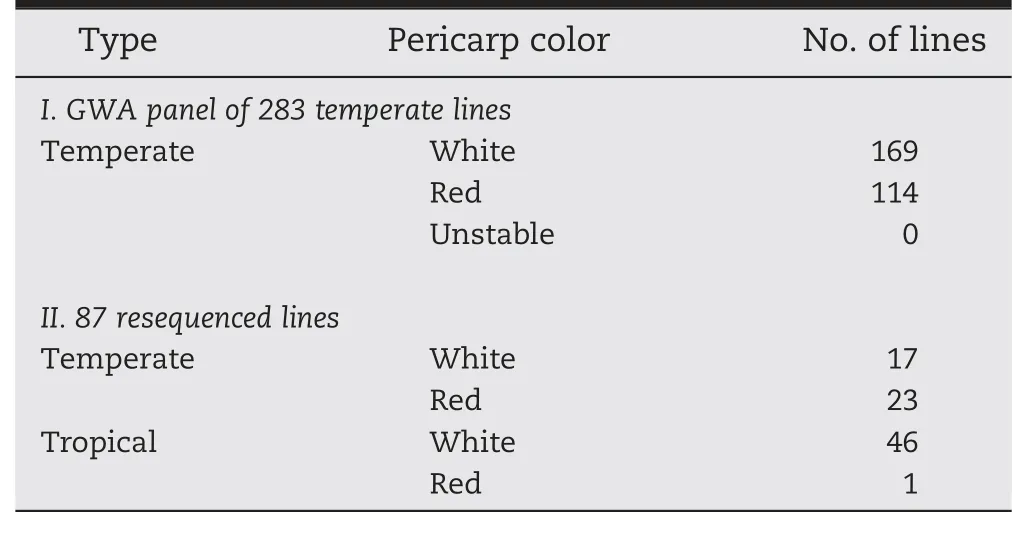
Table 2-Summary of phenotypes used for GWAS of the temperate panel(283 diverse lines)and 87 resequenced lines across two years.
3.Results
3.1.Phenotypic variability for cob glume color
Cob glume and pericarp color data were collected over two years for use in the temperate association mapping panel developed for GWAS,and for the resequenced inbreds(Table 2).Among the temperate lines in the GWAS panel,114 had stable red cobs and 169 lines had white cobs.Among the 87 resequenced lines,over half of the temperate lines were the same as GWA panel lines showing stable red cob color(Table 2).Most of the resequenced tropical lines had both white cob and white pericarp colors.One line had a red cob and white pericarp.Pericarp color,which is also associated with the P1 gene,did not show discriminative tendency between different groups among all maize lines,as most of them were white.About half of the temperate maize lines had red cobs,and very few had red pericarp,while the tropical maize accessions were mainly white for cob glume,pericarp and endosperm[36].
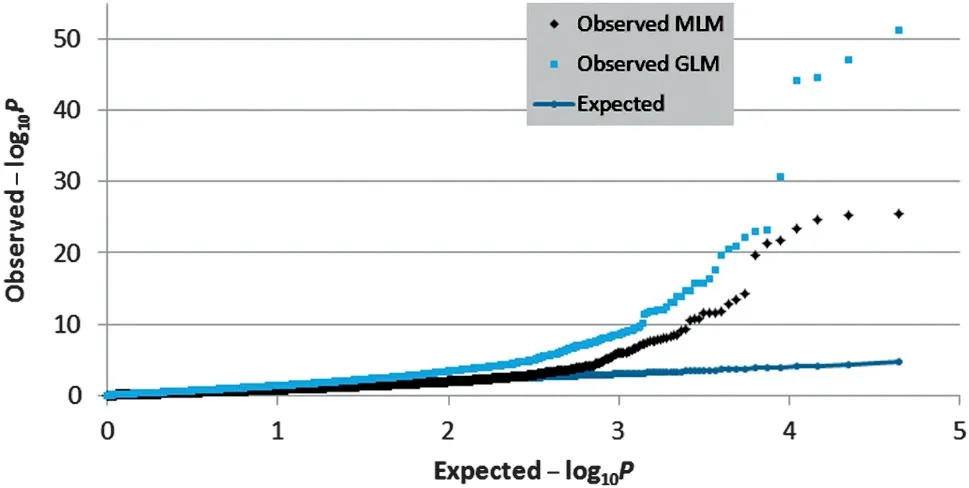
Fig.2-Quantile-quantile plots of observed MLM(black diamonds) and GLM models(blue rectangles) versus expected(blue dot line)-log10 P values from association analysis.
3.2.GWAS identifies P1 locus among temperate panel through MLM approach
A mixed linear model (MLM) for GWAS identified locus P1 on chromosome 1S (Fig.1-A,B) surrounded by a dense set of 26 markers (Table 1) showing strong association with cob glume color at a stringent Bonferroni threshold(α <0.001,n = 44,235).The-log10P values for these markers were as high as 24.66,much higher than the threshold.All the markers along with their F-values,genetic effects,physical positions,and binary alleles corresponding to the phenotype are listed in Table 1.BLAST analysis of the surrounding sequence of our identified marker within the P1 gene against the maize genome sequence at maizesequence.org[37]also identified the same location on chromosome 1S.The SNP marker,ZM013299-0478,which is located within the P1 gene,was also significantly associated with cob and pericarp color(Fig.1-C).Bioinformatics analysis of the region strongly associated with cob and pericarp color variation identified a tandem repeat pattern of Myb genes at,and upstream of,the P1 gene.This result is consistent with past genetic evidence that different copy numbers and structural variants of this Myb gene at the P1 locus confer tissue-specific colors[19].Thus,our results strongly indicate that the genomic segment identified as a strong association region should be the P1 locus.

Fig.3-Comparison of genomic regions associated with cob glume color identified by general GLM or MLM models under Bonferroni thresholds at different α levels.
3.3.Quantile–quantile plots of applied models and their comparison
To identify the genetic locus associated with cob glume color,genome-wide SNP markers were analyzed using both MLM and GLM (general linear model).Compared with GLM (Q),the compressed MLM approach,which also took kinship (K),or genome-wide patterns of genetic relatedness,into account,reduced false positives,as shown in quantile–quantile plots(Fig.2).The results showed that both models can be applied in this analysis.At different Bonferroni thresholds and α levels,the markers identified by MLM spanned a much narrower region,or achieved higher mapping resolution,compared with the GLM approach.At α <0.05,an 11 Mb (megabase)region was identified using GLM,whereas a 0.78 Mb region was identified by MLM.However,the mapping resolution was not improved beyond α <0.05 by MLM with an increased threshold(Fig.3).
3.4.Linkage disequilibrium(LD)and LD decay revealed by the temperate GWAS panel
All of the markers identified with a strong association with cob and pericarp color phenotypes in this study were located within a region of 0.78 Mb,~0.73 Mb upstream and ~0.05 Mb downstream of the P1 gene.Among the identified markers,a significant positive correlation between associations (-log10P)with these traits and genetic effects (R2) on these traits was found.The strongest association and the highest genetic effect were found at marker PZE-101064790,which is located upstream of the P1 gene.The distance from P1 and the surrounding sequence showed that PZE-101064790 is located within the P1 enhancer,which plays a key role in regulating P1 gene expression and conferring its tissue-specific pattern [15,16].The identified locus and associated markers might be the best targets for potential regulation of cob glume color and also good targets for developing marker-assisted selection tools.
Regional LD and the LD decay pattern were analyzed.For the temperate GWAS panel,a clear LD block with a set of markers surrounding the P1 locus was found.It is located at the P1 gene and includes 22 markers upstream (box shown in Fig.4) and four markers downstream of the gene(Fig.4).LD decay of the P1 locus and its adjacent region was very rapid.The R2value decreased from 0.83 to 0.30 within this 14 kb region.Outside the target region of the LD block,the P-values increased rapidly to a pattern similar to that of the genomic background.

Fig.4-Regional LD distribution and blocks of the P1 gene locus in diverse temperate maize inbreds(n = 283).The association panel consisted of 283 diverse temperate lines;LD window size = 50;above diagonal,R squares;and below diagonal,P-values.
3.5.High-resolution comparison of LD in the region flanking ZM013299-0478 among resequenced tropical and temperate maize lines
To compare LD at the target region between temperate maize and tropical maize and to analyze regional LD at better resolution,10-fold deep sequencing at the target region was performed on 87 lines,which included 40 temperate lines that overlap with the 283 lines in the temperate GWAS panel and 47 tropical lines with white cob glume color (Table 2).Marker density increased from ~45 kb/marker for the GWAS panel genotyped via maize SNP50 to ~207–271 bp/marker by deep sequencing.A number of markers within the significant LD region were found upstream of P1 in the temperate maize lines (Fig.5).Among those markers,two clear and novel structured LD blocks were found in the temperate maize lines,but not in the tropical maize lines.In addition,a new LD block was found downstream of the P1 locus only in the tropical maize lines.These results suggest that the accuracy of LD analysis can be improved,and when marker density increased,more specific information around the locus useful for positional cloning and functional identification of genes was revealed.

Fig.5-High-resolution comparison of LD within the target region flanking ZM013299-0478 between resequenced tropical(n = 47)and temperate(n = 40)maize lines.Blue triangles:distal upstream enhancer regions associated with gene expression possibly regulated by epigenetic modification(cytosine methylation);black triangles:coding region and immediate upstream region of P1;red triangles:LD.
3.6.P1 locus showed lower diversity and an artificial selection effect
To study the effects of genetic diversity and artificial selection involved in the development of inbred lines,the markers spanning chromosome 1 were analyzed for genetic diversity among the temperate GWAS lines.Both π-and Tajima's D-values showed lower values in the P1 region compared to the entire chromosome 1.Pairwise t-tests of polymorphism between 10 50-marker windows containing the P1 locus and the 10 50-marker windows in adjacent upstream and downstream regions identified different π-and Tajima's-D values at a high significance level (P <0.001,Table 3).These results indicated that the level of diversity at the P1 locus was quite low.It also reveals that this region evolved by non-neutral mutations,suggesting a strong effect of artificial selection.
4.Discussion
4.1.Selection of cob glume color during post-domestication
Selection for specific alleles of genes that influence important agronomic traits takes place during domestication and improvement of crops,and reduces the diversity of these genes in selected populations compared to unselected ones[38].Typically,domestication genes show reduced allelic diversity among both ancient and modern varieties,whereas crop improvement may reduce the specific allele frequencies in selected varieties[39].Many alleles and structural variants of P1 with tissue-specific expression patterns exist; these confer diversity in cob glume color phenotype[12–19,22].This suggests that P1 is less likely to be a domestication event than an improvement event as a result of selection during modern breeding after domestication.This hypothesis is supported by the fact that distinct allele frequency differences were identified among maize groups [30] created by breeding and commercialization activities.
4.2.Selection for cob glume color has occurred only during development of temperate maize varieties
The samples used in this study were collected randomly without selection for color,and thus the phenotypic distribution observed here could reflect the color distribution in natural maize populations.Previous recurrent selection activities during maize breeding demonstrated that selection on cob color had greatly influenced several traits including grain yield in different genetic backgrounds [25].Empirical explanations from experienced maize breeders indicated that red cob glume seemed to be correlated with better cob hardness,a desirable trait for mechanical or manual threshing,and associated with resistance to mold during whole ear storage; however,no substantiating evidence is reported.This partially explains breeders' and farmers' preference for selection of red cobs in the temperate maize zone in China.Therefore,the response of the genome to selection for cob glume color should be evaluated based on the selection for cob color per se and its side effects on selection for grain yield.Compared with temperate lines,tropical lines have a much higher level of genetic diversity[40–43].However,tropical maize and its original landraces and open-pollinated varieties(OPV) were subjected to lower selection pressure [41] due to a shorter history of hybrid breeding,compared with that for breeding temperate maize in the U.S.and China.Although the genetic and phenotypic diversity of tropical maize at CIMMYT is high,because white corn with white cob glumes had traditionally been used as food in Mexico,selection for cob color had not taken place during post-domestication breeding of tropical maize in that region,as evident in the tropical maize lines used in this study.Therefore,the effect of selection for cob color on the maize genome can only be evaluated among temperate elite lines,among which there has been selection for cob glume color during line development and hybrid commercialization.

Table 3-Pairwise t-test for π and Tajima's D values between 10 windows within the P1 locus and 10 upstream and 10 downstream windows.
4.3.A tandem array of Myb genes at the P1 locus
Previous findings from traditional genetics and Southern blotting analysis suggested that the P1 locus was complex,with different copies of variants in a tandem repeat pattern,and regulated by methylation [12–17,19].A tandem array of Myb genes was identified from annotation of all genes in the genomic region surrounding the P1 locus.Our results provide further evidence to support the P1 association mapping result because we not only found the P1 gene within the region,but also identified the upstream pattern of this complex locus,which is consistent with the results from previous studies[12–17,19].The genes,GRMZM2G129872,GRMZM2G016020,GRMZM2G335358,GRMZM2G057027,GRMZM2G064597 and GRMZM2G084799,were all annotated in maizesequence.org as P protein and located within the P1 locus upstream of the P1 gene with a tandem pattern on minus strands using stringent criteria with a filtered gene set from the B73 genome[28].The presence of these Myb repeats strongly implies complex regulation of the locus.However,this paper does not present further experimental evidence to reveal the biological and regulatory functions of the repeat units.
4.4.GWAS as a tool for understanding post-domestication selection that facilitates genomic selection in breeding
Because artificial selection also results in evolution of genomic regions,genome-wide molecular genetic analyses can detect this consequent variation and improve the outcomes of plant breeding efforts[6].During the domestication and subsequent improvement of maize,variation in regulatory regions has decreased,due to a breeding focus on genes with strong expression,and levels of dominance have increased[44].The maize reference genome and high-throughput resequencing help us comprehend crop evolution due to domestication and thus to enhance the rate of crop improvement [6].In rice,GWAS was shown to be essential for modern genetics and breeding,and that in combination with next-generation sequencing it is a vital complement to classical genetic analysis of complex traits [45].Association mapping with dense marker coverage can significantly improve genetic resolution,and thereby permits identification of genomic variation that controls trait variation.Genomic regions controlling a number of important traits,including carbon metabolism [46],leaf blight [47],and plant height [29],have been identified through GWAS using high density markers in maize.High density genome-wide markers and resequencing data could provide more insight into the ways in which crop improvement (post-domestication selection) efforts have affected the genomes[5].
Marker-assisted breeding can be improved by leveraging whole-genome sequencing and genome-wide molecular markers in appropriate germplasm and growing locations[48].Genome-wide markers will improve the accuracy of breeding value estimates,make breeding cycles more rapid,and make selection based on phenotypes more efficient [49].Genotypic and phenotypic data used for GWAS could also be used directly for genomic selection,which uses weighted predictors of phenotypic values based on a training data set,unlike GWAS per se.Furthermore,the resolution of GWAS could be greatly improved,so that small-effect loci can be identified by high-throughput genotyping such as chip technology and genotyping by sequencing as performed in this study.
5.Conclusions
All evidence indicates that the P1 locus did not undergo neutral evolution in temperate maize and was affected by post-domestication selection or improvement.The novel information was generated in this study through chip-based genotyping and resequencing and analytical results have provided further insights into the ways by which maize breeding efforts have affected its genome evolution.
This study was supported by the Chinese National “863”Program from the China Ministry of Science and Technology(Grant No.2012AA10A306-3),the National Science Foundation of China (Grant No.31171562) to CX,and the Core Research Budget of the Non-profit Governmental Research Institution from the Chinese Government to the Institute of Crop Science,Chinese Academy of Agricultural Sciences(Grant No.2012001).
Authors' contributions: Chuanxiao Xie and Xinhai Li conceived and designed the experiments.Jianfeng Weng,Chuanxiao Xie,and Mingshun Li performed the experiments.Chuanxiao Xie,Jianfeng Weng,Cheng Zou,Zhuanfang Hao,and Wen-Xue Li contributed reagents/materials/analysis tools.Chuanxiao Xie,Yunbi Xu,and Jianfeng Weng wrote the paper.Xinhai Li,Shihuang Zhang,and Yunbi Xu coordinated the research.
[1] FAO,FAOStat2010,http://faostat3faoorg/home/indexhtml 2012.
[2] J.Doebley,A.Stec,L.Hubbard,The evolution of apical dominance in maize,Nature 386 (1997) 485–488.
[3] J.F.Doebley,B.S.Gaut,B.D.Smith,The molecular genetics of crop domestication,Cell 127 (2006) 1309–1321.
[4] H.Wang,T.Nussbaum-Wagler,B.Li,Q.Zhao,Y.Vigouroux,M.Faller,K.Bomblies,L.Lukens,J.F.Doebley,The origin of the naked grains of maize,Nature 436 (2005) 714–719.
[5] Y.Jiao,H.Zhao,L.Ren,W.Song,B.Zeng,J.Guo,B.Wang,Z.Liu,J.Chen,W.Li,M.Zhang,S.Xie,J.Lai,Genome-wide genetic changes during modern breeding of maize,Nat.Genet.44(2012) 812–815.
[6] P.L.Morrell,E.S.Buckler,J.Ross-Ibarra,Crop genomics:advances and applications,Nat.Rev.Genet.13(2012) 85–96.
[7] M.A.Hanson,B.S.Gaut,A.O.Stec,S.I.Fuerstenberg,M.M.Goodman,E.H.Coe,J.F.Doebley,Evolution of anthocyanin biosynthesis in maize kernels: the role of regulatory and enzymatic loci,Genetics 143 (1996) 1395–1407.
[8] K.Palaisa,M.Morgante,S.Tingey,A.Rafalski,Long-range patterns of diversity and linkage disequilibrium surrounding the maize Y1 gene are indicative of an asymmetric selective sweep,Proc.Natl.Acad.Sci.U.S.A.101 (2004) 9885–9890.
[9] S.R.Whitt,L.M.Wilson,M.I.Tenaillon,B.S.Gaut,E.S.Buckler,Genetic diversity and selection in the maize starch pathway,Proc.Natl.Acad.Sci.U.S.A.99(2002) 12959–12962.
[10] J.R.Dinges,C.Colleoni,A.M.Myers,M.G.James,Molecular structure of three mutations at the maize sugary1 locus and their allele-specific phenotypic effects,Plant Physiol.125(2001) 1406–1418.
[11] M.R.Bhave,S.Lawrence,C.Barton,L.C.Hannah,Identification and molecular characterization of shrunken-2 cDNA clones of maize,Plant Cell 2(1990)581–588.
[12] C.Lechelt,T.Peterson,A.Laird,J.Chen,S.L.Dellaporta,E.Dennis,W.J.Peacock,P.Starlinger,Isolation and molecular analysis of the maize P locus,Mol.Gen.Genet.219 (1989)225–234.
[13] S.Chopra,P.Athma,X.Li,T.Peterson,A maize Myb homolog is encoded by a multicopy gene complex,Mol.Gen.Genet.260(1998) 372–380.
[14] Y.Rhee,R.S.Sekhon,S.Chopra,S.Kaeppler,Tissue culture-induced novel epialleles of a Myb transcription factor encoded by pericarp color1 in maize,Genetics 186 (2010)843–855.
[15] S.M.Cocciolone,S.Chopra,S.A.Flint-Garcia,M.D.McMullen,T.Peterson,Tissue-specific patterns of a maize Myb transcription factor are epigenetically regulated,Plant J.27(2001) 467–478.
[16] R.S.Sekhon,T.Peterson,S.Chopra,Epigenetic modifications of distinct sequences of the p1 regulatory gene specify tissue-specific expression patterns in maize,Genetics 175(2007) 1059–1070.
[17] F.Zhang,T.Peterson,Comparisons of maize pericarp color1 alleles reveal paralogous gene recombination and an organ-specific enhancer region,Plant Cell 17(2005) 903–914.
[18] L.Sidorenko,V.Chandler,RNA-dependent RNA polymerase is required for enhancer-mediated transcriptional silencing associated with paramutation at the maize p1 gene,Genetics 180 (2008) 1983–1993.
[19] M.L.Robbins,P.Wang,R.S.Sekhon,S.Chopra,Gene structure induced epigenetic modifications of pericarp color1 alleles of maize result in tissue-specific mosaicism,PLoS One 4(2009)e8231.
[20] A.Rafalski,E.Ananiev,Genetic diversity,linkage disequilibrium and association mapping,in:J.L.Bennetzen,S.Hake(Eds.),Handbook of Maize-Genetics and Genomics,Springer,2009,pp.201–220.
[21] J.Meyer,M.Snook,K.Houchins,B.Rector,N.Widstrom,M.McMullen,Quantitative trait loci for maysin synthesis in maize (Zea mays L.) lines selected for high silk maysin content,Theor.Appl.Genet.115 (2007) 119–128.
[22] E.Grotewold,B.J.Drummond,B.Bowen,T.Peterson,The myb-homologous P gene controls phlobaphene pigmentation in maize floral organs by directly activating a flavonoid biosynthetic gene subset,Cell 76(1994) 543–553.
[23] S.Szalma,E.Buckler,M.Snook,M.McMullen,Association analysis of candidate genes for maysin and chlorogenic acid accumulation in maize silks,Theor.Appl.Genet.110 (2005)1324–1333.
[24] E.Frascaroli,P.Landi,Allelic frequency change of P1 gene in maize population after recurrent selection for grain yield,Crop.Sci.38(1998) 1391–1394.
[25] P.Landi,M.Canè,E.Frascaroli,Responses to divergent selection for cob color in maize,Euphytica 164(2008)645–658.
[26] P.F.Dowd,Enhanced maize pericarp browning: associations with insect resistance and involvement of oxidizing enzymes,J.Chem.Ecol.20 (1994) 2777–2803.
[27] M.A.Gore,J.M.Chia,R.J.Elshire,Q.Sun,E.S.Ersoz,B.L.Hurwitz,J.A.Peiffer,M.D.McMullen,G.S.Grills,J.Ross-Ibarra,D.H.Ware,E.S.Buckler,A first-generation haplotype map of maize,Science 326 (2009) 1115–1117.
[28] N.M.Springer,K.Ying,Y.Fu,T.Ji,C.T.Yeh,Y.Jia,W.Wu,T.Richmond,J.Kitzman,H.Rosenbaum,A.L.Iniguez,W.B.Barbazuk,J.A.Jeddeloh,D.Nettleton,P.S.Schnable,Maize inbreds exhibit high levels of copy number variation(CNV)and presence/absence variation(PAV) in genome content,PLoS Genet.5 (2009) e1000734.
[29] J.Weng,C.Xie,Z.Hao,J.Wang,C.Liu,M.Li,D.Zhang,L.Bai,S.Zhang,X.Li,Genome-wide association study identifies candidate genes that affect plant height in Chinese elite maize Zea mays L.inbred lines,PLoS One 6 (2011) e29229.
[30] C.Xie,S.Zhang,M.Li,X.Li,Z.Hao,L.Bai,D.Zhang,Y.Liang,Inferring genome ancestry and estimating molecular relatedness among 187 Chinese maize inbred lines,J.Genet.Genomics 34 (2007) 738–748.
[31] M.G.Murray,W.F.Thompson,Rapid isolation of high molecular weight plant DNA,Nucleic Acids Res.8(1980)4321–4326.
[32] R.Nielsen,J.S.Paul,A.Albrechtsen,Y.S.Song,Genotype and SNP calling from next-generation sequencing data,Nat.Rev.Genet.12(2011) 443–451.
[33] J.K.Pritchard,M.Stephens,P.Donnelly,Inference of population structure using multilocus genotype data,Genetics 155 (2000) 945–959.
[34] P.J.Bradbury,Z.Zhang,D.E.Kroon,T.M.Casstevens,Y.Ramdoss,E.S.Buckler,TASSEL: software for association mapping of complex traits in diverse samples,Bioinformatics 23 (2007) 2633–2635.
[35] S.A.Flint-Garcia,J.M.Thornsberry,E.S.Buckler,Structure of linkage disequilibrium in plants,Annu.Rev.Plant Biol.54(2003) 357–374.
[36] E.G.Anderson,R.A.Emerson,Pericarp studies in maize:I.The inheritance of pericarp colors,Genetics 8(1923) 11.
[37] http://www.maizesequqnce.org/.
[38] M.Yamasaki,M.I.Tenaillon,I.Vroh Bi,S.G.Schroeder,H.Sanchez-Villeda,J.F.Doebley,B.S.Gaut,M.D.McMullen,A large-scale screen for artificial selection in maize identifies candidate agronomic loci for domestication and crop improvement,Plant Cell 17(2005) 2859–2872.
[39] F.Tian,N.M.Stevens,E.S.Buckler,Tracking footprints of maize domestication and evidence for a massive selective sweep on chromosome 10,Proc.Natl.Acad.Sci.U.S.A.106(2009) 9979–9986.
[40] Y.Lu,T.Shah,Z.Hao,S.Taba,S.Zhang,S.Gao,J.Liu,M.Cao,J.Wang,A.B.Prakash,T.Rong,Y.Xu,Comparative SNP and haplotype analysis reveals a higher genetic diversity and rapider LD decay in tropical than temperate germplasm in maize,PLoS One 6(2011) e24861.
[41] M.L.Warburton,J.C.Reif,M.Frisch,M.Bohn,C.Bedoya,X.C.Xia,J.Crossa,J.Franco,D.Hoisington,K.Pixley,S.Taba,A.E.Melchinger,Genetic diversity in CIMMYT nontemperate maize germplasm:landraces,open pollinated varieties,and inbred lines,Crop.Sci.48(2008) 617–624.
[42] K.Semagn,C.Magorokosho,B.Vivek,D.Makumbi,Y.Beyene,S.Mugo,B.M.Prasanna,M.Warburton,Molecular characterization of diverse CIMMYT maize inbred lines from eastern and southern Africa using single nucleotide polymorphic markers,BMC Genomics 13(2012)113.
[43] W.Wen,J.Franco,V.H.Chavez-Tovar,J.Yan,S.Taba,Genetic characterization of a core set of a tropical maize race Tuxpeño for further use in maize improvement,PLoS One 7(2012) e32626.
[44] M.B.Hufford,X.Xu,J.van Heerwaarden,T.Pyhajarvi,J.M.Chia,R.A.Cartwright,R.J.Elshire,J.C.Glaubitz,K.E.Guill,S.M.Kaeppler,J.Lai,P.L.Morrell,L.M.Shannon,C.Song,N.M.Springer,R.A.Swanson-Wagner,P.Tiffin,J.Wang,G.Zhang,J.Doebley,M.D.McMullen,D.Ware,E.S.Buckler,S.Yang,J.Ross-Ibarra,Comparative population genomics of maize domestication and improvement,Nat.Genet.44(2012)808–811.
[45] X.Huang,X.Wei,T.Sang,Q.Zhao,Q.Feng,Y.Zhao,C.Li,C.Zhu,T.Lu,Z.Zhang,M.Li,D.Fan,Y.Guo,A.Wang,L.Wang,L.Deng,W.Li,Y.Lu,Q.Weng,K.Liu,T.Huang,T.Zhou,Y.Jing,W.Li,Z.Lin,E.S.Buckler,Q.Qian,Q.F.Zhang,J.Li,B.Han,Genome-wide association studies of 14 agronomic traits in rice landraces,Nat.Genet.42(2010) 961–967.
[46] N.Zhang,A.Gur,Y.Gibon,R.Sulpice,S.Flint-Garcia,M.D.McMullen,M.Stitt,E.S.Buckler,Genetic analysis of central carbon metabolism unveils an amino acid substitution that alters maize NAD-dependent isocitrate dehydrogenase activity,PLoS One 5(2010) e9991.
[47] J.A.Poland,P.J.Bradbury,E.S.Buckler,R.J.Nelson,Genome-wide nested association mapping of quantitative resistance to northern leaf blight in maize,Proc.Natl.Acad.Sci.U.S.A.108 (2011) 6893–6898.
[48] Y.Xu,Y.Lu,C.Xie,S.Gao,J.Wan,B.Prasanna,Whole-genome strategies for marker-assisted plant breeding,Mol.Breed.29(2012) 833–854.
[49] E.L.Heffner,M.E.Sorrells,J.L.Jannink,Genomic selection for crop improvement,Crop.Sci.49(2009) 1–12.
杂志排行

The Crop Journal的其它文章
- Identification and fine mapping of two blast resistance genes in rice cultivar 93-11
- Identification of unconditional and conditional QTL for oil,protein and starch content in maize
- Effects of narrow plant spacing on root distribution and physiological nitrogen use efficiency in summer maize
- Variation of high-molecular-weight glutenin subunits and glutenin macropolymer particle distribution in wheat grains produced under different water regimes
- Dissection of two quantitative trait loci for grain weight linked in repulsion on the long arm of chromosome 1 of rice(Oryza sativa L.)
- Genome-wide association of 10 horticultural traits with expressed sequence tag-derived SNP markers in a collection of lettuce lines