Diagnostics in generalized nonlinear models based on maximum Lq-likelihood estimation
2013-01-08XuWeijuanLinJinguan
Xu Weijuan Lin Jinguan
(Department of Mathematics, Southeast University, Nanjing 211189, China)
Linear regression diagnostics have developed well in the past three decades. A comprehensive study on this topic can be found, for instance, in Refs.[1-2]. However, there has not been much published work on regression diagnostics for the models outside of linear regression[3-4]. Only a few papers are related to the diagnostics for exponential family nonlinear models[4-6]. Wei[7]described the diagnostics for generalized nonlinear models systematically in chapter 6.
All the discussion above is based on the maximum likelihood method. Standard large sample theory guarantees that the maximum likelihood estimator (MLE) is asymptotically efficient. It means that when the sample is large, the MLE is at least as accurate as any other estimator. However, when the sample is moderate or small, the properties of the MLE may not be very good. So, we need a new estimation method, which can make the property better.
In this paper, we propose a modified diagnostic method for a generalized nonlinear model based on the maximumLq-likelihood estimator[8]. Diagnostics for regression parameters and dispersion parameters are considered, and three kinds of diagnostic statistics are proposed. For small and modest sample sizes, the proposed diagnostic method is still available whenqis properly chosen. Some simulations are performed to investigate the behavior of the proposed methods for different sample sizes. We also show that the modified diagnostic statistics method outperform the classical diagnostic statistics method when the sample sizes are modest or even small.
1 Generalized Entropy and Maximum Lq-Likeli-hood Estimator
The Kullback-Leibler (KL) divergence[9]is one of the most popular quantities employed to measure the distance of a distribution with respect to a “true” distribution. Consider aσ-finite measureμon a measurable spaceΩand letΜbe the set of all probability distribution functionsf. The expectation with respect tofis denoted byEf. The KL divergence between two density functionsgandfis defined as
(1)
Note that finding the densitygthat minimizes Δ(f‖g) is equivalent to minimizing Shannon’s entropy[10]:
Η(f‖g)=-Eflogg(X)
(2)
Definition1Letfandgbe two density functions; and theq-entropy is defined as
Ηq(f,g)=-Ef[Lq(g(X))]q>0
(3)
where
(4)
The functionLqrepresents a Box-Cox transformation in statistics. In other fields it is often called a deformed logarithm. The above characterization emphasizes the similarity to the classical Shannon’s entropy: ifq→1, thenLq(u)→log(u) and the usual definition of Shannon’s entropy is recovered.
Recently, Ferrari and Yang[8]introduced an estimator inspired by Havrda, and Charvt[11]generalized information measures (usually calledα-order entropies orq-entropies in physics), the maximumLq-likelihood estimator.
Definition2LetX1, …,Xnbe an i.i.d. sample fromf(x;θ0),θ0∈Θ. The maximumLq-likelihood estimator ofθ0is defined as
(5)
whereLqis theq-logarithmic function defined in Eq.(4) withq> 0. TheLq-likelihood equation is
(6)
Note that when the distortion parameterqtends to 1,Lq(·)→log(·) and the usual MLE is recovered. In this sense, the maximumLq-likelihood estimation extends the classic method, resulting in a general inferential procedure that inherits most of the desirable features of traditional maximum likelihood, and at the same time gains some new properties that can be exploited in particular estimation settings.
2 Generalized Nonlinear Model
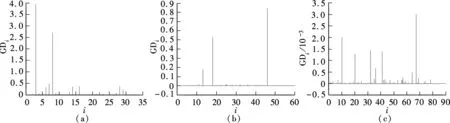
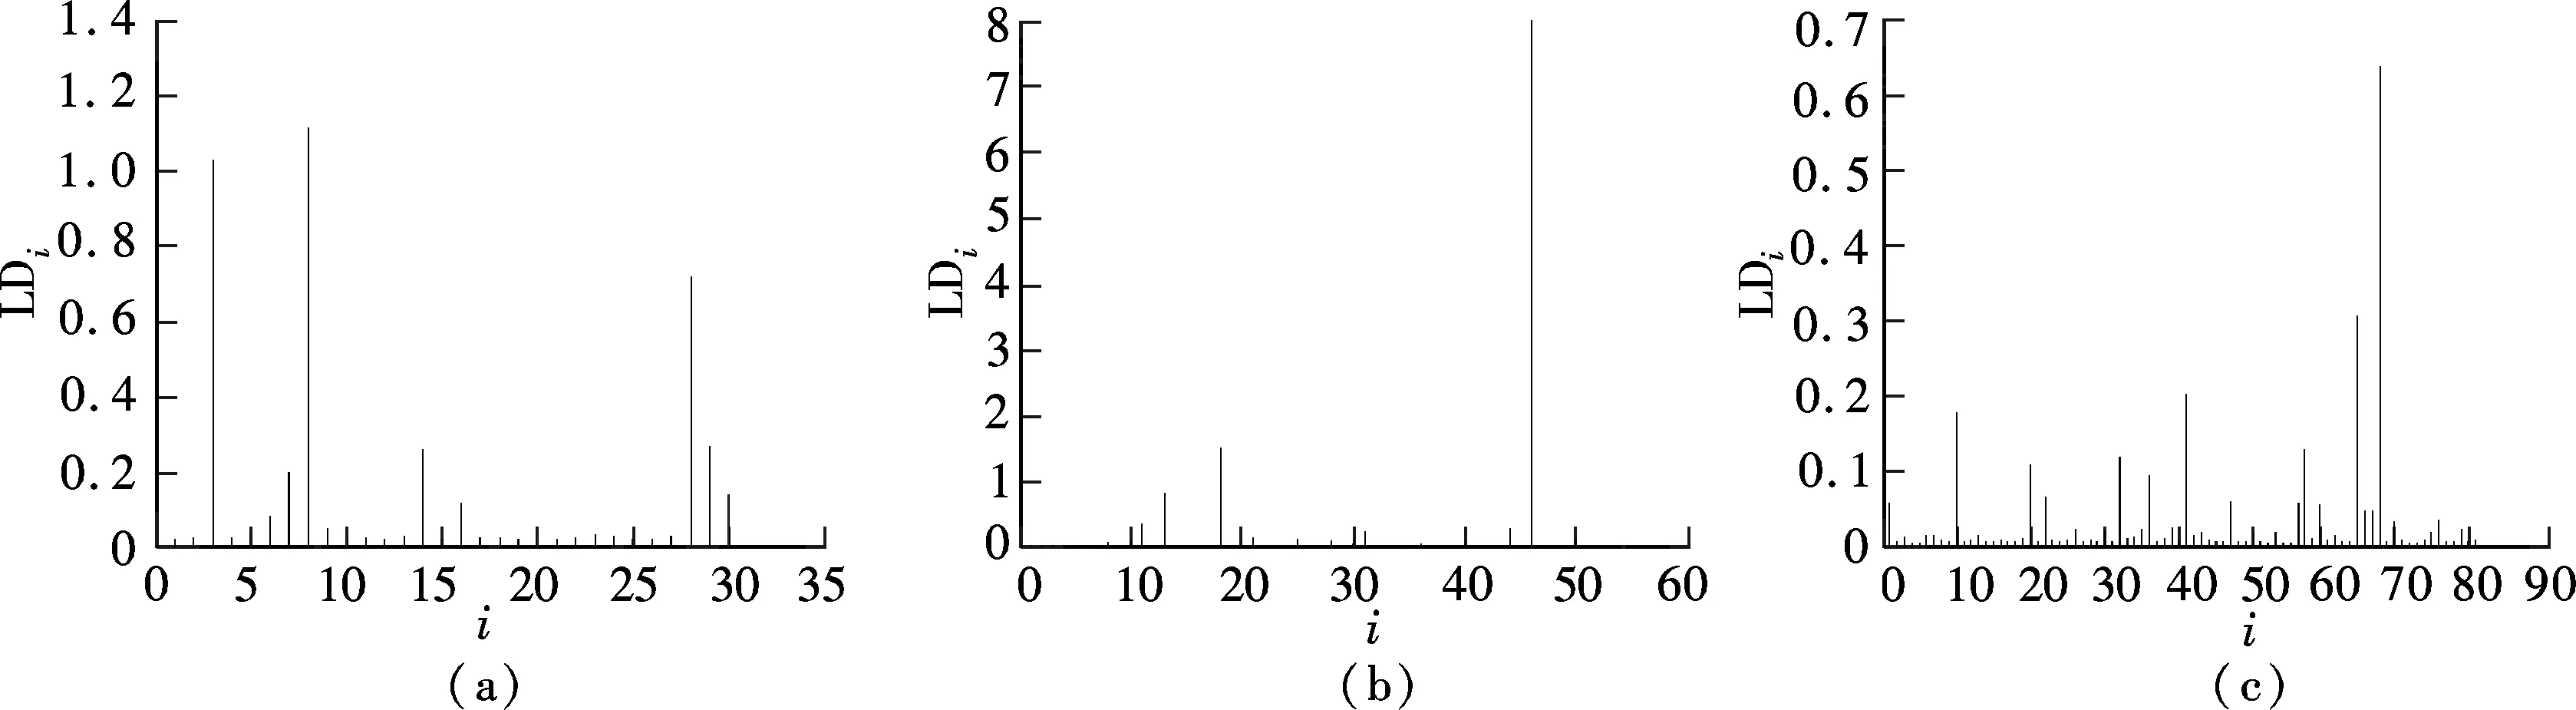
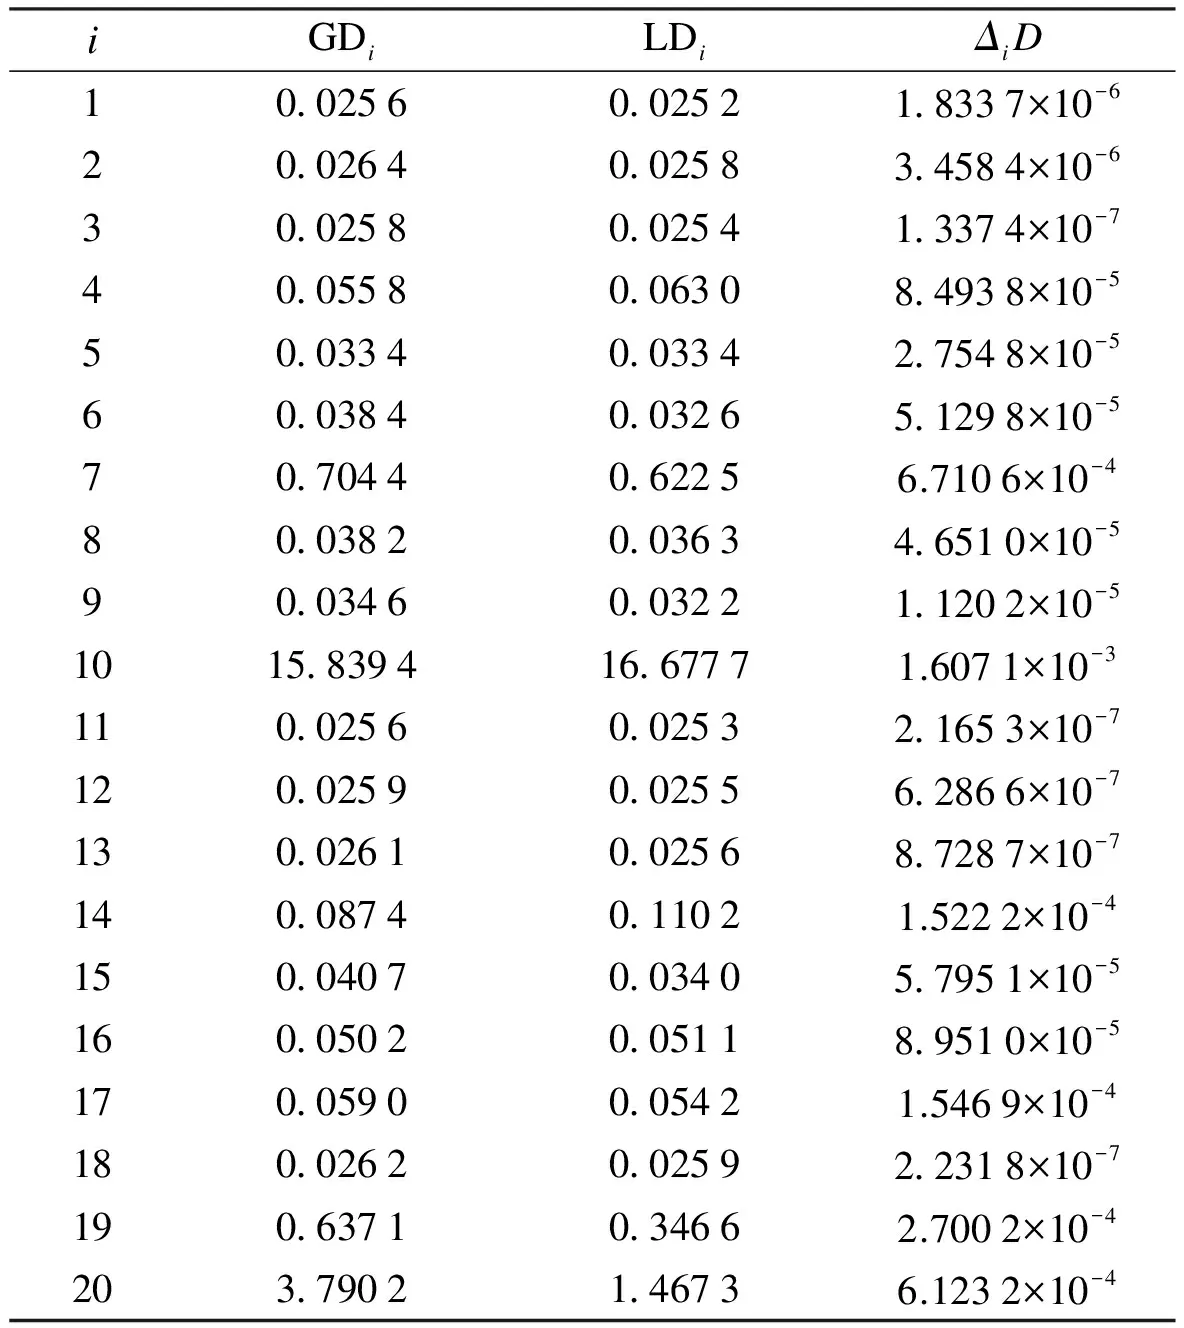
Suppose that the components ofY={y1,…,yn}Tare independent random variables, in which eachyimay depend on an independent known variablexi(i=1,2,…,n). The parameters of interest areβ={β1,…,βp}Tdefined in a subsetΒofRp(p g(μi)=f(xi,β),yi~ED(μi,σ2)i=1,2,…,n (7) whereg(·) is a known monotonic link function;f(·;·) is a known function with an unknown vector parameterβand a known explanatory variable ofq-vectorxi;E(yi)=μiand ED(μi,σ2) is the exponential family distribution, which has the density function in the following form as μi=μi(β) orθi=θi(β) (8) whereθiis the natural parameter; andσ2=φ-1is the dispersion parameter. According to the property of the exponential family distribution[7], we have (9) From model (8), the log-likelihood ofYfor the parameterβandφis usually denoted by (10) Then theLq-likelihood ofYis (11) (12) yi~ED(μi,σ2)i=1,2,…,n g(μj)=f(xj;β)j=1,2,…,n;j≠i (13) This is just model (7) with thei-th case deleted. 1) Generalized Cook distance (14) 2) Likelihood distance The likelihood distance is defined as[1] (15) 3) Difference of deviance The differences of deviance has the form as (16) whereD(β)dj(yj,μj(β)),D(i)(β)=dj(yj,μj(β)),dj(yj,μj(β))=-2{yjθj-b(θj)-c(yj)}+2{yjθj-b(θj)-c(yj)}μj=yj.ΔiDactually reflects the differences of the maximum likelihood estimators ofσ2orφunder the original model and under the CDM. We obtain the formula to the maximumLq-likelihood estimators ofβandφunder Eq.(12) in Section 2. In Section 3, three kinds of distance, which are used for the diagnostics, are introduced. Now let us look at a numerical simulation example for computing diagnostic statistics. Fig.1 GDi based on MLE. (a) n=30; (b) n=50; (c) n=80 Fig.2 GDi based on the maximum Lq-likelihood estimator. (a) n=30; (b) n=50; (c) n=80 Fig.3 LDi based on MLE.(a) n=30; (b) n=50; (c) n=80 Fig.4 LDi based on the maximum Lq-likelihood estimator. (a) n=30; (b) n=50; (c) n=80 From the above figures, we can obtain the same strong impact points through calculating the value about GDiand LDi. The value of GDiabout the strong impact point which obtains from the maximumLq-likelihood method is bigger than the value obtained from the maximum likelihood method when the sample size is small. With the increase in the sample size, the difference between them is small. It means that the maximumLq-likelihood estimation method is more effective than the MLE method when the sample size is small. We have the formula to the maximumLq-likelihood estimators ofβandφin Section 3 and three diagnostic statistics in Section 4. Now let us look at an example for computing diagnostic statistics. Example1Product sales data These data were given by Whitmore[12], which is shown in Tab.1. We call them the “Produce sales data” for short. In this dataset,xirepresents the projected sales amounts of thei-th product reported by a market survey organization andyiis the corresponding actual sales amounts of a company (i=1,2,…,20). Whitmore suggested an inverse Gaussian fit by using (17) Then, we obtain the values of the diagnostic statistics (see Tab.2). All the results indicate that case 10 may be an outstanding outlier and the influence of case 20 is also obvious. Through the comparison between our results and the diagnostic results obtained through MLE[13], we find that No. 10 and 20 are two strong impact points, and the value of GDiand LDiusing the maximumLq-likelihood estimation method is greater than the value using the MLE method. It means that the result we arrived at is more significant. So it is feasible to diagnose using the maximumLq-likelihood method. Tab.1 Product sales data Tab.2 Some diagnostic statistics for product sales data In this paper, we consider the diagnostics of generalized nonlinear regression models. Three diagnostic statistics and a new estimation method, the maximumLq-likelihood estimator, are introduced. Through the value of the diagnostic statistics, we can make a decision of whether the individual point of the data is a strong impact one or not. By comparing the results obtained from the maximum likelihood estimator and the maximumLq-likelihood estimator, we find that the method of the maximumLq-likelihood estimation is more effective when the sample size is small. When the sample size is bigger, the values about the diagnostic statistics are almost the same. In other words, the performance of our proposed method is equivalent to that of the classical diagnostic method for large sample sizes. The same conclusion can also be obtained from the example in Section 5. This paper discusses some diagnostic problems for the generalized nonlinear model by using the maximumLq-likelihood estimation method and compares the results with those of the classical diagnostic method. However, consistency and asymptotic normality of the maximumLq-likelihood estimation for the generalized nonlinear model have not been proved, which is obviously of great significance. Thus, more research on this issue will be valuable and we believe this is an interesting direction for further exploration. [1]Cook R D, Weisberg S.Residualandinfluenceinregression[M]. London: Chapman and Hall, 1982. [2]Chatterjee S, Hadi A S. Influential observations, high leverage points and outliers in linear regression (with discussion) [J].StatisticalScience, 1986,1(3): 379-416. [3]McCullagh P, Nelder J A.Generalizedlinearmodels[M]. London: Chapman and Hall, 1989. [4]Davison A C, Tsai C L. Regression model diagnostics [J].InternationalStatisticalReview, 1992,60(3): 337-355. [5]Gay D M, Welsch R E. Maximum likelihood and quasi-likelihood for nonlinear exponential family regression models [J].JournaloftheAmericanStatisticalAssociation, 1988,83(404): 990-998. [6]Wei B C and Shi J Q. On statistical models in regression diagnostics [J].AnnInstStatistMath,1994,46(2):267-278. [7]Wei B C.Exponentialfamilynonlinearmodels[M]. Singapore: Springer, 1998. [8]Ferrari D, Yang Y. Estimation of tail probability via the maximumLq-likelihood method [R]. Minneapolis, MN, USA: School of Statistics, University of Minnesota, 2007. [9]Kullback S.Informationtheoryandstatistics[M]. Wiley: New York, 1959. [10]Shannon C E. A mathematical theory of communication [J].BellSystemTechnicalJournal, 1948,27:379-423. [11]Havrda J, Charvt F. Quantification method of classification processes: concept of structural entropy [J].Kibernetika, 1967,3: 30-35. [12]Whitmore D A. Inverse Gaussian ratio estimation [J].JournaloftheRoyalStatisticalSociety,SeriesC(AppliedStatistics), 1986,35(1):8-15. [13]Wei B C, Lin J G, Xie F C.Statisticaldiagnosis[M].Beijing: Higher Education Press, 2009. (in Chinese).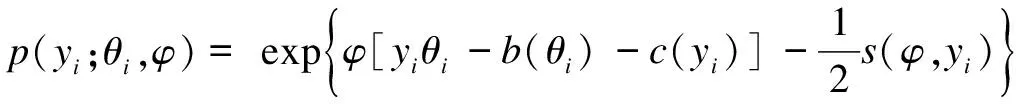

3 Diagnostics for Regression Parameter and Dis-persion Parameter


4 Numerical Simulations


5 Illustrative Example


6 Conclusion
杂志排行

Journal of Southeast University(English Edition)的其它文章
- Uplink capacity analysis of single-user SA-MIMO system
- A broad-band sub-harmonic mixer for W-band applications
- Feature combination via importance-inhibition analysis
- Transmission cable fault detector based on waveform reconstruction
- Force measurement between mica surfaces in electrolyte solutions
- Flexural behaviors of double-reinforced ECC beams