Heat flow balance and control strategies for a large GSHP
2013-01-08ChenYiboChenJiufaUmbertoBerardiQiaoWeilaiChenJunwei
Chen Yibo Chen Jiufa Umberto Berardi Qiao Weilai Chen Junwei
(1School of Energy and Environment, Southeast University, Nanjing 210096, China)(2Civil and Environmental Engineering, Worcester Polytechnic Institute, Worcester, MA 01609-2280, USA)
The rapid economic expansion has propelled China into the ranks of the largest energy consuming nations in the world. The research for a flourishing domestic economy also urges rapid urbanization processes, thus resulting in an increasing application of air conditioning systems[1-2]. The rapid growth of the residential energy demand increases the urgency to improve the efficacy of the technologies in new houses.
Ground-source heat pump systems (GSHPs) are proved to be reliable air conditioning systems thanks to their high energy efficiency, and low operating and maintenance costs. The GSHPs use the ground as a heating exchanger. Thus, the thermal balance with the ground may play a significant role in the performance of the GSHP. In fact, accumulation of heat or cold may appear if the annual operation results in thermal imbalance. Consequently, the ground temperature field may gradually increase or decrease, which results in changes in the coefficient of performance(COP) of the GSHP[3-5].
Based on the accumulation analysis, this paper focuses on the efficacy of GSHPs, in terms of accurate energy consumption and control strategies. EnergyPlus simulations are used to calculate heat and cooling loads, whereas Fluent simulations focus on the underground temperature field.
1 Building Model
1.1 Overview
The case study described in this paper is a residential building in Nanjing (see Fig.1). The building has seven storeys, with 70 households and a total area of 10304 m2. The shape coefficient of the building is 0.192. The air conditioning system in the building serves an area of 9530 m2and consists of a ceiling radiation system for heating/cooling, combined with a replacement fresh air system.
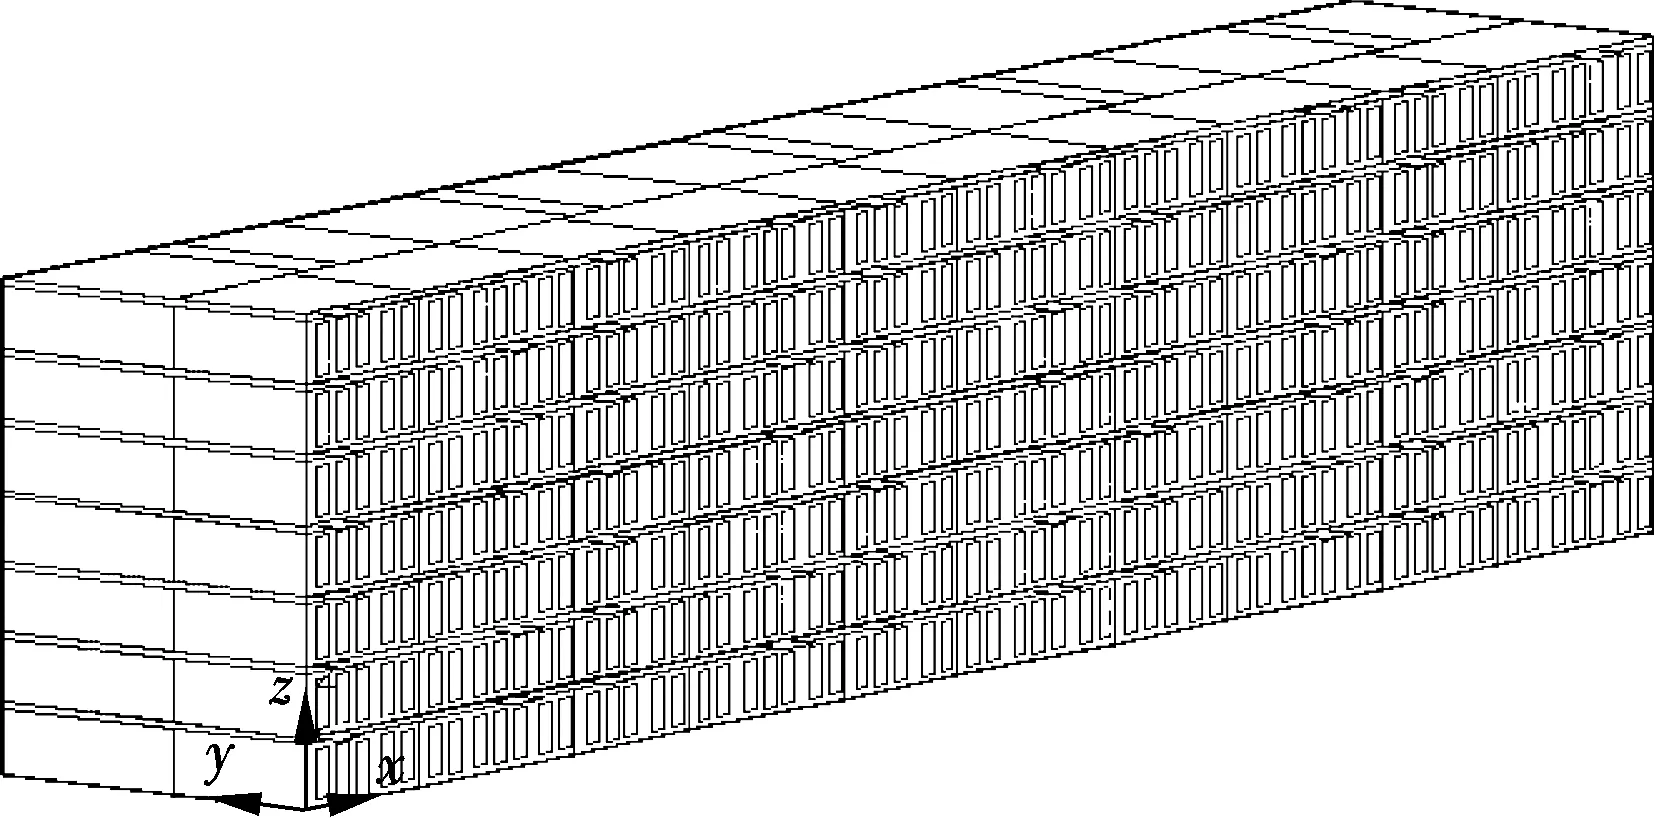
Fig.1 Model of the residential building object
1.2 Air-conditioning system parameters
Occupancy statistics of the building reveal an occupancy rate of 97%, mainly composed of middle-aged and elderly people. The occupancy density of this building is about three persons per apartment.
The design and operaton parameters of the air conditioning system are shown in Tab.1. The indoor temperature in the operation mode is 25 ℃ during the cooling period and 22 ℃ during the heating period. Fresh air volume is assumed to be 30 m3/h per person.
According to the Chinese national standard “Heating, ventilation and air conditioning design” (GB 50019—2003), the heat exchange amount for the radiant heating system with hot water should be determined by calculation especially. The actual calculated value should be corrected by an additional ratio of 0.9 to 0.95, or by setting the design indoor temperature value at 2 ℃ lower in the heating load calculation. Just taking the second method, the indoor air temperature is set at 20 ℃ during the heating load simulation hourly. After being heated by the air handling unit, the supply air temperature is 22 ℃, and the supplying water temperature in the ceiling capillary is 28 ℃. In the same way, during the cooling period, the temperature of the supplying fresh air is 14 ℃, and the supplying water temperature in the ceiling is 18 ℃.
Tab.1 Design and operation parameters in the case study
According to the climate conditions and actual operation situation in Nanjing, the heating period is assumed from January 1st to March 31st and from October 16th to December 31st. The transition period is from April 1st to May 15th and from October 1st to October 15th; in this period, the heating and cooling segments might both work. The cooling period is from May 16th to September 30th, during which the fresh air unit is on operation of cooling and dehumidification.
1.3 Air conditioning equipment
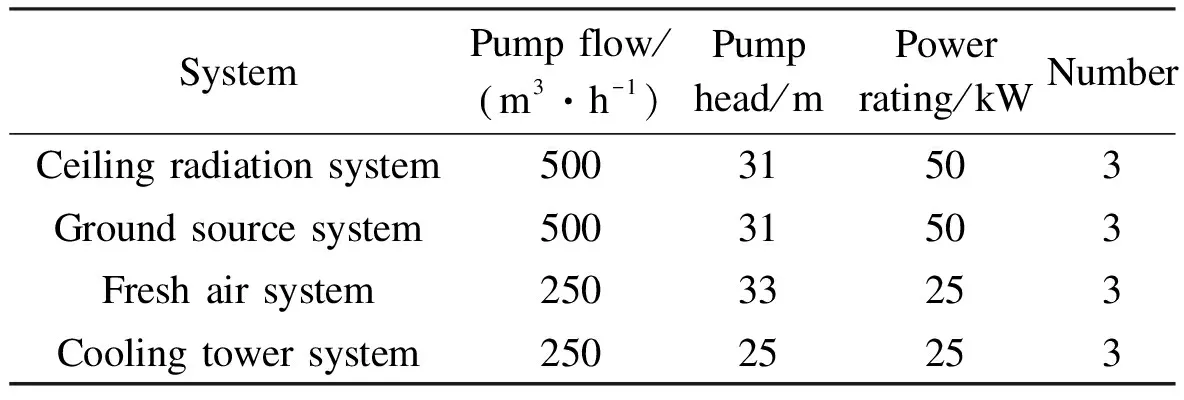
The parameters of the circulation pumps are shown in Tab.2. In each subsystem, there are three circulation pumps, two of which are generally operative, and the other one is in standby mode.
Tab.2 Parameters of the circulation pump of the system
As we all know, pump power consumption is converted into water pressure, pump heating, and heat production for mechanical friction[3,6]. The nominal effective power of the pumps is supposed to be 86.1% according to manufacture data. However, the behavioral measure reveals that the actual effective power of the pumps is around 60%.
In the calculation, the heat transformed from the pump pressure energy is absorbed by the circulating water and becomes a part of the heat exchange between the building and the cold/heat source.Only a portion of the mechanical friction heat production is absorbed by the circulating water,because much of it directly spreads into the HVAC plant room.So this paper assumes that 60% of the power of the circulating pump is converted into heat that is absorbed by the circulating water of the air-conditioning system.
In addition to the heat converted from the water pump power, the power consumption of fans is also converted into heat inside the air conditioning units (AHU). The two AHUs have a blowing rate of 5135 m3/h and a total pressure of 500Pa. In the rated supply air conditions, the power converted from power consumption of the fans is 2.58 kW.
The energy consumption of the heat pump units in the cooling and heating conditions is calculated according to the following equations respectively.
(1)
(2)

The heat pump unit in this building is an Italian Climaveneta PSRHH3602. The performance parameters of this machine are reported in Tab.3.
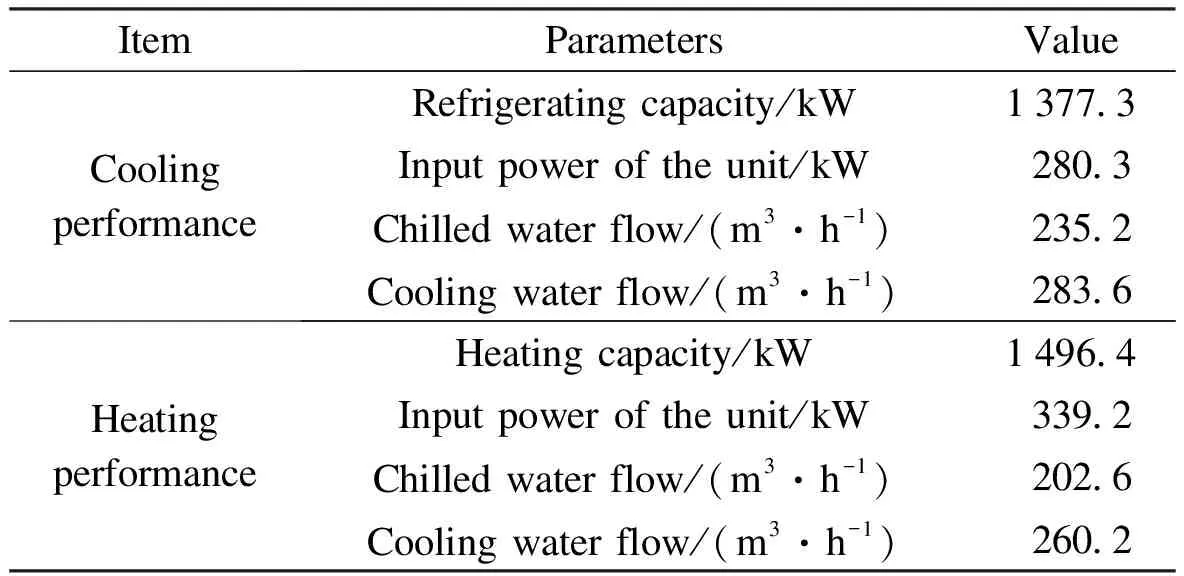
Tab.3 Performance parameters of the heat pump units
Refrigeration performance parameters are obtained under the condition that the inlet/outlet water temperature at the load side is 12/7 ℃, while the ground source side is 30/35 ℃. Heating performance parameters are obtained under the conditions that the inlet/outlet water temperature at the load side is 40/45 ℃, and the ground source side is 10/5 ℃.
The study is done by simplifying some parameters of the heat pump unit. In particular, it is assumed that the COP of the unit is only related to the inlet and outlet water temperature under the condition of constant flow, as shown in the following equation:
Qc=f(Tl,Ts),Qh=f(Tl,Ts)
(3)
whereQcandQhare the cooling and heating capacities of the heat pump, kW;Tlis the outlet water temperature at the load side, ℃;Tsis the outlet water temperature at the ground source side, ℃.
Assuming the function relations in Eq.(3), it can be rewritten as
(4)
Taking the logarithmic on both sides of Eq.(4), we obtain
lnQc=lna+b1lnTl+b2lnTs
(5)
The goal is hence to obtain the constantsa,b1andb2in Eq.(5). This is a problem of linear regression of the binary function. Qiao[7]revealed these data according to the performance samples of the heat pump under non-standard conditions provided by manufacturers. The following formulae are hence obtained by fitting these data:
Refrigeration condition
(6)
(7)
(8)
Heating condition
(9)
(10)
(11)
In the case of the constant water flow of load and ground source sides, the inlet and outlet water temperatures at both the load and ground source sides change with the building load. The annual COP of the heat pump unit is generally related to the inlet water temperature of underground heat exchange only, assuming that the supply water temperature at the load side is 7 ℃ during the cooling period and 45 ℃ during the heating period. Combining Eqs.(1) and (2), the COP of the heat pump is plotted in Fig.2.
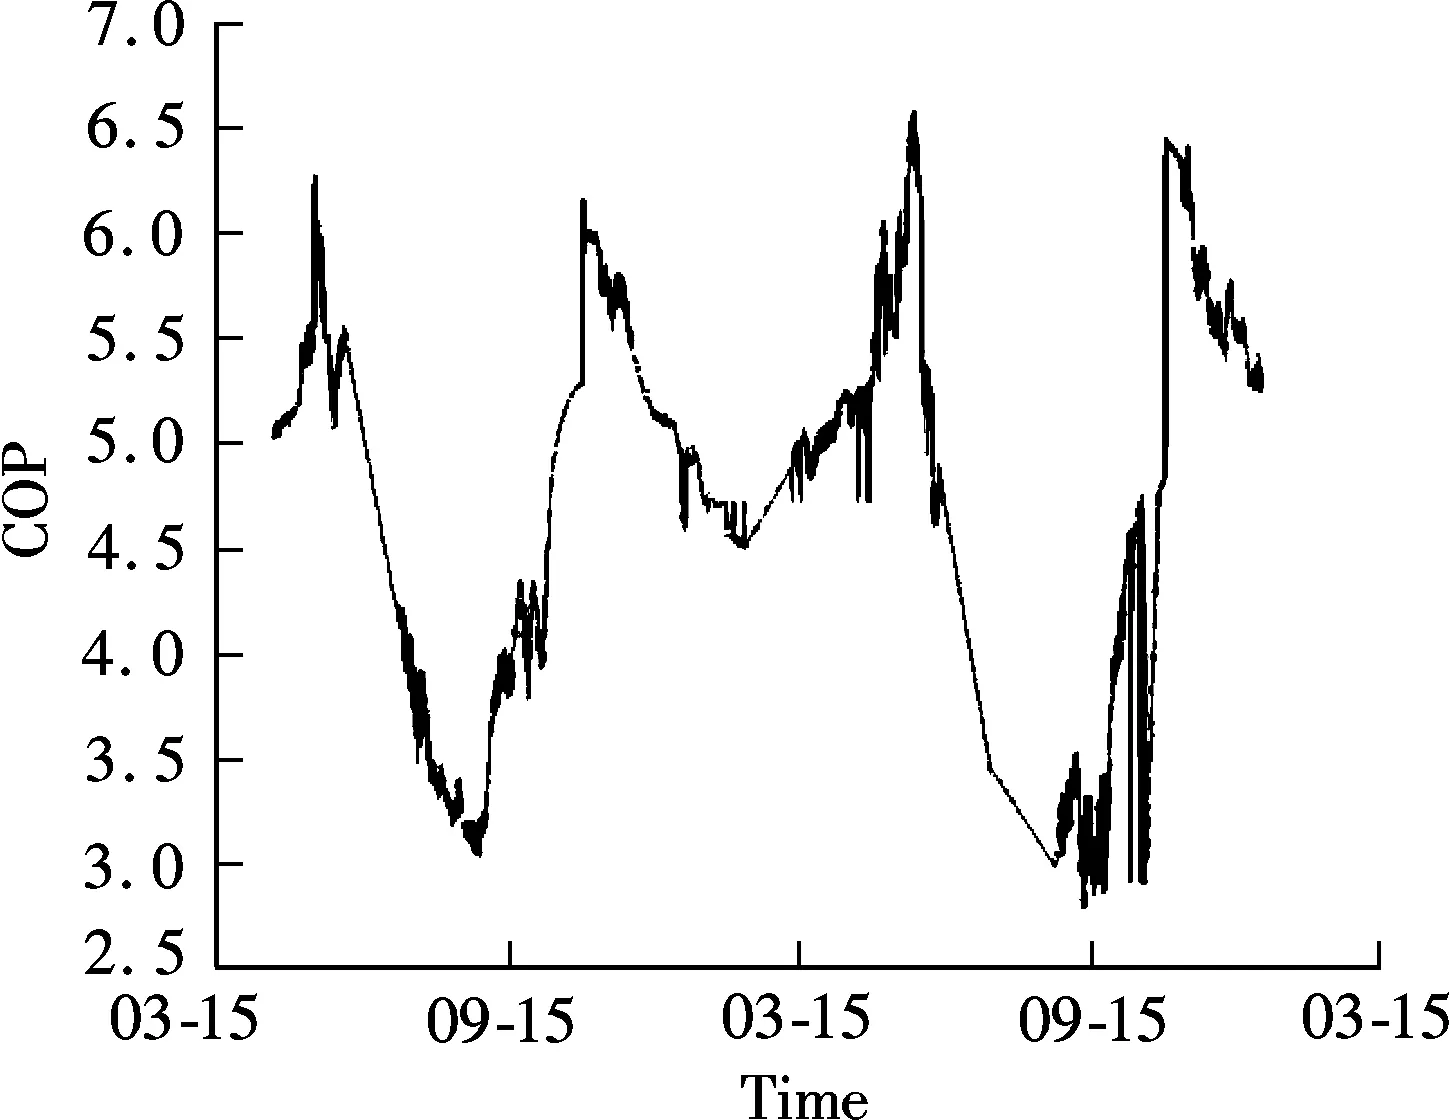
Fig.2 Bi-annual COP curves of the heat pump unit
2 Heat Balance of GSHPs
2.1 Hourly cooling and heating loads
EnergyPlus is used to calculate the hourly profiles of the cooling and heating loads. Simulation results are shown in Fig.3. The peak cooling load in summer was 206.45 kW on July 18th. The peak heating load in winter was 93.90 kW on December 18th. The total annual cooling load was 391 343 kW·h, and the total annual heating load was 161278 kW·h. Finally, the ratio of the annual cooling and heating load was 2.43.
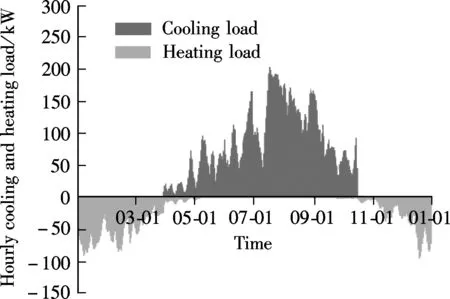
Fig.3 Hourly cooling and heating load
2.2 Ground heat exchanges
In the calculation of heat exchange underground, the water pumps, fans and heat pump units of the air-conditioning system should be considered. Heat transfer capacity throughout the year of underground heat exchangers can be calculated as follows:
Cooling condition
(12)
Heating condition
(13)
whereQc1is the total annual cooling load of the building during the cooling period, kW;Qh1is the total annual heat load of the building during the heating period, kW; COPc-emis the operating cooling coefficient of performance; COPh-emis the operating heating coefficient of performance.
As shown in Fig.4, the peak heat release in summer from underground heat exchangers is 263.75 kW, and the peak heat absorption of underground heat exchangers in winter is 68.26 kW. The total annual cooling load is 531 237 kW·h, and the total annual heating load is 104 507 kW·h, so the ratio of the total annual cooling and heating load is 5.08.
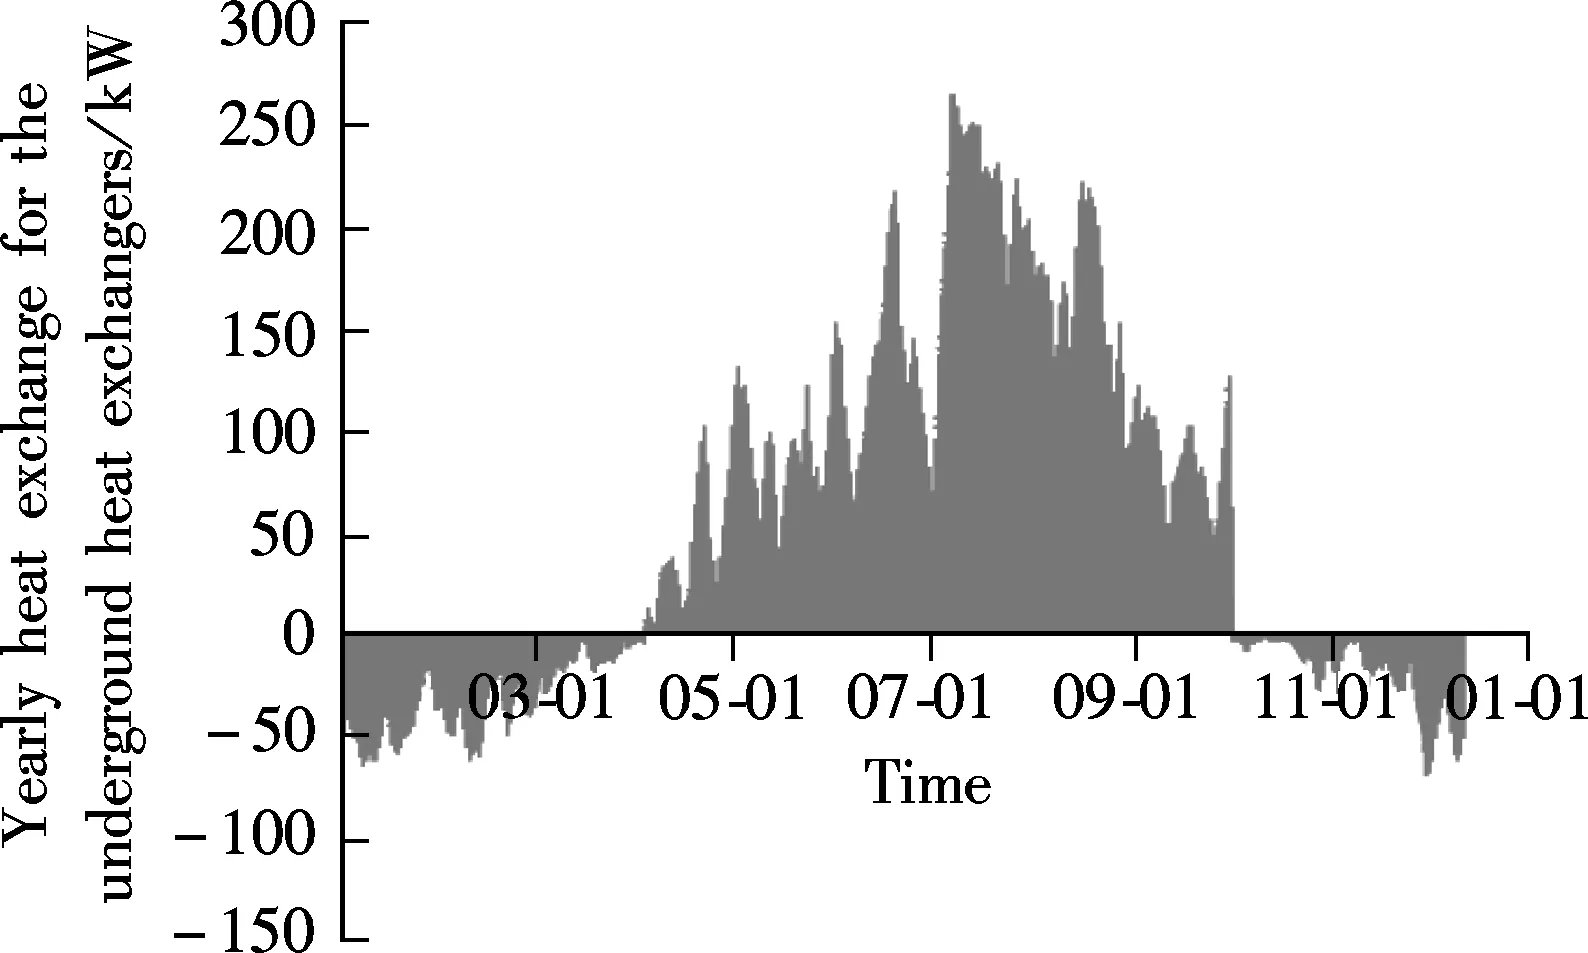
Fig.4 Heat exchange for the ground heat exchangers in one year
2.3 Numerical modeling of underground heat excha-ngers
In this case study, there are around 1700 groups of heat exchangers. The bore holes are arranged squarely, at intervals of 5 m (see Fig.5). Transfer performances of underground heat exchangers, groups and changes of the underground temperature fields under the condition of the building dynamic load are collected. Moreover, adiabatic conditions are set for the boundary conditions on the vertical walls of the square. In the modeling and simulation of underground heat exchanger groups, the following assumptions are made:
1) At the depth of 55 m, the structure parameters of 16 underground heat exchangers are all the same. Underground pipes are set as single U-shaped, high-density polyethylene pipe (PE), whose external and inner diameters are 25 mm and 20.4 mm, respectively. The diameter of the drilling borehole is 130 mm.
2) 4×4 underground heat exchangers of a 3D unsteady state heat exchanging model are simulated through Fluent. The calculated hourly heat exchanging data of the underground heat exchangers are transferred to the underground heat exchanging model by a setted program UDF.
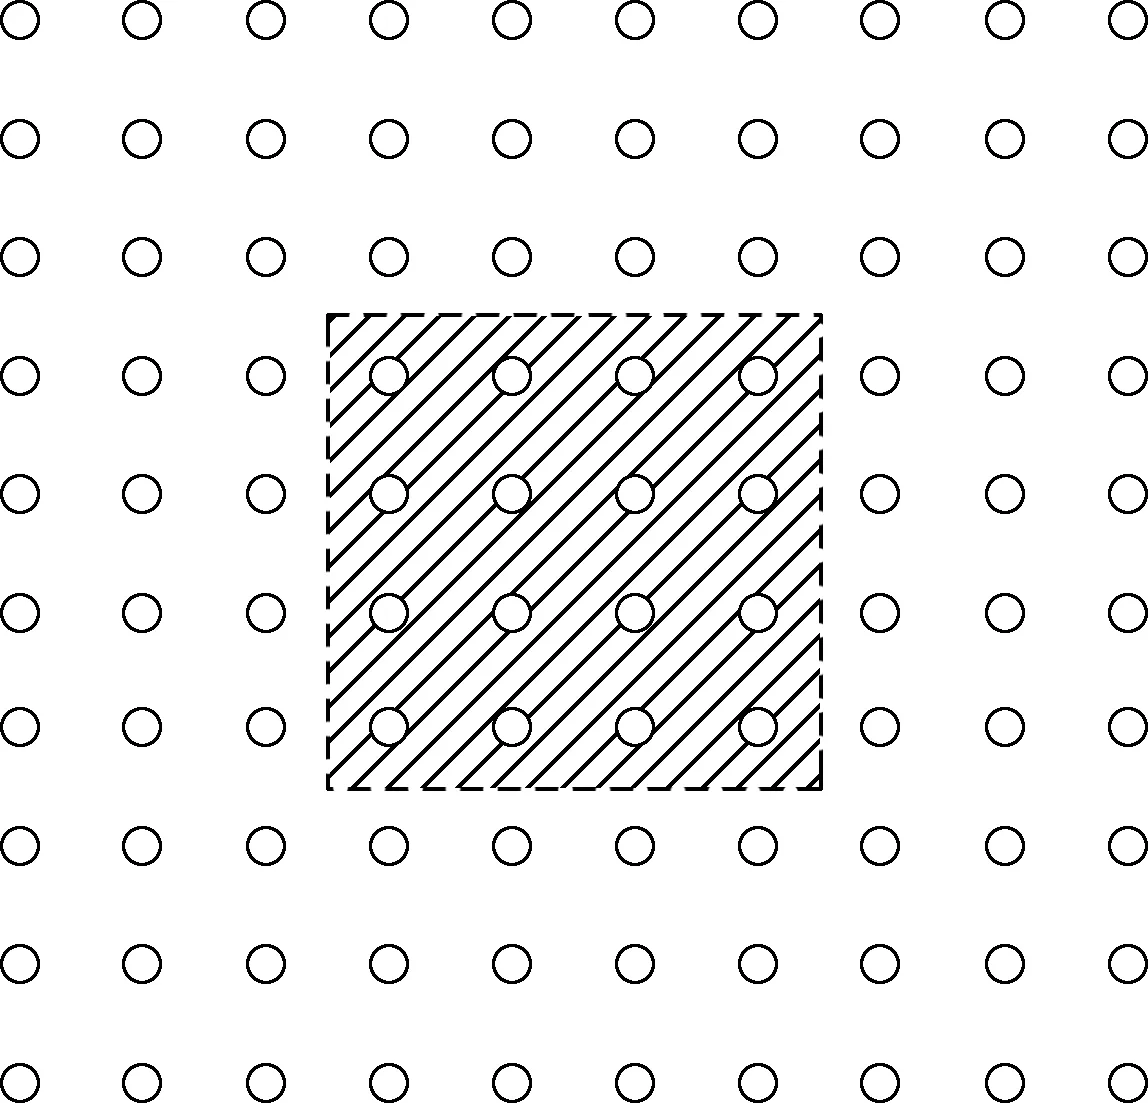
Fig.5 Underground heat exchanger arrangement
In the model, monitoring points are settled to help comparing between the actual testing data and the simulated data and to analyze the changing conditions of the ground soil temperature. The monitors are all settled 25 m below the horizon, and monitors 3 to 7 are settled successively as distances of 100, 500, 750, 1000, 2000mm away from the central tube. Monitor 4 represents the actual testing position.
This project applies a radiant ceiling combined with a replacement fresh air system. The total ratio of the cooling to the heating load is 2.43. As calculated above, taking the heat generated from the water pump, the fan and the heat pump unit into account, the ratio of cooling to heating is 5.08. Fig.6 shows the underground temperature field of monitoring points through eight years, concerning a consistent cooling coefficient. Monitor 1 collects the inlet temperatures of exchangers, and monitor 2 collects the outlet temperature of exchangers. We can see that after a period of eight years, the average temperature of underground soil increases. The average temperature of monitoring point 4, which is settled 0.5 m away from the tube, rises by 12.4 ℃ over a year. As a result, the cooling season begins at an edaphic underground temperature of 34.5 ℃ in the summer. On this occasion, the simulated average temperature of underground exchangers reaches 44.0 ℃, which will certainly reduce the GSHPs’ cooling coeffecient, or even cause an outage of the system. In this paper, we take the dynamic load information out from EnergyPlus as the dynamic input into the Fluent model by editing a UDF procedure. We find that Fluent UDF can handle at most 1500 time steps at one time. Considering almost 24h operating performance of this air-conditioning system, the time step is set to be 24 h, when dealing with the 8-year temperature field of heat exchangers in Fig.6. However, when dealing with the controlling strategies in the next part, the time step is set to be 1h in order to reflect the influence of the auxiliary equipment on exchangers more accurately.
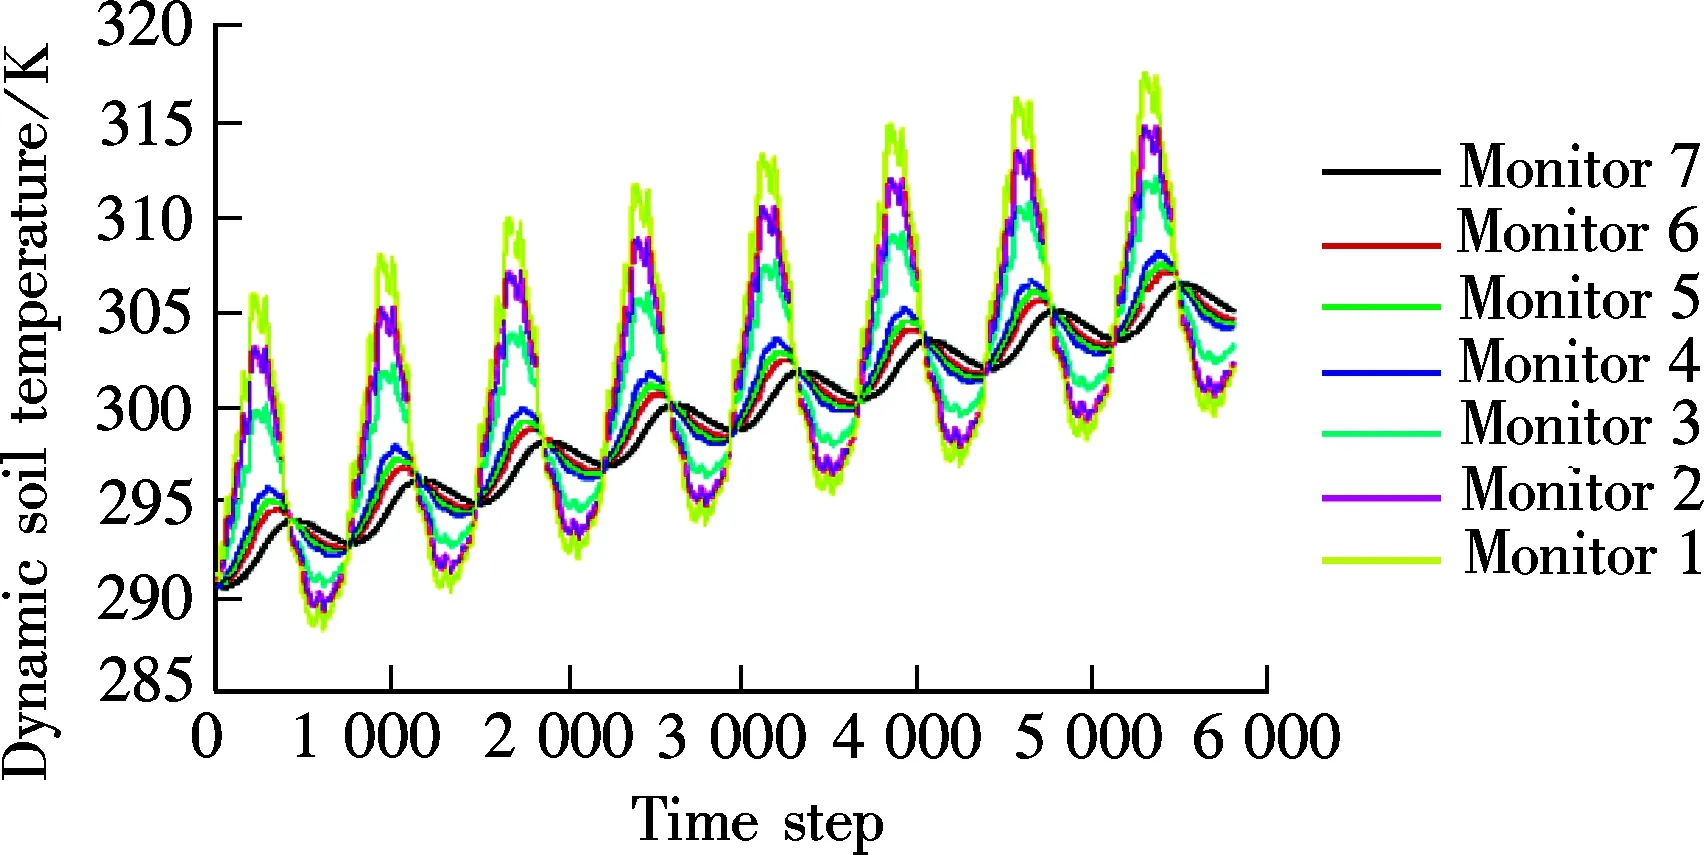
Fig.6 Temperature field of monitoring points through eight years
2.4 Reliability analysis
Reliability analysis is carried out by comparing simulated and operating parameters, in terms of the change of temperature for underground exchanger inlet, outlet and soil monitoring points. There are two temperature probes 30 m under the ground, with a distance of 0.5 m away from the center of the drill. Each of the probes reveals the change principle of temperature field underground as shown in Fig.7. The soil average temperature increases by 1.9 ℃ yearly, and the temperature difference between the highest and the lowest during a year is about 5.2 ℃. However, as shown in Fig.8, for the simulated data, the average temperature underground increases by 1.5 ℃ every year, and the temperature difference between the highest and the lowest one is about 4.8 ℃.
It can be concluded that the research method of using EnergyPlus for heat and cooling load simulation and Fluent for underground heat exchanging analysis is reliable.
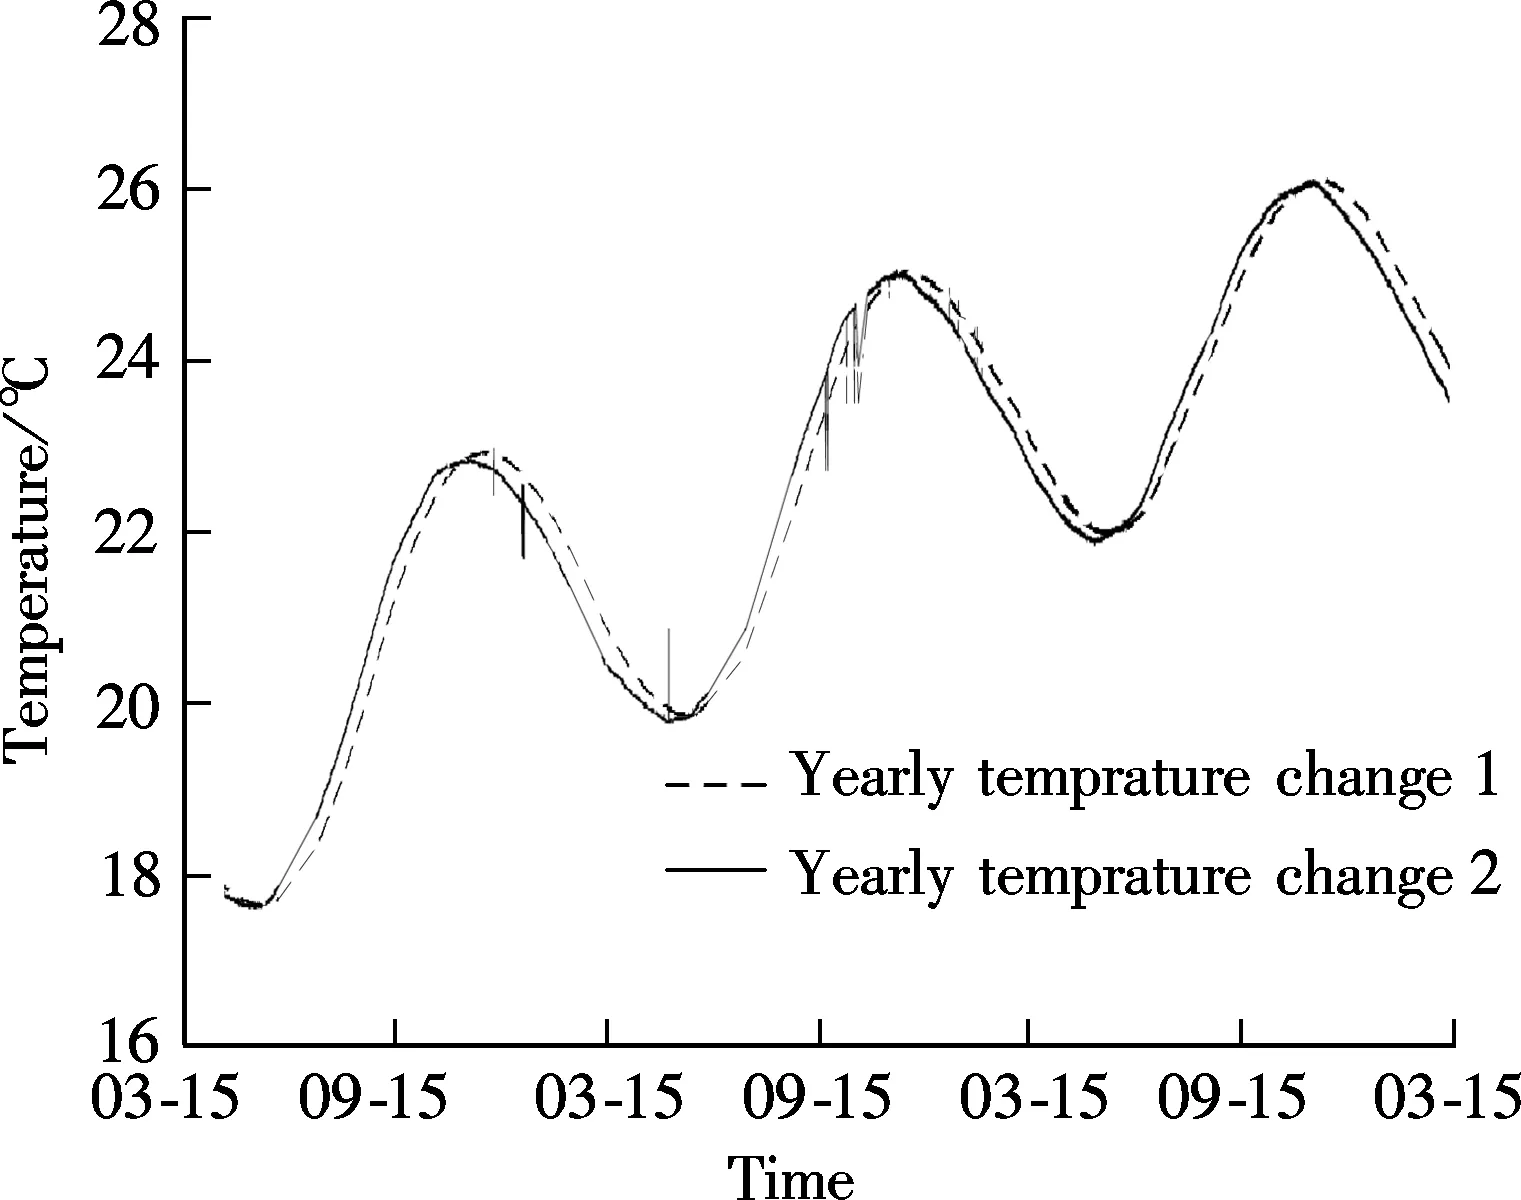
Fig.7 Experimental yearly temperature change of underground soil monitoring point
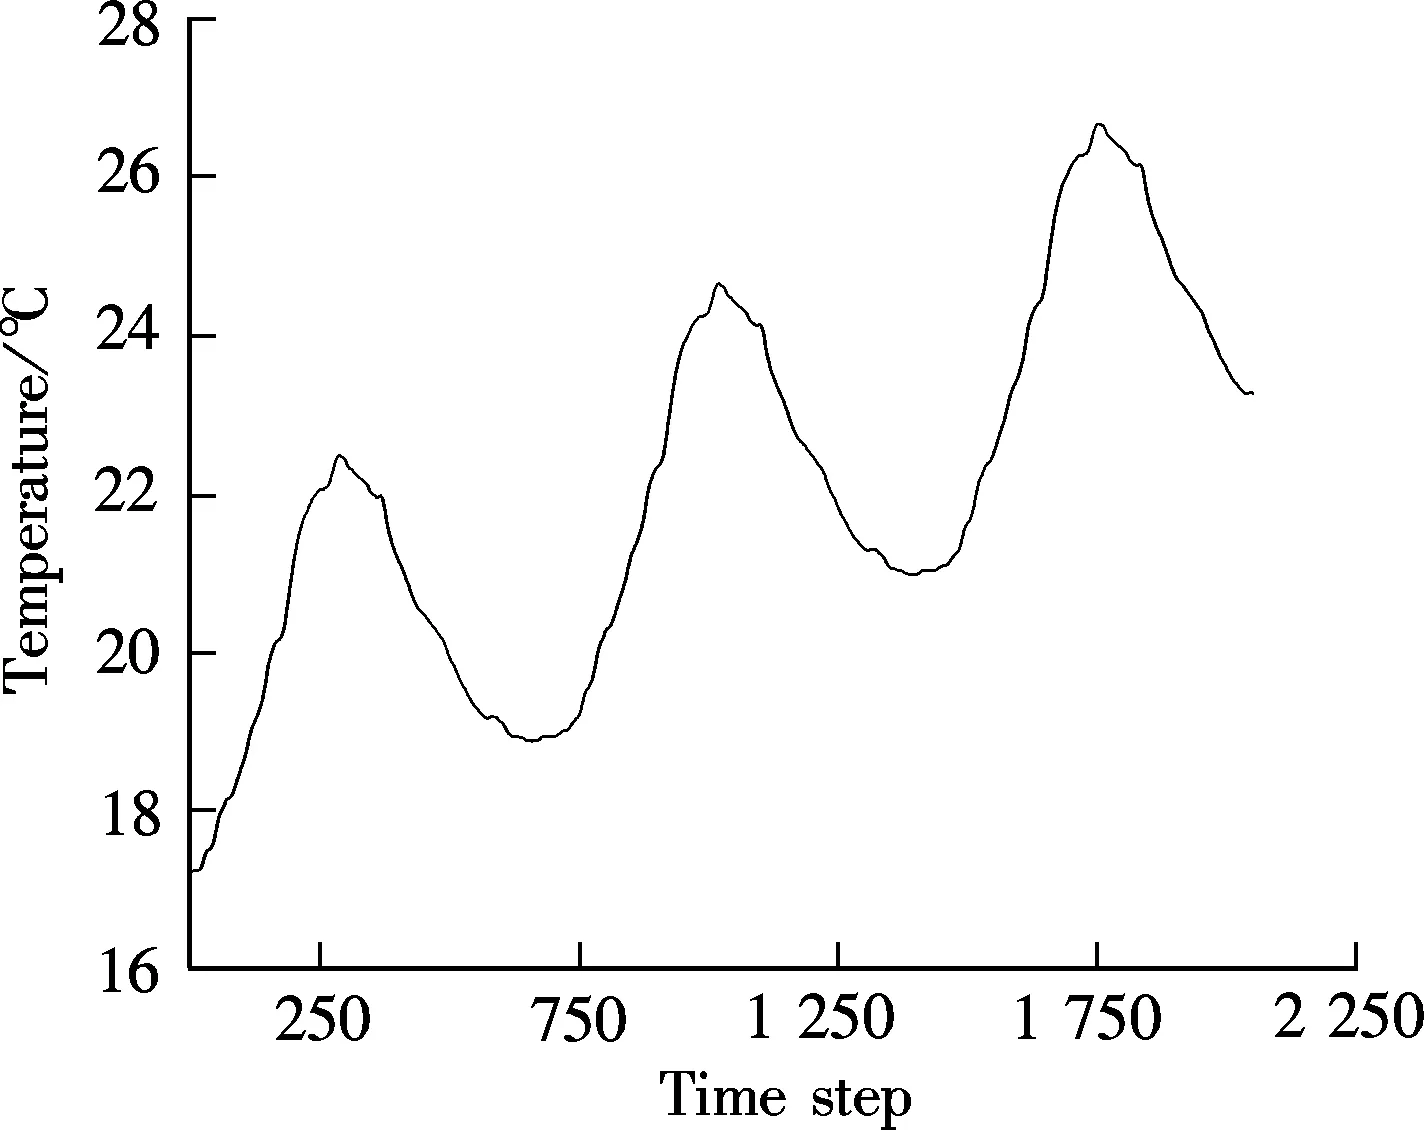
Fig.8 Simulated yearly temperature change of underground soil monitoring point
3 Control Strategy for the Auxiliary Cooling Unit
The previous analysis suggests that it is hard to maintain high efficiency depending only on the underground heat exchangers. As a result, the cooling tower units can help to reduce the imbalance between heat emission and absorption underground. In this project, a closed-circuit cooling tower unit is applied as auxiliary cooling equipment, which has a circulating water flow of 500 m3/h.
Besides the added auxiliary cooling units, a suitable control strategy is also a vital factor for reaching high efficiency of a GSHP. A suitable control strategy of the combined GSHP system may mainly focus on optimizing the running method of the auxiliary cooling units. As for the cooling unit and the cooling tower, the normal strategies include controlling the ground tubes’ inlet water temperature, the temperature differences and the starting time of the cooling tower[8-10].
3.1 Temperature control
This strategy is carried out by settling the tolerant highest water inlet temperature of the ground tubes, concerning the local weather and the construction features of the building involved.
Based on the research of Yavuzturk and Spitler[11], the cooling tower will be started when the water inlet temperature of the ground tubes is higher than 35.8 ℃. As for a project which shows an imbalance between heat emission and absorption, the running time is relatively short in the first year. As heat accumulates day by day, the cooling tower’s running time for the second year is likely to exceed that of the first year. In this way, it increases yearly, which will in return aggravate the cooling tower’s cooling burden. So, setting a suitable cooling tower starting temperature is crucial. In this paper, the water outlet temperature of the ground tubes is 30 ℃. This extends the cooling tower running time, decreases heat accumulation, and maintains a consistent operation.
Controlling the water inlet temperature of the underground tubes can maintain GSHPs running continually, while the crucial problems are setting a suitable starting temperature of the cooling tower and a proper cooling load of the tower. A simulation of eight years was done to reflect the water inlet and outlet temperatures, and the underground soil temperature field. Fig.9 reveals that an excess temperature value for the cooling tower is likely to cause underground heat accumulation. Consequently, the yearly running time and the peak cooling load of the cooling tower capacity will both increase. If the cooling capacity of the cooling tower is enough, then the combined GSHPs will not only show a proper refrigeration performance but also a higher heating coefficient.
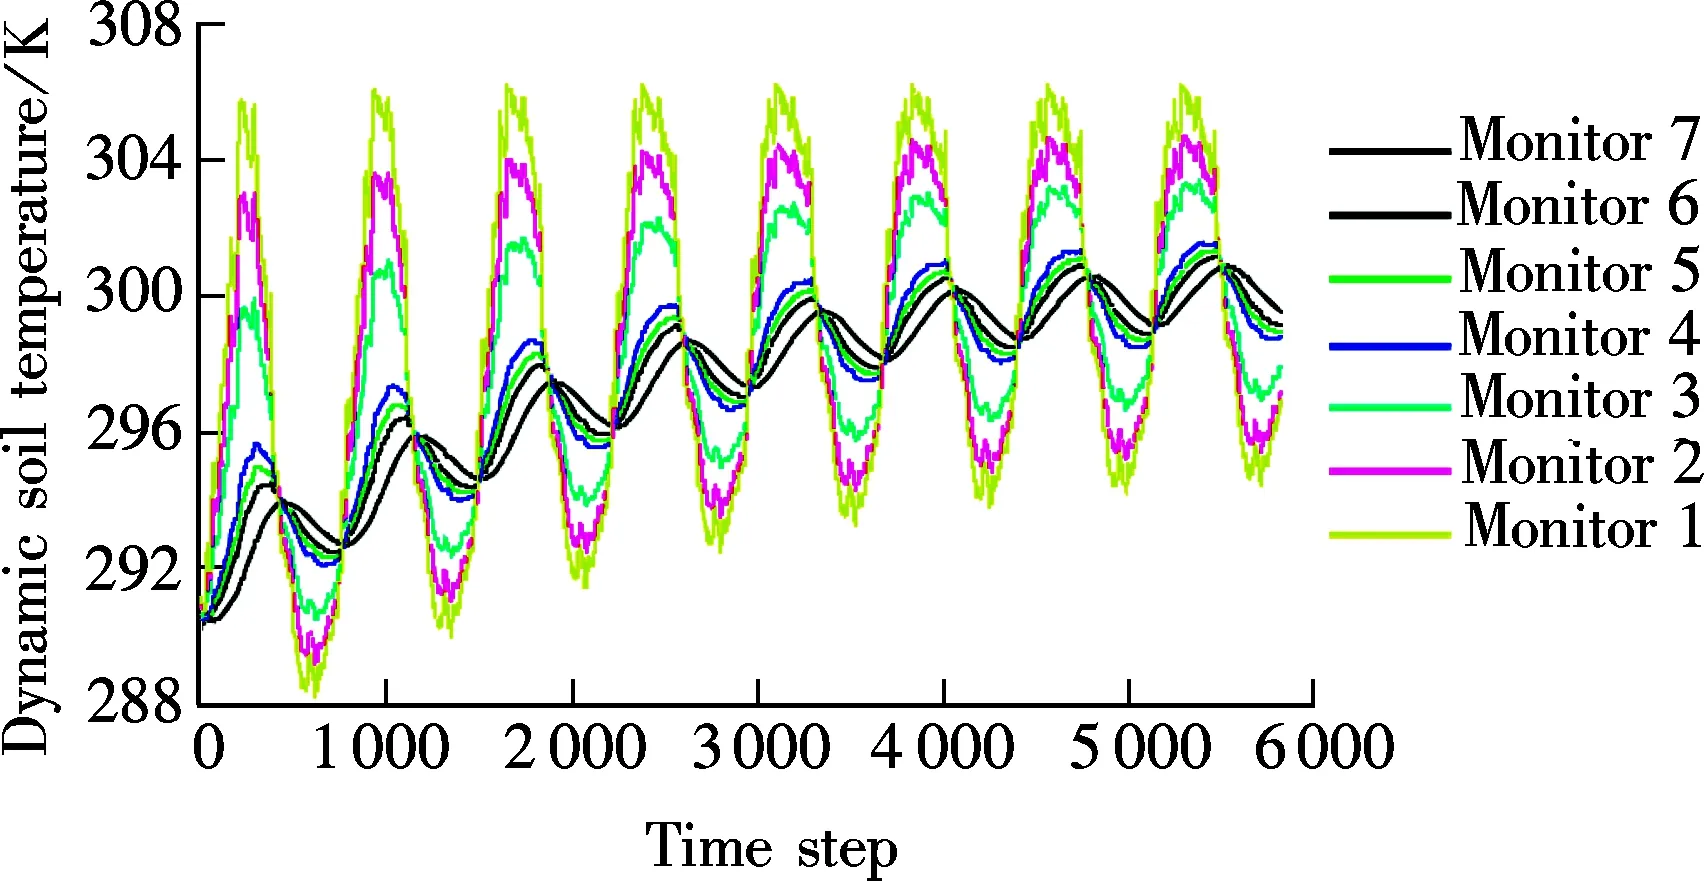
Fig.9 Inlet, outlet water and the soil monitoring temperature changes of the tubes underground
3.2 Temperature difference control
This strategy is aimed to control the difference between the inlet water of ground tubes and the ambient dry-bulb temperature. The cooling tower will start when this difference exceeds the set point.
In this strategy, the cooling tower system and its water circulating pump starts performing the auxiliary cooling when the difference exceeds the set value, which is usually set to be 2 ℃. The heat transfer model of the ground tubes is on the basis of the hourly cooling and heating load of the structure. In cold seasons, the cooling tower will be on if the water outlet temperature of the ground tubes exceeds the outdoor dry-bulb temperature by 2 ℃, which tries to make sure that the outlet cooling water exceeds the outdoor dry-bulb temperature by 1.5 ℃.
Fig.10 shows the running results for two years at steps of 1 h. When controlling the water outlet temperature of the ground tubes and the outdoor dry-bulb temperature, the shorter the controlling time step, the higher the control accuracy. However, an extreme short-time step may cause frequent cycles of on/off of the auxiliary cooling plant.
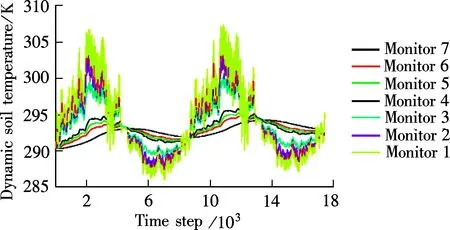
Fig.10 Inlet, outlet water and the soil monitoring temperature changes of the tubes underground
The adopted time step, 1 h, has been already proved to be a huge calculating task[6]. A two-year simulation is made to reflect the characteristics of this strategy. As shown in Fig.10, the yearly highest inlet water temperatures of the ground tube were 33.71 ℃ and 34.45 ℃, respectively, and the yearly soil (0.5 m away from the central tube) highest temperatures were 21.65 ℃ and 22.69 ℃, respectively.
It can be concluded that in this controlling strategy, the average underground soil temperature and the yearly average inlet and outlet temperature increase year by year. As a result, a proper temperature difference should be carefully determined for a specific heat pump system to maintain the balance between heat emission and absorption and a high-efficiency operation.
3.3 Timing starting control
This strategy takes the period of a relatively lower ambient temperature as the running period of the cooling tower units. This strategy, in which both the cooling tower and the underground heat exchangers run intermittently, can get rid of the heat accumulation. In this strategy, the cooling tower runs 6 h at night (00:00 am to 6:00 am) using the ambient air as an additional cooling source. The strategy contains three ways: ① Cooling tower runs from 0:00 am to 6:00 am every day all over the year; ② Cooling tower runs in January, February and March from 0:00 am to 6:00 am every day; ③ Cooling tower runs in June, July, and August from 0:00 am to 6:00 am every day.
There is an imbalance between yearly accumulated heat emission and heat absorption, and this can be solved by extending the running period of the cooling tower. Research on this strategy was made with the cooling tower running from 12:00 am to 12:00 pm from June 1st to October 15th. The ground tubes operated intermittently in order to decrease the imbalance of heat. With data acquired in the monitoring points hourly, the temperature field of four years under the timing starting control strategy can be seen in Fig.11. For the yearly cycle, the highest inlet temperature of each year inside ground tubes are 27.15, 27.80, 28.31 and 28.82 ℃, respectively, with an average rise of 0.56 ℃. This aggravates the situation of the insufficient running time of the cooling tower. At this rate, it can be indicated that the inlet temperature will rise up to 38.34 ℃ during the 20 years of the working life of the GSHP.
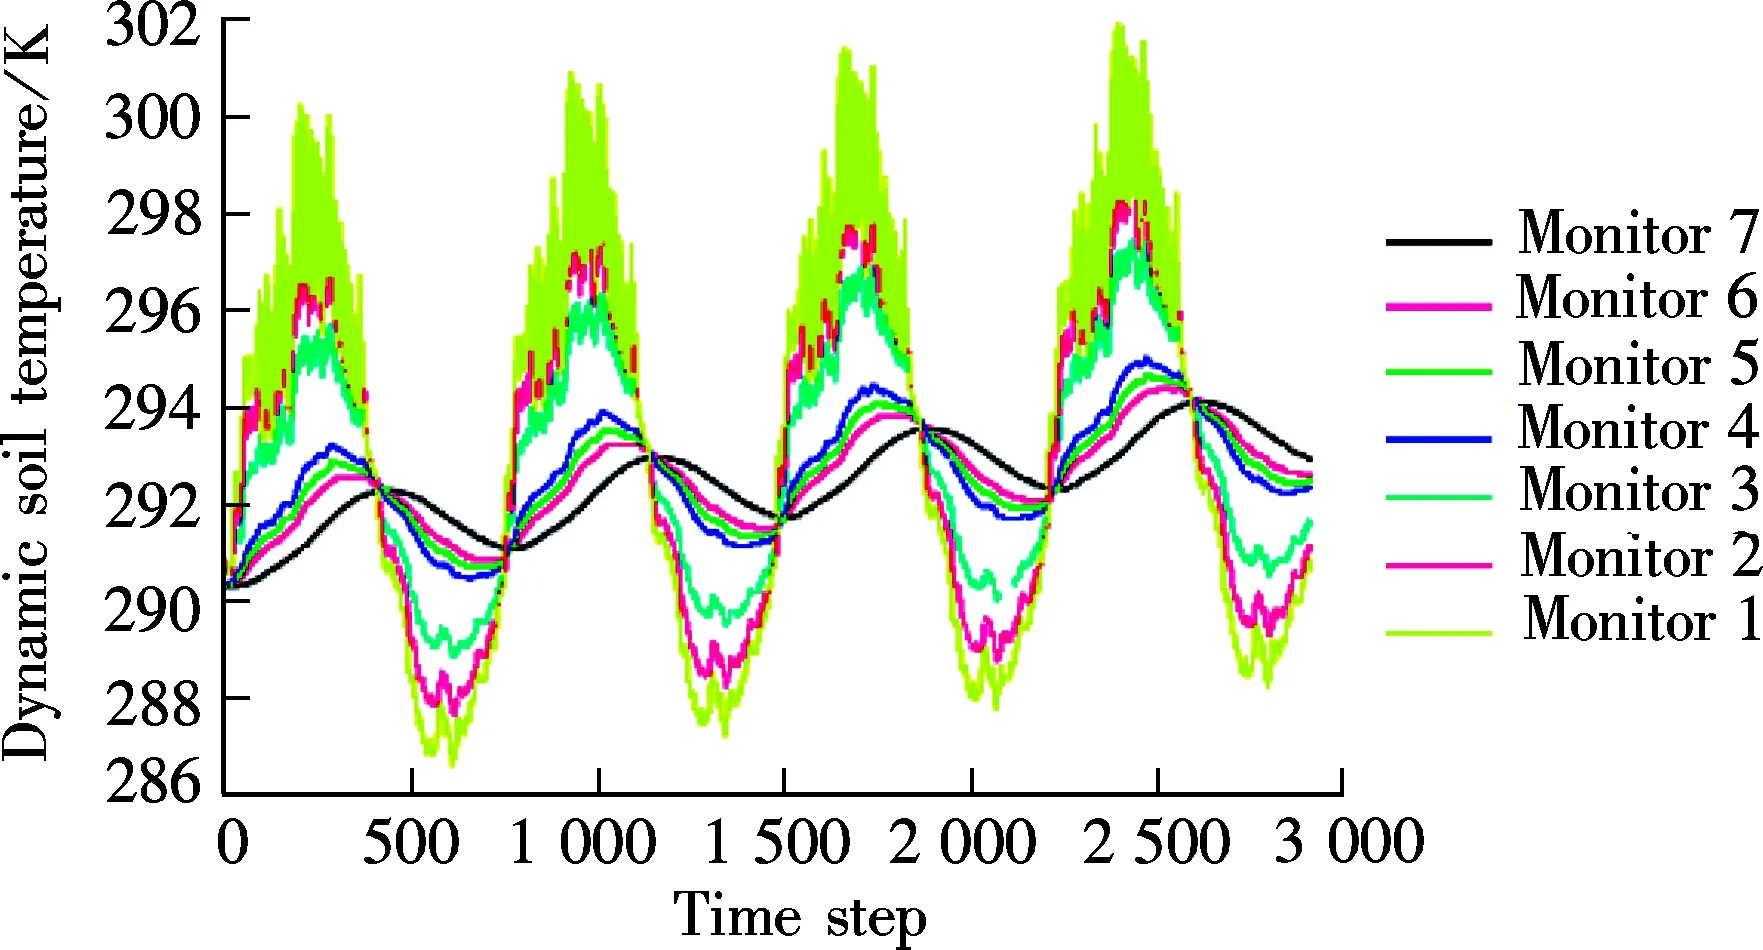
Fig.11 Inlet, outlet water and the soil monitoring temperature changes of the tubes underground
4 Conclusion
This research has revealed that, in the case study of a very large GSHP, the annual accumulated total cooling load was larger than the heating load and had a ratio of 2.43. Considering the heat generated from the water pump, the fan and the heat pump unit, the ratio of the cooling to the heating load reached the value of 5.08 in Nanjing. Thus the underground temperature field would increase continuously without auxiliary cooling plants, even resulting in the breakdown of the GSHP. After comparing the three control strategies, this study suggests that an optimized timing starting control strategy, which operates conveniently but not frequently, is the most effective method for maintaining the efficiency and reliability of a GSHP.
[1]Lombard L P,Ortiz J,Pout C.A review on buildings energy consumption information[J].EnergyandBuildings,2008,40(3):394-398.
[2]Berardi U. Sustainability assessment in the construction sector: rating systems and rated buildings[J].SustDevelopment, 2012,20(6): 411-424.
[3]Chen J, Qiao W, Xue Q. Research on ground-coupled heat exchangers[J].IntJLowCarbonTechnol, 2010,5(3): 35-41.
[4]Rawings R H D, Sykulski J R. Ground heat pumps: a technology review[J].BuildingServEngResTechnol, 1999,20(3): 119-129.
[5]Gao Qing,Li Ming,Yu Ming, et al. Review of development from GSHP to UTES in China and other countries[J].RenewableandSustainableEnergyReviews,2009,13(1):383-394.
[6]Chen Y, Chen J U, Berardi B, et al. A multi-integrated renewable energy system in a commercial building in Beijing: lessons learnt from an operating analysis[J].IntJLowCarbonTechnol, 2012,7(3): 192-198.
[7]Qiao W. Sustainable operation properties of GSHPs based on building energy analysis used Energyplus[D]. Nanjing: School of Energy and Environment, Southeast University, 2011.
[8]Zhang Y, Zhou E, Cui H. A hotel’s hybrid ground source heat pump system design in Ningbo[J].HeatingVentilating&AirConditioning, 2007,37(12): 91-96.
[9]Hikari F, Ryuichi I, Takashi I. Improvements on analytical modeling for vertical U-tube ground heat exchangers[J].GeothermResourcesCouncilTrans, 2004,28(15): 73-76.
[10]Qiao W. Research on ground-coupled heat exchangers[J].InternationalJournalofLow-CarbonTechnologies, 2010,7(5): 35-41.
[11]Yavuzturk C, Spitler J D. Comparative study of operating and control strategies for hybrid ground-source heat pump systems using a short time step simulation model[J].ASHRAETrans, 2000,106: 192-195.
杂志排行

Journal of Southeast University(English Edition)的其它文章
- Uplink capacity analysis of single-user SA-MIMO system
- A broad-band sub-harmonic mixer for W-band applications
- Feature combination via importance-inhibition analysis
- Transmission cable fault detector based on waveform reconstruction
- Force measurement between mica surfaces in electrolyte solutions
- Flexural behaviors of double-reinforced ECC beams