大气成分研究进展
2012-07-07
大气化学和大气成分
Atmospheric Chemistry and Atmospheric Composition
大气成分研究进展
2012年,大气成分研究所圆满完成了承担的各项任务,在分析方法建立、比对校验、质量控制,大气成分及相关特性的观测、模式发展应用,影响评估等方面均取得了明显的进展。
1 分析方法、比对校验和质量控制研究
1.1 大气有机物热脱附-全二维气相色谱-氢火焰离子化分析方法
全二维气相色谱(GC×GC)是20世纪90年代发展起来的具有高分辨率、高灵敏度、高峰容量等优势的分离技术,在我国将其用于大气挥发性有机物(VOCs)的研究才刚刚起步。将GC×GC与氢火焰离子化检测器(FID)联用,构建了用于测量大气有机物的热脱附-全二维气相色谱-氢火焰离子化分析系统(TD-GC×GC-FID)。采用HP-5MS和HP-INNOWAX色谱柱,建立了C5~C15大气有机物分析方法,实现了一次分析过程同时分离非甲烷烃(NMHCs)、含氧挥发性有机物(OVOCs)和卤代烃等多种组分。利用标准物质和4级杆质谱(qMS)进行定性,外标法结合FID质量校正因子定量。目标物在GC×GC谱图中第一和第二维保留时间变化分别小于0.6 s和0.02 s,峰体积平均相对标准偏差为14.3%,其中烷烃和芳香烃为4.5%。标准曲线r2均值大于0.99,平均检出限为6.04 ng,平均回收率为111%。利用该方法检测到2010年1月北京市区大气中400多种有机物(信噪比大于50),鉴定了其中的103种物质,包括烷烃、烯烃、芳香烃、卤代烃、醛、酮、酯、醇和醚等。(王瑛)
1.2 大气氢氟碳化物采样分析和质量控制方法
用自组装采样系统冲洗双口不锈钢采样罐,并采集大气样品至1.36×10⁵Pa,在实验室利用自组装气相色谱-质谱联用(GC-MS)系统分析样品,对6种主要氢氟碳化物(HFCs)分析的精度为0.24%~ 1.02%。空白实验表明,采样-分析过程未引入污染。通过压力-体积曲线对进样压力变化的影响进行了校正。回收率实验及存储实验表明,6种HFCs回收率范围为99.5%~100.4%,存储112天内HFCs浓度没有显著变化。在北京上甸子区域大气本底站采集80 m梯度塔顶大气样品并分析,2个串联采样罐HFCs浓度差值范围为0.04×10⁻¹²~0.16×10⁻¹²。采样分析与同期该站GC-MS在线观测系统获得的HFCs浓度差值范围为-0.86×10⁻¹²~-0.17×10⁻¹²。本研究建立的采样-分析-质量控制方法和流程适用于大气中HFCs高精度观测。(姚波)
1.3 北京上甸子站气相色谱法大气CH4和CO在线观测方法研究
参照青海瓦里关全球大气本底站气相色谱在线观测系统的设计,通过系统调试、测试和参数优化,于2009年在北京上甸子区域大气本底站建立了高精度气相色谱法大气CH4和CO在线观测系统。该系统对CH4和CO的测量精度分别优于0.03%和0.45%,达到世界气象组织全球大气观测计划( WMO/ GAW) 的质量目标。研究建立了与该系统配套的标气选取方法及运行序列∶选取可基本涵盖该站大气CH4和CO浓度范围的2瓶标气作为工作标气,其中CH4浓度分别为2007.1×10-9和1809.5×10-9(摩尔分数),CO浓度分别为405.6×10⁻⁹和123.8×10⁻⁹,在高低浓度工作标气之间穿插分析3 次大气样品,能够保证测量的准确度(观测浓度的标准偏差CH4<1.7×10⁻⁹和CO<1.0×10⁻⁹),同时可最大程度地节省工作标气。该方法已应用于华北地区本底大气CH4和CO的高精度连续观测。(周凌晞)
1.4 水汽对光腔衰荡光谱系统(CRDS)法测定CH4的影响
分析了利用光腔衰荡光谱系统(CRDS)法测定CH4浓度与水汽含量的关系,并建立了水汽含量在0.50%~2.45%(体积比,下同)范围内的有效校正方法。采用CRDS法对水汽含量为0.93% 的CH4标气进行多次测量,测量值经校正后与理论值的偏差均小于2.0×10⁻⁹,最大偏差1.8×10⁻⁹,优于大气本底CH4观测质控标准。校正瓦里关站CRDS系统试运行期间的CH4实测数据(水汽含量为0.50%~2.45%),与该站气相色谱-氢火焰离子化检测器系统(GC-FID)同期测量结果相比,38.48%的数据偏差小于2.0×10⁻⁹,说明在系统未配备超低温冷阱除水单元之前,此方法适用于观测数据的校正。(周凌晞)
1.5 两种探空仪观测湿度垂直分布及其应用比较
对2010年8月在云南腾冲利用芬兰Vaisala RS80探空仪和低温霜点仪(CFH)测量大气湿度的垂直分布进行对比分析,同时比较二者白天和夜间测量误差的差别。结果表明,RS80湿度测值在整个对流层比CFH 测值偏干(23.7±18.5)%;因太阳辐射白天RS80偏干较夜间更明显,比夜间偏干(13.5±14.8)%。而在对流层上层向平流层过渡区域内RS80湿度数据基本无效。CFH 在低温、低湿环境下对湿度能有效测量,但在湿度较高的对流层低层测值偏高,导致CFH水汽总量平均比GPS遥测的水汽总量偏高(4.3±2.0)mm(样本数为11),而RS80、GTS1与GPS的水汽总量差别分别是(0.2±1.4)mm(样本数为12)和(-0.2±2.2)mm(样本数为43)。地基GPS遥测的水汽总量对对流层上层至平流层的水汽变化不敏感。由于RS80测量相对湿度在高空偏低,通过RS80相对湿度测值来确定中、高云结果是偏低的,特别是对6000 m 以上的高云判别,RS80相对湿度的探测几乎很难甄别到云的存在。(郑向东)
1.6 塔克拉玛干沙漠地区气溶胶光学厚度卫星遥感产品验证
基于塔克拉玛干沙漠地区地基太阳光度计数据,系统验证了2007—2008年星载多角度成像光谱仪(MISR)、中分辨率成像光谱仪(MODIS)和臭氧监测仪(OMI)气溶胶反演产品,旨在定量评估这些产品在我国沙漠地区的气溶胶光学厚度(AOD)反演精度。结果表明:MODIS/AOD的相关系数在4种产品中最高(0.91),OMI/AOD次之(0.87),其次为MISR/AOD(0.84), OMI/UVAI相关系数偏低(0.51);MISR/AOD均方根误差(0.14)和平均偏差(-0.06)在4种反演产品中最低;与地基观测相比,MISR/ AOD、MODIS/AOD系统偏低,OMI/AOD、OMI/UVAI系统偏高;塔克拉玛干沙漠春夏季AOD较大,秋冬季AOD相对较小。Angstrom波长指数春季(3—5月)最小(均值为0.11),夏季(6—8月)次之,秋季(9—11月)和冬季(12月至次年2月)较大(均值达到0.61),这表明在春夏季气溶胶粒子偏大,秋冬季气溶胶粒子偏小。研究2000—2010年AOD年际变化表明,由于塔克拉玛干沙漠地区属于沙尘源区,气溶胶类型较为单一,总体来说,变化趋势不明显。从反演结果来看,2003年的气溶胶含量为此10年中最高,年均值达到0.32;2005年的气溶胶含量在这10年中最低,年均值为0.28。(车慧正)
1.7 中国东部地区颗粒物(PM)遥感定量反演神经网络算法研究
近年来中国区域的大气污染情况日趋严重,大气污染监测与治理已刻不容缓。由于卫星遥感具有空间覆盖广和成本低等优点,卫星遥感反演气溶胶光学厚度(AOD)产品被普遍认为是地面PM2.5浓度的重要指标,且已被广泛地应用于地面PM2.5遥感监测。本研究利用2007—2008年的MODIS/Terra气溶胶光学厚度产品,考虑中国东部地区5个大气成分站点的风速、风向、温度、湿度和边界层高度等气象数据,构建后向(BP)神经网络,提出了基于MODIS AOD产品估算PM2.5的模型。利用5个大气成分站点PM2.5观测数据对模型进行散点拟合和时间序列拟合验证。结果表明:(1)从PM2.5观测值与估算值的散点回归分析来看,PM2.5估算值与观测值相关系数最好的为庐山站(R=0.6),其他4个站次之,但其相关系数均在0.4(中强相关)以上;(2)从PM2.5观测值与估算值的时间序列对比分析来看,PM2.5估算值和观测值差值随时间变化而变化,且存在明显的日际振荡现象,但经相邻5天滑动平均处理,5个站点的PM2.5估算值与观测值相关系数得到普遍提升,滑动后的相关系数(RMA)均在0.7以上(除郑州外),庐山站RMA达到0.83。表明在BP网络框架下,本研究提出的基于MODIS AOD产品估算PM2.5的模型能较好地应用于PM2.5的监测。(郭建平)
1.8 大气本底站反应性气体观测数据处理系统功能设计及实现
基于反应性气体多年观测的较为成熟的数据处理和质量控制方法,采用模块化功能结构设计,通过应用Visual Studio开发平台并结合MAP WinGIS等空间和时间显示控件,设计和开发了反应性气体观测数据处理系统。系统实现了观测数据在空间和时间上的可视化,业务应用表明,具有良好的人机交互和数据处理能力,具备一定的数据统计分析功能。系统实现了对大气本底站反应性气体观测数据的统一管理和综合处理,已成为大气成分观测数据质量控制业务系统的一个重要组成部分。(徐晓斌)
2 大气成分及相关特性变化的观测研究
2.1 中国大气气溶胶的组成:时空分布、化学特征、区域霾分布
通过野外观测和实验室分析研究,得到了中国各主要区域气溶胶的化学组成特征。由于各区域所处地理环境、人口密度及工业发展程度的不同,气溶胶的排放来源也不同,最终导致了各区域气溶胶化学组分的差异。对各区域综合分析结果表明,我国气溶胶中沙尘气溶胶占有较高比例(约35%),硫酸盐、有机碳、黑碳、硝酸盐和铵盐所占比例分别为16%、15%、3.5%、7%和5%。矿物气溶胶(包括沙尘、城市逸散性粉尘和煤烟尘等)是中国大气中含量最大的组分,其主体的变化受到天气气候自然变率的控制。与黑碳同源的有机碳中55%~60%是二次转化的有机碳气溶胶(SOC)。SOC的测定、估算和在数值模式中的准确描述不确定性很大,是影响当今国际上准确估算气溶胶冷却效应的一个重要因素。中国的大气中硝酸盐约占7%,铵盐约占5%,此两类气溶胶的气候冷却效应也不容忽视。综合分析得到了中国气溶胶散射性强、冷却效应大的重要结论。近50年的地面能见度资料显示,我国霾已经呈现出区域分布的特征。其中4个比较严重的区域是:(1)华北平原,包括京津快速发展的经济区以及河北、山东、河南,关中平原因能见度变化类似也归在此区;(2)华东区域,以长三角快速发展的经济区为主体,涵盖湖北、安徽、江苏、上海和浙江;(3)华南区域,以珠三角快速发展的经济区为主体,包括广东和广西;(4)西南区域,主要是四川盆地。这些区域能见度的恶化与大气污染物的排放量变化和高浓度的气溶胶浓度密切相关。(张小曳)
2.2 北京亚微米气溶胶粒径分布季节变化特征
利用气溶胶质谱仪(Q-AMS)对北京2008年不同月份(1、4、6 和10 月)亚微米气溶胶(PM1)特性进行观测试验。获得了PM1 及其主要化学组分硫酸盐、硝酸盐、铵盐、有机物的质量浓度和粒径分布数据, 总结了亚微米气溶胶化学组分和粒径分布的季节变化特征。研究表明, 亚微米气溶胶质量浓度夏季最高, 秋季最低。有机物浓度在四季中占PM1的比例(36%~58%)高于其他物种, 在冬季浓度最高。硫酸盐、硝酸盐和铵盐平均浓度次之, 3种物种在夏季浓度最高, 其次为春季, 秋冬季最低。利用主因子分析方法将有机气溶胶解析为碳氢类有机气溶胶(HOA)和氧化性有机气溶胶(OOA)两类。HOA浓度在冬季最高, 占有机气溶胶总量的70%左右。OOA 浓度在夏季最高, 秋冬季较低。四季中主要化学组分质量浓度的日变化规律表现为夜间高, 日间低的特点。HOA 傍晚到夜间浓度变化幅度明显大于其他物种,其浓度在中午出现峰值,可能与北京餐馆排放有直接关系。OOA 以及硫酸盐、硝酸盐、铵盐和氯化物的日变化特点接近, 09∶00 —13∶00 之间浓度出现上升趋势, 午后有所下降。亚微米气溶胶主要化学组分粒径分布峰值均出现在500~600 nm之间。有机物质量谱分布范围较其他物种宽, 尤其是秋冬季质量谱分布更宽。硫酸盐、硝酸盐和铵盐在春、夏、秋3季的平均粒径分布特点相似, 而冬季谱分布较其他季节要宽, 峰值粒径偏小。在粒径<200 nm的范围内, 有机物占亚微米气溶胶总量60%以上, 粒子越细, 有机物占的比例越大, 冬季有机物在观测粒径范围内占PM1 的50%以上。 春、夏、秋3季HOA 在<200 nm粒径范围内占优势, 而OOA 则在>300 nm粒径范围内占有相对优势。(张养梅)
2.3 天津武清地区云凝结核变化特征
利用2009年11—12月在天津武清气象局测量的云凝结核(CCN)浓度资料以及气溶胶数谱分布的观测资料,分析了武清地区在不同过饱和度(0.1%~1.0%)下云凝结核浓度及活化率的变化特征。结果表明:武清地区冬季CCN数浓度变化范围很大,过饱和度为1%时,浓度变化范围为4000~32000cm-3,且浓度受风速影响明显,风速2级以下CCN数浓度很高,过饱和度为1%时,其平均浓度可达16000 cm-3,但对于4级风速以上CCN平均浓度为4000 cm-3左右;在过饱和度0.1%~0.4%间CCN浓度变化较大,过饱和度每增加0.1%,CCN浓度增加值平均约为过饱和度0.4%~1.0%间浓度增量的5倍。低过饱和度(0.1%、0.2%)下,活化率受风速影响明显,1级风速下的CCN活化率约为4级风速下的3倍,但在过饱和度1%时活化率则相差不大。CCN浓度的日变化呈双峰型,峰值时刻为北京时间08∶00和18∶00左右,活化率的日变化则呈双谷型,主要是受局地排放影响的结果。利用指数函数拟合各风速下CCN浓度过饱和度谱,表明该地谱型为典型的大陆型。(孙俊英)
2.4 上甸子区域大气本底站卤代温室气体源区特征分析
利用美国NOAA研制的拉格朗日粒子扩散模型HYSPLIT和聚类分析方法,对上甸子站2008—2010年逐日4个时次5天的后向轨迹按季节分类,结合上甸子站卤代温室气体CFC-11、CFC-12、HCFC-22、SF6等的在线浓度观测数据,分析了不同季节不同输送轨迹对该地区卤代温室气体浓度的影响。利用上甸子站风场资料结合同期浓度观测数据,计算分析了CFC-11、CFC-12、HCFC-22、SF6等的浓度载荷。轨迹聚类分析结果表明,占有较高比例、移动缓慢、垂直高度低的偏南气团组,一直在边界层下部缓慢移动,有利于污染物在边界层内的累积,其对应的上述卤代温室气体平均浓度在各组中一致最高,而移动快速、垂直高度高的西北气团组对应的卤代污染物平均浓度都一致较低。浓度载荷结果表明,西西南和西南是各卤代物种的最高浓度载荷方位,北东北和北是最低浓度载荷方位,偏西南-南-东南是高浓度载荷扇区,偏西北-北-东北是低浓度载荷扇区。轨迹聚类分析和浓度载荷结果都表明,上甸子测站的东南、偏南及西南区域是上述卤代物种的高污染源区,反映了这些高排放地区的人类源在区域尺度上对上甸子测站的输送影响,而西北、偏北和东北区域是测站的相对清洁区。(安兴琴)
2.5 上甸子区域本底站大气氢氟碳化物和全氟化碳在线观测
2010年5月至2011年5月,在上甸子区域本底站对大气中的氢氟碳化物(HFCs)和全氟化碳(PFCs)进行了在线观测。 5种HFCs和3种PFCs的时间序列都出现高浓度污染事件,本底数据百分比36%(HFC-32)至83%(PFC-218)。观测期间各物种平均浓度分别为24.5×10⁻¹²(HFC-23)、5.86×10⁻¹²(HFC-32)、 9.97×10⁻¹²(HFC-125)、 66.0×10⁻¹²(HFC-134a)、 9.77×10⁻¹²(HFC-152a)、79.1×10⁻¹²(CF4)、4.22×10⁻¹²(PFC-116)和0.56×10⁻¹²(PFC-218)。上甸子站浓度水平同北半球中高纬度其他站点一致。东北来向大气对HFCs/PFCs载荷贡献为负,而西南方向(城市扇区)贡献为正。采用CO作为示踪物,利用示踪物比值相关法计算了我国HFCs/PFCs年排放量分别为:(3.6±3.2) kt(HFC-23)、(4.3±3.6)kt (HFC-32)、(2.7±2.3) kt (HFC-125)、(6.0±5.6) kt (HFC-134a)、(2.0±1.8)kt (HFC-152a)、(2.4±2.1) kt (CF4)、(0.27±0.26) kt (PFC-116)和(0.061±0.095) kt (PFC-218)。同早期的研究结果相比,HFC-23排放量降低,原因是自2005年开始,HFC-23通过清洁发展机制(CDM)项目开始减排。(姚波)
2.6 我国4个WMO/GAW 本底站大气CH4浓度及变化特征
利用基于光腔衰荡光谱( CRDS) 技术自组装的大气CH4在线观测系统,2009—2010年在青海瓦里关、浙江临安、北京上甸子和黑龙江龙凤山4个世界气象组织全球大气观测网( WMO/GAW) 大气本底站对大气CH4进行了在线观测。临安站在所有季节中CH4浓度都表现出类似的日变化趋势,即浓度在每日05∶00(北京时间)达到最高值,在14∶00最低。夏季龙凤山站CH4浓度表现出类似的规律,但其日变化振幅较大,达到216.8×10⁻⁹(摩尔分数)。上甸子站春、秋、冬季CH4浓度呈现类似变化趋势,但夏季日平均值较高,在晚间20∶00达到最高值,瓦里关站四季CH4浓度日变化均不明显。3个区域本底站(临安、上甸子和龙凤山)全年CH4本底浓度存在明显的变化,临安站CH4本底浓度在7月达到全年最低水平。龙凤山站则表现出相反的趋势,在8月达到全年最高值,其全年浓度表现出“W”型变化。冬季龙凤山和上甸子站CH4浓度高于春季和秋季。瓦里关站全年浓度变化较小,月平均浓度振幅仅为11.5×10⁻⁹。临安、上甸子和龙凤山3个区域本底站夏季CH4非本底数据占总数据的比例>70%。为分析气团传输的影响,对4个站夏季高浓度时刻(瓦里关CH4>1870×10-9,龙凤山CH4>2100×10-9,临安CH4>2150×10-9,上甸子CH4>2050×10-9)对应的气团轨迹进行聚类分析表明,夏季出现的高浓度CH4观测数据可能主要由气团传输引起。(方双喜)
2.7 云南香格里拉本底站大气CH4体积分数及变化特征
利用基于光腔衰荡光谱(CRDS)技术自组装的大气CH4在线观测系统,2010年7月至2011年10月在云南香格里拉大气本底站对大气CH4进行了在线观测。结果发现,该站春、夏、秋和冬季CH4平均本底值分别为(1850.7±6.9)×10-9(体积分数,下同)、(1850.9±13.4)×10-9、(1865.6±16.1)×10-9和(1839.2±6.5)×10-9。全年体积分数在9月最高,12月最低,月均值振幅约39.6×10⁻⁹。四季日平均最低值均出现在14∶00—16∶00。日变化振幅在冬季最小,秋季最大,分别为4.4×10⁻⁹和10.0×10⁻⁹。西南来向的地面风会明显抬升CH4体积分数,而北偏东来向的地面风显著降低观测结果。通过四季每日整点后向轨迹聚类计算,结合观测资料分析发现,该站CH4主要受西南来向气团传输影响,尤其在春、夏、秋季。(方双喜)
2.8 云南香格里拉本底站大气CO2浓度及变化特征初步研究
利用基于光腔衰荡光谱(CRDS)技术自组装的大气CO2在线观测系统,2010年9月至2011年8月在云南香格里拉大气本底站对大气CO2进行了初步观测。该站春、夏、秋和冬季CO2平均本底浓度分别为394.78×10⁻⁶(物质的量之比,下同)、386.82×10⁻⁶、386.46×10⁻⁶和390.74×10⁻⁶。全年浓度在4—5月最高,7月最低,全年月均值振幅约12.22×10⁻⁶。四季浓度日平均最高值出现在07∶00左右,最低值出现在14∶00—17∶00之间。日变化振幅在冬季最小,夏季最大,分别为1.51×10⁻⁶和21.82×10⁻⁶。四季西南来向的地面风对CO2浓度均有明显的降低作用。通过四季每日整点后向轨迹聚类计算,结合浓度资料分析发现,该站春、夏、秋季来自于西南方向的气团降低了观测的CO2浓度,而在冬季未起到明显的降低作用,主要因该站局地植被生态系统排放减少所致。(方双喜)
2.9 华北地区上空“大气污染氧化池”
2006年开展的野外观测试验结果表明,华北地区大城市和工业污染排放易在该地区中心上空汇集,有益于大气OH自由基维持在较高的浓度水平。这些OH自由基使大气中挥发性气体(如SO2,NO2和VOCs)氧化成低挥发性的无机酸或含氧有机物,加速大气中的气-粒转化过程。因此,华北地区低空不仅污染十分严重,而且还具有“大气污染氧化池” 的作用。(马建中)
2.10 我国华北及长三角地区近几年SO2变化趋势
近年来我国实施了较严格的燃煤脱硫措施,火电厂SO2排放得到遏制。此外,与2008年北京奥运会相关的减排措施也使华北区域的污染排放显著减少。本研究关注这些措施在大气SO2浓度方面带来的实际效果,以华北地区和长江三角洲为例开展研究。
对近些年华北地区不同类型站点SO2浓度的变化特征分析表明,在北京城区的中国气象局站、河北农村的固城站以及华北地区上甸子区域大气本底站SO2平均浓度(±标准偏差)分别为 (16.8±13.1) ×10-9、(14.8±9.4) ×10-9和( 7.5±4.0) ×10-9。冬季取暖期的SO2浓度约为夏季的4~6倍。各站点SO2日均值存在高度显著的相关性,表明SO2污染的区域性特征。所有站点SO2均在白天出现峰值,很可能与华北上空高SO2浓度气流的向下混合或水平输送有关。北京城区中国气象局站和河北农村固城站的SO2存在显著的下降趋势,分别为每年-4.4×10⁻⁹和-2.4×10⁻⁹, 而上甸子本底站只有微小的下降趋势 (-0.3×10⁻⁹),表明华北区域背景的降幅并不大。各站SO2浓度在2008年北京奥运会污染控制措施之后均有显著下降,且在2009年未见反弹,表明奥运污染控制具有一定的长期效应。奥运后SO2浓度在中国气象局、固城和上甸子3个站点分别下降26%、36%和13%, 这些下降与风、温、湿等气象条件变化基本无关。区分局地和区域两种特征的分析表明,奥运污染控制带来的北京局地和区域为主的SO2降幅分别约为40%和20%。
长江三角洲临安大气本底站的SO2长期观测结果表明,2005—2010年间该站SO2存在显著的下降趋势,年降幅为2.4×10⁻⁹(P < 0.0001),尤其是2008年之后降幅更大。2005—2008年SO2平均浓度(±标准偏差)为(14.2±3.1)×10-9,比1999—2000年测得的(13.5±5.1)×10-9略高。2008—2010年SO2平均浓度(±标准偏差)为(7.1±3.1)×10-9。严格的排放控制,使2008年之后长三角地区的SO2下降了50%。这种下降也导致了SO2日变化的改变,从2009年前的夜间出现峰值改变为2009年后的 10∶00前后出现峰值。这一变化说明,可能垂直交换过程对SO2的贡献超过近地层积累。(徐晓斌)
2.11 北京城区污染物区域输送对下风向地区夏季O3生成效率(OPE)的影响
2008年6月1日至8月31日在北京城区中国气象局站和北京远郊区的上甸子大气本底站同步测量了SO2、 O3、 NOx、 NO和CO等气态污染物。不同风向条件下上甸子的污染物浓度水平差异巨大,西南风时远高于东北风。西南风有利于北京城区污染物向下游输送,而东北风则更多反映本底状况。在上甸子,对应城市气流的O3浓度水平比来自清洁地区气流的约高33.4×10⁻⁹。对应城市污染影响和本底条件下计算的OPE分别为4.0和5.3。根据这些OPE值和NOz(NOy-NOx)值估算了由城市输送的污染在上甸子局地产生的O3大约为8.6×10⁻⁹,仅相当于城市污染输送总影响的25.7%。这一结果表明,夏季城市O3的直接输送是上甸子O3高浓度的主要原因。(徐晓斌)
2.12 北京地区夏季O3及其前体物的观测:城市烟羽对下风向乡村地区O3污染的影响
2007年6月20日至9月16日,在北京主导风向上的4个站点进行了地面O3及其前体物的观测,包括2个城市站点(丰台和宝莲)、1个郊区站点(顺义)和1个乡村站点(上甸子)。4个站点O3的日变化具有典型污染地区的O3变化特征,特别是沿自西南至东北的主导风向,各个站点的O3峰值出现的时间逐站滞后。对微量气体相关分析显示,与宝莲站相比,到达上甸子站的污染气团更加老化,O3和Ox的浓度均较高。研究结果表明,城市烟羽不仅可以输送O3,而且还输送其前体物,后者与下风向乡村地区大气混合可以导致更多的光化学O3生成。(马建中)
2.13 1992—2009年庐山降水酸度和离子成分的变化特征
对1992—2009年庐山降水pH和电导率资料的分析结果表明,该地区降水pH年均值在4.35~5.01之间变化,平均年变率约为0.037/a,降水酸度呈现显著下降趋势;降水电导率呈现逐年增加趋势,平均年变率为1.87 μS/(cm a),非氢电导率未呈现显著变化趋势,降水酸度的增加与进入降水的酸性物质增加密切相关。这种趋势与我国东部能源消费状况的变化趋势一致。庐山降水酸度的季节变化较明显,冬季各月的多年平均降水pH值为4.35,酸雨污染严重;夏季降水平均pH值为4.88,高于其他季节,酸雨污染轻微。对2007年1月至2009年6月降水样品的离子成分分析结果显示,SO42-和NO3-是降水中主要阴离子,NH4+和Ca2+是主要阳离子。SO42-和NO3-的化学当量比值约为2.7,比20世纪80年代有明显的降低,但硫酸仍是降水中最主要的致酸物质。NH4+与Ca2+的化学当量比值约为1.0,表明这两种碱性物质提供了相近的酸中和能力。Cl-和Na+的化学当量比值约为0.67,低于自然降水平均值。庐山降水离子浓度总水平和主要离子组成特征具有明显的季节变化,与降水量及气团输送有密切关系。对降水时段气团输送轨迹的簇分析结果显示,共有6簇气团输送影响庐山降水的酸度和离子组成,其影响相对均匀,来自南海和庐山周边的气团起到主要影响。(李怡)
2.14 北京市酸雨变化趋势及成因分析
1993—2002年中国气象局酸雨观测站网在北京地区有2个观测站,2003年增至3个。根据北京3个酸雨观测站的有关资料,研究了北京市酸雨变化的特征及成因。研究结果表明∶(1)1993—2007年北京地区降水酸度呈现2个阶段,即1993—2002年降水酸度稳定在较弱水平,而2003—2008年呈逐年增强趋势;(2)与2003年以前相比,2003年以后硫酸根和硝酸根离子浓度均呈明显增加趋势,二者比值逐步下降并低于3,这表明北京乃至华北地区的酸雨已由硫酸型转为硫酸与硝酸并重型;(3)北京周边省、市二氧化硫年排放量的增加及钙离子和可吸入颗粒物浓度减少是近年来北京地区酸雨增强的人为原因;(4)气象条件是酸雨发生的主要动力因素。一般情况下,在地面风速较小的季节酸雨频率较高,850 hPa高度为弱的偏南风或发生低层逆温时可促进酸雨的发生。此外,降水量的大小也与酸雨有密切关系, 24 h降水量达暴雨量级时酸雨频率最高。(侯青)
2.15 北京空气持续污染特征
基于2000—2010年北京空气质量监测日报,研究了近10年来北京空气持续污染特征。结果表明,近10年来北京的空气质量得到明显改善,空气持续污染日数和质量超标日数均呈下降趋势,但年持续污染日数在年超标日数中所占的比例依然较大,持续污染已成为北京空气污染的一个显著特征。春季是北京持续污染最多的季节,平均每年多达25.4天。夏季是持续污染最少的季节,但是6月麦收期麦秸焚烧常会造成空气持续污染。北京空气持续污染的空间分布形态主要分为沙尘天气影响型、污染累积型和麦收期麦秸焚烧污染型。沙尘天气影响型造成的空气持续污染的空间分布特征表现为整个北京污染都很严重,特别是城区和西南部的污染最严重;污染累积型的持续污染在空间分布上呈南高北低型。麦秸焚烧污染型则是人口相对稀疏、农田面积较多的远郊区污染最严重。(王郁)
2.16 2011年春季日本福岛核泄漏污染输送:贵阳131I和137Cs观测示踪分析
2011年3月11日,日本本州9.0级地震引发了福岛核电站核泄漏,以及由此导致的131I和137Cs在全球大气环流传输已引起了重视。理论上也对这种输送路径进行了研究。本研究为2011年3 月17 日至4 月28 日在贵阳观风山对气溶胶中天然核素(210Pb、7Be)和人为核素 (131I、137Cs)近地面空气浓度逐周采样的系统对比观测,并结合该时段贵阳距地面500 m高度逐周315 h的气团后向轨迹分析。结果表明,福岛核泄漏污染物通过2条显著的途径输送到贵阳地区。第1条是首波核污染通过全球大气环流传输,由西向东,几乎环绕地球一周,历经约 10天至2周,最终在3 月24—31日从我国的西北地区入侵抵至贵阳。第2条途径则是福岛地区上空的核污染气团受东北天气系统的挤压南移并在低纬度地区再次先后受到东北和东南气流的影响,于4 月7—14 日抵达贵阳。核污染的第1条输送路径是全球尺度,第2条是东亚区域尺度。(郑向东)
2.17 卫星观测推测平流层背景气溶胶的变化
利用1998—2004年SAGE II (The Stratospheric Aerosol and Gas Experiment II )的气溶胶产品分析平流层背景气溶胶性质的变化倾向。 气溶胶消光系数(E)在南、北半球的中纬度平流层低层(LS)明显增加,年变率为2%~5%。气溶胶面密度(S)在中纬度LS的正变化最明显,年增长5%~6%。同时,气溶胶的有效半径(R)减少,尤其是在热带LS年变化达到-2.5%。根据这些趋势,可以得出气溶胶的数浓度在热带LS大约每年增加5%~10% ,在中纬度LS 每年增加4%~8% 。 气溶胶质量浓度在中纬度LS每年增加1%~5%。面密度产品存在大的不确定性会影响气溶胶面密度、气溶胶数浓度、气溶胶质量的变化趋势。我们的全球估计支持 Hofmann 等的推测:局地激光雷达后向散射增加是由于人为排放的SO2增加造成气溶胶增加的结果。而且,平流层气溶胶增加需要在热带由对流层向平流层输送的凝结核增加来支持。(刘煜)
2.18 2010年长江三角洲临安区域本底站PM2.5理化特征
2010年在代表长三角区域背景地区的临安区域本底站开展了对大气细粒子PM2.5为期1年的地面观测。临安2010年大气中PM2.5质量浓度平均为(58.2±50.8)g/m3,PM2.5浓度季节变化明显。利用HYSPLIT4模式计算了2010年临安72 h后向轨迹,根据轨迹计算与聚类结果,结合地面观测的PM2.5数据进行了分析。研究表明,临安地区因受到长三角区域及偏北气流引起的污染传输影响,呈现出高细粒子水平特征。PM2.5中总水溶性离子年平均浓度为(28.5±17.7)g/m3,占PM2.5质量浓度的47%。其中,气溶胶组分SO42-、NO3-和NH4+所占比重最大,共占总水溶性离子的69%。PM2.5中OC和EC的年平均浓度分别为(10.1±6.7)g/m3和(2.4±1.8)g/m3。OC和EC质量浓度显著相关,表明OC和EC主要来自相同的排放源。(孟昭阳)
3 大气成分模式的发展应用及大气成分的影响研究
3.1 在线气溶胶数值模拟系统CUACE/Aero的评估及改进
使用在线气溶胶数值模拟系统CUACE/Aero评估时发现,CUACE/Aero系统可以对黑碳、有机碳、硫酸盐、硝酸盐、海盐、沙尘和铵盐进行分档模拟,前10档这些组分的浓度和即为PM10浓度。日均PM10模式模拟结果都在观测的2倍因子范围之内,相关系数达到0.39。模式在乡村站的相关系数大于城市站,白天的相关性大于晚上。模式大气偏低的低氧化性是导致二次气溶胶偏低的一个非常重要的原因。模拟的气溶胶光学厚度(AOD)比地基CARSNET、空基MODIS反演的AOD都系统性偏高。系统偏高的重要原因是气溶胶的初始排放粒径分布数浓度峰值集中在0.1μm,使得模拟的细粒子气溶胶数浓度偏高,模拟的消光高1~2个量级,导致即使模式在白天PM10模拟偏低的情况下,AOD的模拟还是系统偏高。利用多个观测重构所有组分的排放谱分布:质量浓度峰值集中在0.5μm左右,数浓度在小粒径粒子处更加平滑。新模拟的AOD与观测接近,均一偏差和均一误差减少明显。(周春红)
3.2 空气质量诊断识别的参数化方法及其应用
基于2000—2007年PM10和气象要素数据的诊断与相关性分析,研究发展了北京及周边地区空气质量诊断的PLAM参数化方法。给出诊断识别空气污染强度变化的关键气象影响因子,包括水分凝结函数,湿相当位温和风速等。结果表明,与同期平均值相比,表现为高PM10的空气质量较差的日期通常与高值PLAM对应,即与高温、高湿、弱风速和具高“静稳”的日期一致。该方法为北京奥运会开幕式和接续的体育赛事提供了有意义的24 h 和 72 h预测服务。整个夏季期间,预测PLAM指数与API (空气污染指数)和PM10浓度之间的相关系数分别为0.82和0.59,均达到0.001显著性水平。PLAM指数中引入权重适应修正系数,对观测PM10浓度的诊断一年四季均可适用。(王继志)
3.3 我国沙尘天气过程PLAM指数跟踪分析及其波动变化特征
采用1980—2011年中国气象局气象站地面气象要素观测资料和高空大气探空资料、时间和空间加密气象观测站资料,以及中国气象档案馆原始天气图表等资料,基于沙尘气溶胶浓度(PM10)路径追踪的潜势源地贡献函数(PSCF)方法,发展空气质量气象条件PLAM指数对沙尘天气过程的路径跟踪,给出1980—2011年东北亚沙尘天气过程特征分布;采用Spline趋势分析方法,讨论沙尘天气系统强度的年度变化。结果表明,1980—2011年沙尘天气过程具有历史持续性与转折突变性并存的波状变化趋势,出现准10年的高低频活动特征。(王继志)
3.4 抗坏血酸和铁在醌类产生OH自由基过程中的协同增强作用
醌类物质是大气颗粒物所携带的重要有机成分,其致毒的机制非常复杂。醌类是具有高度自身氧化还原的物质,进入机体后导致大量活性氧产生。本研究探讨了蒽醌、抗坏血酸和铁之间在产生OH自由基方面的交互反应,并探讨了醌类浓度与OH产生的剂量关系响应曲线,估算了近稳态浓度,并对可能的机制进行了深入的分析。(李怡)
3.5 基于GIS和大气数值模拟技术评估兰州市PM10的人群暴露水平
利用2001年1月1—31日兰州市城区PM10月均观测浓度和CMAQ空气质量模式模拟的PM10月均浓度,基于GIS平台,将污染物浓度与人口空间分布图层叠加,采用PM10人口加权算法,定量评估了兰州市居民的颗粒物暴露水平,并对应用这2套数据的评估结果进行了对比。结果表明,与使用观测数据相比,模拟的PM10浓度空间梯度较大,模拟结果更加细致地展示了PM10浓度在兰州城区的分布,同时PM10浓度的最小值和最大值跨度也较大。对比人口加权前PM10浓度发现,人口加权后,从城区人口的空间分布来看,兰州市有较多的人口分布在污染较重的地区,使用PM10数值模拟结果对人体健康影响的评估要优于使用观测数据的评估。(安兴琴)
3.6 兰州市春季沙尘天气对呼吸系统疾病的影响
采用半参数广义相加模型(GAM),在排除入院人数长期趋势、气象因素、大气污染因素和日历效应等因素后,分析了兰州市2001—2005年春季沙尘天气对呼吸系统疾病的影响。结果表明,春季沙尘天气与呼吸系统疾病日入院人数的增加有一定联系,且表现为滞后效应。沙尘天气对健康的影响存在性别和年龄差异,性别差异表现为对男性人群的影响略大于女性人群(男性相对危险度为1.148,女性为1.144,且不具有统计学意义);年龄差异表现为对年龄大于65岁的老年人群的影响明显大于小于65岁的人群(年龄大于65岁的老年人群相对危险度为1.266,小于65岁的人群为1.119)。(安兴琴)
3.7 2009年我国可吸入颗粒物引起的人体健康经济损失评估
利用大气颗粒物的暴露-反应关系对中国2009年因可吸入颗粒物(PM10)造成的人体健康经济损失进行了估算。结果表明,2009年中国PM10人体健康经济损失约占当年GDP的2.1%。京津冀都市圈、山东、辽宁、长江三角洲、珠江三角洲、华东沿海和川渝等地的PM10人体健康经济损失较高;PM10人体健康经济损失与当年GDP比值高于4%的地区主要位于京津冀、山东、安徽、上海、重庆和新疆的部分地区。(侯青)
3.8 气象条件对大气污染物健康效应的影响
气象条件对大气污染物的扩散、稀释和积累起到重要的作用,直接对人体的真实暴露情况产生影响。因此,大气污染物的健康效应可因气象条件的不同而改变,其影响与气象条件密切相关。此外,污染的大气也会使人体对气象条件的变化或极端天气现象更加敏感,从而增强气象因子的效应。由此可见,大气污染和气象条件密切相关,对人体健康的影响具有不可分割的交互作用。(李怡)
3.9 气候变化背景下上海市气温热效应死亡风险预估
应用统计降尺度技术,模拟温室气体排放情景下上海市未来中期与远期逐日日均气温,并基于已经发表的“上海市气温-死亡暴露-反应关系”,预估碳排放相对高速增长模式(A2)和碳排放相对低速增长模式(B2)情景下上海市未来中期与远期气温热效应人群死亡风险。A2情景下,上海市2030—2059年和2070—2099年热相关死亡人数的年均值分别为516和1191例,分别比基线时间段(336例)增加53.6%和254.5%。B2情景下,上海市2030—2059年和2070—2099年热相关死亡人数的年均值分别为498和831例,分别比基线时间段增加48.2%和147.6%。可以看出气候变化背景下,未来上海市气温热效应人群死亡风险增加,未来远期的死亡风险增加幅度高于未来中期。(程艳丽)
3.10 北京PM1中的化学组分及其控制对策思考
通过分析北京城区2007年夏季和秋季、2008年冬季和春季4个季节PM1中硫酸盐、硝酸盐、铵盐、有机物和黑碳等气溶胶化学组分,结合对我国及全球主要区域PM10中上述气溶胶组分及矿物气溶胶组成的评估,发现因受干旱区产生的沙尘和城市逸散性粉尘的共同影响,整个亚洲大陆,尤其是我国的矿物气溶胶浓度与欧美国家城市区域气溶胶总和的平均值相当或更高。我国在重视控制PM2.5等细粒子污染的同时,不应忽视对PM2.5~PM10之间粗粒子的控制力度;北京城区春、夏、秋、冬的PM1平均质量浓度分别约为94、74、66、91 g/m3,全年平均约为81 g/m3,其中有机物气溶胶约占41%、硫酸盐占16%、硝酸盐占13%、铵盐占8%,黑碳和氯化物分别占11%和3%,细矿物气溶胶约贡献7%。对于PM2.5污染的控制,关键是消减PM1中主要气溶胶粒子的排放与转化,其中对有机物的控制更为重要,尽管对于北京而言进一步控制污染的难度已经很大。从科学上来说,即使我国的控制措施能百分之百实现,也很难稳定地达到欧美国家的空气质量水平,因为我国本底矿物气溶胶的浓度较高。应进一步评估各项控制措施的适用性,并制定考虑我国人群健康状况的PM2.5空气质量标准。(张小曳)
Progress in Atmospheric Composition Research
In 2012, the Institute of Atmospheric Composition fulflled various tasks satisfactorily and made obvious progress in such fields as analytical method, comparison and verification, quality control, observation of atmospheric composition and related properties, model development and operation, impact of atmospheric composition on climate, weather and human health, and so on.
1 Study on observation method, comparison and verifcation, and quality control
1.1 Analysis of atmospheric organic compounds by thermal desorption and comprehensive twodimensional gas chromatography with fame ionization detection
As a new separation technology developed in the 1990s, comprehensive two-dimensional gas chromatography (GC×GC) has many advantages, such as high resolution, high sensitivity, and large peak capacity. In this work, a GC×GC system coupled with a flame ionization detector (FID) is set up for the measurement of atmospheric organic compounds. Using a thermal desorption (TD) as injector and a cold/ hot jet modulator for the GC×GC modulation, the TD-GC×GC-FID system is able to separate various typesof C5–C15 atmospheric organic compounds within only one chromatographic run, including non-methane hydrocarbons (NMHCs), oxygenated volatile organic compounds (OVOCs), and halogenated hydrocarbons. Qualitative analysis is made using a quadruple mass spectrometer in combination with standard gases, and quantitative analysis is performed using external standards combined with FID mass correction factors. The mean standard deviations of the frst and second dimension retention times of the target compounds are less than 0.6 s and 0.02 s, respectively. The mean relative standard deviations of the peak volumes are 4.5% for NMHC and 14.3% for all compounds. The average r2of the calibration curve exceeds 0.99. The average detection limit is 6.04 ng and the average recovery is around 111%. In the analysis of air samples from an urban site in Beijing in January 2010, more than 400 peaks of organic compounds was detected, of which 103 compounds have been identifed including alkenes, mono- and poly-aromatics, aldehydes, ketones, alcohols, esters, halogenated hydrocarbons, etc. (Wang Ying)
1.2 Sampling-analysis quality control method for atmospheric hydrofuorocarbons (HFCs)
Air samples were fushed and pumped into two-port stainless steel canisters and pressurized to 1.36×10⁵Pa by a custom-made sampler. The samplers were analyzed by a gas chromatography-mass spectrometry (GCMS) system in the laboratory. The precisions of 6 major hydrofuorocarbons (HFCs) analysis were 0.24%-1.02%. The concentrations of 6 HFCs in the blank samples were below detection limits of the GC-MS system. The infuence caused by various inlet pressure fuctuations was corrected. The recoveries for 6 HFCs during the sampling-analysis procedure were 99.5%-100.4% and there were in significant changes of the HFCs concentrations during the 112 days storage. Air samples from the top of an 80 m tower at Shangdianzi regional station were sampled and analyzed. The concentration differences between two parallel samples were 0.04×10⁻¹²-0.16×10⁻¹². The concentration differences between canister samples and in-situ measurement were -0.86×10⁻¹²--0.17×10⁻¹². The sampling-analysis quality control method was found suitable for high precision atmospheric HFCs observations. (Yao Bo)
1.3 Study on the in-situ measurement of atmospheric CH4and CO by GC-FID method at the Shangdianzi GAW regional station
In-situ GC-FID system for atmospheric CH4and CO mixing ratio measurements at the Shangdianzi (SDZ) GAW regional station in Beijing was designed and optimized in 2009 based on a comparable system at the Waliguan GAW global station in Qinghai. The results from this study indicate that the system’s precisions for CH4and CO are higher than 0.03% and 0.45%, respectively,which have met the quality target on background greenhouse gas observations by the World Meteorological Organization's Global Atmosphere Watch (WMO/ GAW) program. The selection method of working standards for this system was established and two working standards (WH for high concentration and WL for low concentration) were selected. The concentrations of CH4and CO in these two standards can cover the ambient mixing ratios of CH4(2007.1×10-9and 1809.5×10-9) and CO ( 405.6×10⁻⁹and 123.8×10⁻⁹) . An injection sequence was programmed so that the two standards were analyzed alternatively for every three runs. The measurement accuracies are high, as shown by the standard deviations of less than 1.7×10⁻⁹and 1.0×10⁻⁹for CH4and CO respectively. This method has been applied to insitu measurement of atmospheric CH4and CO in North China. (Zhou Lingxi)
1.4 The infuence of water wapor on the measurement of CH4by the CRDS system
The Cavity Ring-Down Spectroscopy (CRDS) system has been introduced to measure methane (CH4) in the background area. It has been proved that the concentration of CH4measured by the CRDS system was affected by water vapor distinctly. In order to ensure the reliability of the observed data, the relationship between CH4and water vapor measured by the CRDS system is studied, and an effective correction method for water vapor in the range of 0.50%-2.45% (V/V) is established. The method validation results show that the deviations between the correction results and the theoretical values are less than 1.8 ×10⁻⁹, which is better than the goal of background atmospheric measurement. Finally, the correction method is used to deal with the CH4data measured by the CRDS system at Waliguan station (where water vapor ranges from 0.50% to 2.45%, V/ V), and compared with the data measured by the GC-FID system at the same time. The correction results show reduced deviations of smaller than 2.0×10⁻⁹for 38.48% measured data. (Zhou Lingxi)
1.5 Intercomparison and application of atmospheric humidity profles measured by CFH and Vaisala RS80 radisondes
Vertical profiles of atmospheric humidity simultaneously measured by balloon-borne Cryogenic Frost point Hygrometer (CFH) and Vaisala RS80 radiosonde in Tengchong, Yunnan in August 2010 are analyzed. Currently, CFH is the reference instrument in the measurement of atmosphere water vapor profile. RS80 radiosonde is ever extensively used in the world before the mid 1990s. The humidity data measured by CFH are used to assess the quality of RS80 radiosonde humidity data. The difference of RS80 radiosonde humidity data during daytime and nighttime respectively compared to CFH data is also given in individual intercomparison. The results reveal that there is a large dry bias produced by the RS80 humidity sensor with an average value of (23.7±18.5)%, and the daytime dry bias is (13.5±14.8)% larger than that in the nighttime owing to solar radiative heating on the humidity sensor. In addition, RS80 radiosonde is almost incapable of measuring the valuable humidity data in the transition region from the upper troposphere to the lower stratosphere. For the integrated precipitable water (PW) amounts from the profles GTS1, RS80, and CFH, and their comparisons with GPS measurements, CFH integrated PW is (4.3±2.0) mm (number of samples is 11) higher than that of GPS because CFH tends to saturate under moist conditions, especially when passing through cloud in the lower troposphere, while the PW differences of RS80 and GTS1 from the GPS measurements are (0.2±1.4) mm (number of samples is 12) and (-0.2±2.2) mm (number of samples is 43), respectively. The value of GPS PW is not sensitive to the humidity variations with altitude above the upper troposphere. CFH is demonstrated as an effective instrument measuring water vapor concentration in the circumstance with lower temperature as well as lower humidity, such as in the upper troposphere and lower stratosphere. Owing to dry bias, RS80 radiosonde detects less middle or high clouds than CFH does, especially in the detection of high clouds above 6000 m where the low humidity value from RS80 radiosonde almost can not indicate the occurrence of cloud. Therefore, the occurrence frequency and altitude of high clouds are much underestimated if RS80 radiosonde water profles are used. (Zheng Xiangdong)
1.6 Verifcation of the satellite remote sensing products of aerosol optical depth in the Taklimakan Desert area
Using ground-based Aerosol Optical Depth (AOD) data at Tazhong, Taklimakan Desert area, four sets of satellite aerosol data, from the Multi-angle Imaging Spectrometer (MISR), the Moderate Resolution Imaging Spectrometer (MODIS), and the Ozone Monitoring Instrument (OMI) from 2007 to 2008 were validated. The results show that satellite aerosol retrievals are signifcantly correlated with the ground-based ones. The correlation coeffcient for MODIS/AOD is the largest (0.91), followed by OMI/AOD (0.87), MISR/AOD (0.84), and OMI/UVAI (0.51). The MISR/AOD root-mean-square error (0.14) and the average deviation (-0.06) are the lowest in the four products. The MISR/AOD and MODIS/AOD are relatively less than the ground-based AOD; however, OMI/AOD and OMI/UVAI exceed the ground-based ones. Seasonal variations of aerosols are captured by satellite data. AOS is relatively large in spring and summer and is relatively low in autumn and winter. The results of Angstrom wavelength exponent show that spring has the minimum (0.11), followed by summer and autumn, and winter has the maximum (0.61), which shows that the aerosol particle is larger in spring and summer while smaller in autumn and winter. Besides, the Taklimakan Desert area belongs to the sand source with single aerosol type. In summary, the annual variability of AOD from 2000 to 2010 is not obvious. The results of the retrieval show that the maximal aerosol content appears in 2003 during the past decade and the annual average is up to 0.32, while the minimal aerosol content occurs in 2005 and the annual average is 0.28. (Che Huizheng)
1.7 Synergy of satellite and ground based observations in estimation of particulate matter in eastern China
Estimating particulate matter (PM) from space is not straightforward and is mainly achieved using the aerosol optical depth (AOD) retrieved from satellite sensors. However, AOD is a columnar measure, whereas PM is a ground observation. Linking AOD and PM remains a challenge for air pollution monitoring. In this study, a back-propagation artifcial neural network (BP ANN) algorithm trained with Bayesian regularization benefited from the synergy of satellite- and ground-based observations was developed to estimate PM in eastern China. Correlations between observed and estimated PM (denoted by R) during the period 2007—2008 over seven individual sites were investigated comprehensively in terms of site scale, seasonal scale, particle size, and spatio-temporal scale. With respect to site differences, the Nanning site had the best results with 80.3% of cases having a moderate or strong correlation value. Lushan and Zhengzhou followed with results of 75% and 73.8%, respectively. Furthermore, R exhibited a signifcant seasonal variation characterized by a maximum (80.2%) during the autumn period, whereas no obvious differences in R for various spatial scales (spatial averaging schemes of MODIS AOD) were observed. Likewise, the ratio value for daily averaging (64.7%) was found to be better than those for the two hourly temporal averaging schemes (i.e., 61.1% for HA1 and 58.3% for HA2). In addition, PM1 estimated from the ANN algorithm developed in this study had slightly higher R values than PM10 and PM2.5. The planetary boundary layer (PBL) effect on PM estimation was decreasing R with increasing height of the PBL, which is consistent with previous studies. Comparisons of observed versus estimated PM10 mass time series implied that the ANN algorithm basically reproduced the observed PM concentration. However, PM mass at certain sites may be underestimated under the condition of high observed PM concentrations. (Guo Jianping)
1.8 Design and implementation of reactive gas data processing system for atmospheric background monitoring stations
Based on many year practice of reactive gas observation and its sophisticated quality control and data processing methods, the comprehensive and rational functional design and orientation have been assigned to the data processing system, which is developed by using the Visual Studio development platform combined with MAP WinGIS and other display control by means of the modular functional design and development method. The system has realized easily the visualization of the observation data in space and time, the good capabilities of human-computer interaction, certain data statistic analysis, etc. The system is an effcient tool for managing and processing reactive gas observation data, and has become an important component of the operational reactive gas observation data quality control and processing system. (Xu Xiaobin)
2 Observational study on variations of different atmospheric compositions and related properties
2.1 Atmospheric aerosol compositions in China: Spatial/temporal variability, chemical signature, regional haze distribution, and comparisons with global aerosols
From 2006 to 2007, the daily concentrations of major inorganic water-soluble constituents, mineral aerosol, organic carbon (OC), and elemental carbon (EC) in ambient PM10 samples were investigated from 16 urban, rural, and remote sites in various regions of China, and were compared with global aerosol measurements. A large difference between urban and rural chemical species was found, normally with 1.5 to 2.5 factors higher in urban than in rural sites. Optically-scattering aerosols, such as sulfate (16%), OC (15%), nitrate (7%), ammonium (5%), and mineral aerosol (35%) in most circumstances, are majorities of the total aerosols, indicating a dominant scattering feature of aerosols in China. Of the total OC, 55%–60% can be attributed to the formation of the secondary organic carbon (SOC). The absorbing aerosol EC only accountsfor 3.5% of the total PM10. Seasonally, maximum concentrations of most aerosol species were found in winter while mineral aerosol peaks in spring. In addition to the regular seasonal maximum, secondary peaks were found for sulfate and ammonium in summer and for OC and EC in May and June. This can be considered as a typical seasonal pattern in various aerosol components in China. Aerosol acidity was normally neutral in most of urban areas, but became some acidic in rural areas. Based on the surface visibility observations from 681 meteorological stations in China between 1957 and 2005, four major haze areas are identifed with similar visibility changes, namely, (1) the Huabei Plain in North China and the Guanzhong Plain; (2) East China with the main body in the Yangtze River Delta area; (3) South China with most areas of Guangdong and the Pearl River Delta area; and (4) the Sichuan Basin in Southwest China. The degradation of visibility in these areas is linked with the emission changes and high PM concentrations. Such quantitative chemical characterization of aerosols is essential in assessing their role in atmospheric chemistry and weather-climate effects, and in validating atmospheric models. (Zhang Xiaoye)
2.2 Seasonal characteristics of components and size distributions for submicron aerosols in Beijing
Submicron aerosols (PM1) in Beijing were studied using an Aerodyne aerosol mass spectrometer (AMS) from January to October 2008. This study presents seasonal variations of different chemical components (sulfate, nitrate, ammonium, chlorid, and organics) and size distributions of PM1. The results show that mass concentration of PM1 was highest in summer, and lowest in autumn. Organics represented the dominant species in all seasons, accounting for 36%–58% of PM1, and their concentrations were highest in winter. Concentrations of inorganic components, sulfate, nitrate, and ammonium were highest in summer. Based on principal component analysis, organics were deconvolved and quantifed as hydrocarbon-like and oxygenated organic aerosol (HOA and OOA, respectively). HOA was highest in winter, accounting for about 70% of organics. However, OOA was highest in summer, and had lower values in autumn and winter. A similar diurnal pattern of various components was observed, with higher values at nighttime and lower ones during daytime. HOA increased more dramatically than other species between 17∶00 and 21∶00 and peaked at noon, which could be related to cooking emissions. OOA, sulfate, nitrate, ammonium and chloride varied with the same trend. Their concentrations increased with solar radiation from 09∶00 to 13∶00, and declined with weakening solar radiation. Size distributions of all species showed apparent peaks in the range 500–600 nm. Size distributions of organics were much broader than other species, particularly in autumn and winter. Distributions of sulfate, nitrate, and ammonium had similar patterns, broadening in winter. Contributions of different species were size-dependent; the fner the particle, the greater the contribution of organics. Organics represented more than 60% of particles smaller than 200 nm, contributing 50% to PM1 in winter. In spring and summer, HOA was the dominant organic fraction for particles smaller than 200 nm, while OOA contributed more to particles larger than 300 nm. In winter, HOA contributed more than OOA to all PM1 particles. (Zhang Yangmei)
2.3 Characteristics of cloud condensation nuclei at Wuqing
Based on the cloud condensation nuclei (CCN) concentration and aerosol size distribution measured at Wuqing Meteorological Bureau of Tianjin from November to December of 2009, the characteristics of CCN concentration and activation between 0.1% and 1.0% supersaturation were analyzed. The results show that the CCN concentration varies in the range of 4000-32000 cm-3in the supersaturateion of 1% and is affected by wind speed signifcantly at Wuqing in winter. Under the wind speed of 1.5-3.3 m/s, the CCN concentration is very high, and can reach 16000 cm-3at 1% supersaturation, but the CCN concentration is just one fourth of this value with the wind speed of 3.5-5.5 m/s. The CCN concentration varies largely in the range of 0.1% and 0.4% supersaturation. The increase of CCN concentration for every 0.1% supersaturation in the range of 0.1%-0.4% is about 5 times of those in the range of 0.4% and 1.0% supersaturation. The activation rate is affected signifcantly by wind speed in the low supersaturation ( 0.1%, 0.2%), and the value under the wind speed smaller than 1.5 m/s is about three times of that under the wind speed larger than 5.5 m/s, but in the supersaturation of 1%, the activation rate difference with wind speed is little. The diurnal variation of CCNconcentration shows two peaks at 08∶00 and 18∶00 of Beijing time, whereas there are two valleys of the activation rate, which suggests the effects from local emissions. The power law ft for the relationship of CCN concentration and supersaturation under different wind speeds shows that the supersaturation spectrum of CCN at Wuqing belongs to continental style. (Sun Junying)
2.4 Analysis on source features of halogenated gases at Shangdianzi regional atmospheric background station
In this study, fve-day back-trajectories collected at Shangdianzi station were categorized by season and calculated four times a day during the period of 2008—2010, based on the Lagrangian particle integrated trajectory model HYSPLIT, and using the back-trajectory cluster analysis method. Efforts were made to understand the impacts of different trajectories on the concentration of halogenated gases over the site of Shangdianzi (SDZ) in different seasons, in line with the in-situ concentration measurements of halogenated gases, including the 8 species of CFC-11, CFC-12, CCL4, CHCL3, CH3Br, SF6, H-1301, and HCFC-22. Meanwhile, the wind data collected at the same station and the concentration observed during the same period were employed to calculate the loadings of CFC-11, CFC-12, CCL4, CHCL3, CH3Br, SF6, H-1301, and HCFC-22, respectively. The result of back-trajectory cluster analysis suggests that air masses from southeast and southwest accounting for a large proportion of local air masses at SDZ always move slowly within the bottom boundary layer, which is beneficial for the accumulation of pollutants within the boundary layer and leads to the highest mean concentrations of halocarbons among all the clusters. Conversely, the mean concentration of halocarbons corresponding to the fast-moving northwest air masses at high altitude is found to have unanimously low values. The analysis of the concentration loadings proves that WSW and SW are the directions for the maximum concentration loading of all halogenated species, whereas NNW, NNE, NE, and ENE are the directions for the minimum concentration loading. We also fnd that the sector in SW-S-SE is the high concentration loading part, while the sector in NW-N-NE is the low concentration part. The trajectory cluster analysis and concentration loading results indicate that the SE-S-SW towards SDZ is the high pollution source direction for the halogenated species mentioned above, which refects the infuence of human activities on the air pollutant transportation at SDZ on regional scale, while NW-N-NE represents the clean direction of the station. (An Xingqin)
2.5 In-situ measurements of atmospheric hydrofuorocarbons (HFCs) and perfuorocarbons (PFCs) at the Shangdianzi regional background station
Atmospheric hydrofuorocarbons (HFCs) and perfuorocarbons (PFCs) were measured in-situ at the Shangdianzi (SDZ) Global Atmosphere Watch (GAW) regional background station, China, from May 2010 to May 2011. The time series for fve HFCs and three PFCs showed occasionally high-concentration events while background conditions occurred for 36% (HFC-32) to 83% (PFC-218) of all measurements. The mean mixing ratios during background conditions were 24.5×10⁻¹²for HFC-23, 5.86×10⁻¹²for HFC-32, 9.97×10⁻¹²for HFC-125, 66.0×10⁻¹²for HFC-134a, 9.77×10⁻¹²for HFC-152a, 79.1×10⁻¹²for CF4, 4.22×10⁻¹²for PFC-116, and 0.56×10⁻¹²for PFC-218. The background mixing ratios for the compounds at SDZ were consistent with those obtained at mid to high latitude sites in the Northern Hemisphere. Northeasterly winds were associated with negative contributions to the atmospheric HFC and PFC loadings (mixing ratio anomalies weighted by time associated with winds in a given sector), whereas southwesterly advection (urban sector) showed positive loadings. Chinese emissions estimated by a tracer ratio method using carbon monoxide as tracer were (3.6±3.2) kt/yr for HFC-23, (4.3±3.6) kt/yr for HFC-32, (2.7±2.3) kt/yr for HFC-125, (6.0±5.6) kt/yr for HFC-134a, (2.0±1.8) kt/yr for HFC-152a, (2.4±2.1) kt/yr for CF4, (0.27±0.26) kt/yr for PFC-116, and (0.061±0.095) kt/yr for PFC-218. The lower HFC-23 emissions compared to earlier studies may be a result of the HFC-23 abatement measures taken as part of Clean Development Mechanism (CDM) projects that started in 2005. (Yao Bo)
2.6 CH4concentration and variation characteristics at four WMO/GAW background stations in China
Background CH4concentrations were continuously measured at four WMO/GAW stations (Waliguan in Qinghai (WLG), Lin'an in Zhejiang (LAN), Shangdianzi in Beijing (SDZ), and Longfengshan in Heilongjiang (LFS)) by Cavity Ring Down Spectroscopy system. From 2009 to 2010, the diurnal cycle of hourly average CH4concentration at LAN was found to be similar in all four seasons, with the highest level detected at 05∶00 (Beijing Time) and the lowest at about 14∶00. Similar CH4diurnal cycles were observed at LFS in the summer time; however, the daily amplitude was much higher than that at LAN and reached 216.8 ×10⁻⁹(molar ratio). For SDZ station, there were similar trends in spring, autumn, and winter, and the daily average concentration in the summer was much higher than those of the other seasons and reached the highest at about 20∶00. No apparent CH4diurnal cycle was observed at the WLG station during the whole year. The seasonal variations were obvious at the three regional stations ( LAN, SDZ, and LFS) . The background concentration was the lowest in July at LAN while it reached the highest level in August at LFS. The yearly background concentration variation at LFS displayed a “W” pattern. At LFS and SDZ, the wintertime CH4concentrations were higher than those in spring and autumn. WLG represented a clean area and its CH4value was the lowest among the four stations with the monthly average amplitude of about 11.5×10⁻⁹. At all three regional stations, non-background data accounted for more than 70% of the whole data. Cluster analysis of 3 day backward trajectories corresponding to the high CH4concentration ( WLG∶CH4>1870 ×10-9; LFS∶CH4>2100 ×10-9; LAN∶CH4>2150 ×10-9; SDZ∶CH4>2050 ×10-9) data points suggested that the high CH4level measured in summer might be associated with air mass transportation. (Fang Shuangxi)
2.7 Variation of CH4concentration at Xianggelila background station in Yunnan Province
Atmospheric CH4concentration was continuously measured at Xianggelila background station by Cavity Ring Down Spectroscopy system from July 2010 to October 2011. The average CH4background concentrations during spring, summer, autumn and winter were (1850.7±6.9)×10-9, (1850.9±13.4)×10-9, (1865.6±16.1)×10-9and (1839.2±6.5)×10-9, respectively. The monthly average variation reached a maximum in September and a minimum in December with the amplitude of about 39.6×10⁻⁹. The hourly average CH4concentration exhibited evident diurnal variations with minimal values around 14∶00—16∶00 for all seasons. The daily variation amplitude was the lowest in winter (4.4×10⁻⁹) and the highest in autumn (10.0×10⁻⁹). Evident elevation of CH4concentration was observed when the surface wind was from the southwest, whereas great decrease was associated with north to northeasterly wind. Combined with the observed CH4concentrations, cluster analysis of 3-day backward trajectories suggested that the observed CH4concentration during the four seasons at the station was mainly affected by the southwest air mass transport, especially in spring, summer, and autumn. (Fang Shuangxi)
2.8 Preliminary study of the atmospheric CO2concentration and its variation at Xianggelila background station
Atmospheric CO2concentration was continuously measured at Xianggelila background station by Cavity Ring Down Spectroscopy System from September 2010 to August 2011. The average background concentrations of CO2during spring, summer, autumn and winter were 394.78×10⁻⁶(mole ratio), 386.82×10⁻⁶, 386.46×10⁻⁶, and 390.74×10⁻⁶, respectively. The monthly average variation reached a maximum in the April—May period and a minimum in July with the amplitude of about 12.22×10⁻⁶. The hourly average CO2concentration exhibited evident diurnal variations with maximal values around 07∶00 and minimal around 14∶00—17∶00 during all seasons. The daily variation amplitude was the lowest in winter (1.51×10⁻⁶) and the highest in summer (21.82×10⁻⁶). Evident elevation of CO2concentration was usually observed when the surface wind came from the west to south. Combined with the observed CO2concentrations, cluster analysis of 3-day backward trajectories ending at full hour suggested that air mass from the southwest obviously reduced the observed CO2concentration during spring, summer, and autumn. However, in winter, the decrease was notapparent because of the lower emissions from the local vegetation than in the other seasons. (Fang Shuangxi)
2.9 A pollution and oxidization pool over North China
A feld measurement campaign performed during spring 2006 revealed that strong pollution emissions from urban and industrial centers tend to accumulate in the lower atmosphere over the central area of Huabei. High pollution concentrations were found to be associated with enhanced levels of OH radicals. The high OH levels tend to promote the formation of semi and low-volatile species, such as inorganic and organic acids, through the oxidation of SO2, NO2, and VOCs, and thus accelerate the gas-particle conversion processes in the atmosphere. Our results indicate that the lower atmosphere over Huabei not only is strongly polluted but also acts as an oxidation pool, with pollutants undergoing very active photochemistry over this part of China. (Ma Jianzhong)
2.10 Recent trends of sulfur dioxide at different sites in North China and the Yangtze River Delta
In recent years, China has implemented stricter measures of coal desulfurization, which have suppressed the emission of SO2from the coal-fred power plants. In addition, emission control measures were implemented in the North China region for the Beijing 2008 Olympic Games. This work focuses on evaluating the real effects of these control measures on the levels of atmospheric SO2in North China and Yangtze River Delta regions.
SO2measurements made in recent years at sites in Beijing and its surrounding areas are performed to study the variations and trends of surface SO2at different types of sites in northern China. The overall average concentrations of SO2are (16.8 ± 13.1) ×10-9, (14.8 ± 9.4) ×10-9, and (7.5 ± 4.0) ×10-9at China Meteorological Administration (CMA, Beijing urban area), Gucheng (GCH, relatively polluted rural area, 110 km to the southwest of Beijing urban area), and Shangdianzi (SDZ, clean background area, 100 km to the northeast of Beijing urban area), respectively. The SO2levels in winter (heating season) are 4–6 folds higher than those in summer. There are highly signifcant correlations among the daily means of SO2at different sites, indicating regional characteristics of SO2pollution. Diurnal patterns of surface SO2at all sites have a common feature with a daytime peak, which is probably caused by the downward mixing and/or the advection transport of SO2-richer air over the North China Plain. The concentrations of SO2at CMA and GCH show signifcant downward trends (–4.4 ×10⁻⁹/yr for CMA and –2.4 ×10⁻⁹/yr for GCH), while a less significant trend (–0.3×10⁻⁹/yr) is identifed in the data from SDZ, refecting the character of SDZ as a regional atmospheric background site in North China. The SO2concentrations at all the three sites show a signifcant decrease from period before to after the control measures for the 2008 Olympic Games, suggesting that the SO2pollution control has longterm effectiveness and benefts. In the post-Olympics period, the mean concentrations of SO2at CMA, GCH, and SDZ are (14.3 ± 11.0) ×10-9, (12.1 ± 7.7) ×10-9, and (7.5 ± 4.0) ×10-9, respectively, with reductions of 26%, 36%, and 13%, respectively, compared to the levels before. Detailed analysis shows that the differences of temperature, relative humidity, wind speed, and wind direction are not the dominant factors for the signifcant differences of SO2between the pre-Olympics and post-Olympics periods. By extracting the data being more representative of local or regional characteristics, a reduction of up to 40% for SO2in polluted areas and a reduction of 20% for regional SO2are obtained for the effect of control measures implemented for the Olympic Games.
SO2has been observed from July 2005 to June 2010 at Lin'an WMO GAW regional station (30.3 °N, 119.73 °E, 138 m a.s.l.) located in the Yangtze River Delta region in eastern China. The observation data are analyzed to understand the trend of regional SO2background concentration. Strict quality controls are conducted to ensure the temporal comparability of the data. Significant downward trend with 2.4×10⁻⁹/yr (P<0.0001) of surface SO2is observed from 2005 to 2010, especially after 2008. The average concentration of SO2from July 2005 to June 2008 is (14.2±3.1) ×10-9, which is slightly higher than the mean values of (13.5±5.1) ×10-9during 1999—2000 and is two folds of the average value (7.1±3.1)×10-9from July 2008 to June 2010. More than 50% of the SO2has been cut down after 2008 in the Yangtze River Delta regiondue to the implementation of stricter emission control measures. The peak SO2concentration appears around 10∶00 in the morning after 2009 while it appears at night before 2009. These diurnal variations of SO2might indicate that after 2009, more SO2is from the vertical exchange process than from the local accumulation. (Xu Xiaobin)
2.11 Impact of the regional transport of urban Beijing pollutants on downwind areas in summer: Ozone production effciency analysis
Ambient measurements of SO2, O3, NOx, NOy, and CO were made at Shangdianzi (SDZ), a rural site in the northeast (NE) of Beijing, and urban Beijing (China Meteorological Administration) from 1 June to 31 August 2008. The pollutants at SDZ showed very different concentration levels under different wind conditions, with the levels under the southwest (SW) wind being much higher than those under the NE wind. The SW wind facilitates the transport of urban plume to SDZ, whereas the NE wind provides a background condition. At SDZ, the ozone (O3) concentration in air masses from urban Beijing was found to be 33.4×10⁻⁹higher than that from clean regions in summer. The ozone production effciency (OPEx) for the urban plume and background condition was 4.0 and 5.3, respectively. Based on these OPEx values and the NOz values for the respective conditions, the contribution of in-situ production in the urban plume to the level of O3at SDZ is estimated to be 8.6 ×10⁻⁹, corresponding to only 25.7% of the total impact of urban plume transport. This suggests that direct transport of O3rather than in-situ photochemistry contributes mainly to the summer elevation of the level of O3at SDZ. (Xu Xiaobin)
2.12 Measurements of ozone and its precursors in Beijing during summertime: Impact of urban plumes on ozone pollution in downwind rural areas
Sea-land and mountain-valley circulations are the dominant mesoscale synoptic systems affecting the Beijing area during summertime. Under the influence of these two circulations, the prevailing wind is southwesterly from afternoon to midnight, and then changes to northeasterly till forenoon. In this study, surface ozone (O3), carbon monoxide (CO), nitric oxide (NO), nitrogen dioxide (NO2), nitrogen oxide (NOx), and non-methane hydrocarbons (NMHCs) were measured at four sites located along the route of prevailing wind, including two upwind urban sites (Fengtai “FT” and Baolian “BL”), an upwind suburban site (Shunyi “SY”) and a downwind rural site (Shangdianzi ”SDZ”) during 20 June and 16 September 2007. The purpose is to improve our understanding of ozone photochemistry in urban and rural areas of Beijing and the infuence of urban plumes on ozone pollution in downwind rural areas. It is found that ozone pollution was synchronism in the urban and rural areas of Beijing, coinciding with the regional-scale synoptic processes. Due to the high traffic density and local emissions, the average levels of reactive gases NOxand NMHCs at the non-rural sites were much higher than those at SDZ. The level of long-lived gas CO at SDZ was comparable to, though slightly lower than, that at the urban sites. We estimate the photochemical reactivity, represented by OH loss rate coeffcient (LOH), and the ozone formation potential (OFP) in the urban (BL) and rural (SDZ) areas using measured CO and NMHCs. LOHby total NMHCs at the BL and SDZ sites is estimated to be 50.7 s-1and 15.8 s-1, respectively. While alkenes make a major contribution to the LOH, aromatics dominate OFP at both urban and rural sites. With respect to the individual species, CO has the largest ozone formation potential at the rural site, and at the urban site aromatic species are the leading contributors. While the O3diurnal variations at the four sites are typical for polluted areas, the ozone peak values are found to lag behind one site after another along the route of prevailing wind from SW to NE. Intersection analyses of trace gases reveal that polluted air masses arriving at SDZ were more aged with both higher O3and Ox concentrations than those at BL. The results indicate that urban plume can transport not only O3but its precursors, the latter leading to more photochemical O3production when being mixed with background atmosphere in the downwind rural area. (Ma Jianzhong)
2.13 Characteristics of precipitation chemistry at Lushan Mountain
Trends in precipitation pH and conductivity during 1992—2009, and in ionic compositions from January 2007to June 2009, are reported from Lushan Mountain, one of the highest mountains in Central-East China. Annual mean pH was in the range of 4.35-5.01 and showed a statistically significant (P<0.01) decreasing trend with time. Annual mean conductivity showed a statistically significant (P0.05) increasing trend, although this was not the case for non-H conductivity. Increasing rainwater acidity was mainly caused by increasing amounts of acid substances entering the rain. The trends in precipitation pH and conductivity were directly associated with energy consumption. Over the period of study, Lushan Mountain received more rainfall in spring and summer. The pH values varied seasonally with winter minima. The winter multiyear seasonal mean pH was 4.35. The corresponding summer value was 4.88. SO42-and NO3-were the main anions, and NH4+and Ca2+were the main cations. The anion to cation ratio was 0.8-1.0, and that of [SO42-] to [NO3-] was 2.4-3.0, much lower than that of the 1980s. However, sulfuric acid was still the main acid present. The ratio of [NH4+] to [Ca2+] was about 1.0, suggesting that these two alkaline substances provided close acid neutralizing capacity. The ratio of [Cl-] to [Na+] was about 0.67, somewhat lower than that of natural precipitation. Ionic composition varied seasonally and was closely related to the amounts of rainfall and pollution. Trajectory analyses showed that the trajectories to Lushan Mountain could be classifed in six clusters and trajectories originating from the South Sea and the areas surrounding Lushan Mountain had the greatest impacts on precipitation chemistry. (Li Yi)
2.14 Variation trend and cause analysis of acid rain in the Beijing municipality
The acid rain observation network operated by the China Meteorological Administration (CMA) contained 2 stations in 1993 through 2002 in the Beijing area, and the number of stations was increased to 3 in 2003. According to the monitoring data from the three observation stations, the characteristics and causes of acid rain variation trend in Beijing was studied. The following conclusions are drawn from the study. First, the precipitation acidity between 1993 and 2008 in the Beijing area has two different stages∶ 1993—2002 when precipitation acidity remained at a low level and 2003—2008 when precipitation acidity gradually increased. Second, compared to the period before 2003 in Beijing and even in North China, the annual mean concentration of sulfate ion and nitrate ion obviously increased after 2003, and the ratio of the two gradually decreased until less than 3, which indicates that the acid rain components had changed from sulfate to sulfate combined with nitric acid. Third, the increase of sulfur dioxide (SO2) emission and the decrease of the calcium ion and concentration of PM10 around Beijing are caused by human activities and are the reasons for the aggravation of the acid rain in Beijing in recent years. Fourth, climatic condition is the main driver to the occurrence of acid rain. Generally, lower speed of ground wind, weak south wind at 850 hPa, and temperature inversion at low levels facilitate the occurrence of acid rain. In addition, acid rain is closely related to precipitation, e.g., its frequency reaches the peak when the 24-h precipitation accumulates to the rainstorm level. (Hou Qing)
2.15 Characteristics of persistent air pollution in Beijing
Using the air quality daily reports in Beijing from June 2000 to December 2010, the characteristics of persistent air pollution in Beijing are analyzed. The air quality has been signifcantly improved in Beijing in recent 10 years. The persistent air pollution days are reducing, so are the low air quality days, but persistent pollution days still account for a large proportion of the total pollution days, and persistent pollution has become a distinctive feature of air pollution in Beijing. Spring is the season with most persistent air pollution days, average 25.4 days. Summer is the season with minimum days of persistent air pollution, but the persistent pollution caused by wheat-straw burning often occurs in June. Distribution of persistent air pollution in Beijing can be divided into three types∶ dust storm type, pollution accumulation, and pollution caused by wheat-straw burning. Distribution characteristic of the persistent air pollution affected by dust storms is high air pollution index (API) in the whole city of Beijing, especially in the urban area and its southwest. The persistent air pollution due to pollution accumulation has a pattern of higher in the south than north. The persistent air pollution caused by wheat-straw burning often exhibits high API in the suburbs. (Wang Yu)
2.16 Transport of the radioactivity leakage from the Japan Fukushima Nuclear Power Plant in spring 2011:131I and137Cs tracers observed in Guiyang, China
The 9.0 Ritcher scale earthquake that happened on 11 March, 2011 in the Honshu Island, Japan had caused the radioactivity leakage from the Fukushima Nuclear Power Plant. The leaked artificial nuclides,131I and137Cs, and their transport processes in the global atmosphere had drawn great public attention. In this study, the concentrations of radioactive isotopes7Be,210Pb,131I, and137Cs at the surface level in weekly aerosol samples obtained at the Guanfenshan Moutain, Guiyang, China from 17 March to 28 April 2011 were reported. The variations of the nuclide concentrations associated with their transport paths were analyzed with 315 h backward trajectories initialized at 500 m from the surface level at Guiyang. The results revealed that there were two evident transport paths for131I and137Cs from Fukushima to Guiyang. The frst path, along which the radioactive pollution tracers reached Guiyang faster, was through the northwestern China. These tracers were transported eastward and it took them 10 days to 2 weeks to arrive the northwestern China before they were detected during 24—31 March in Guiyang. The second path extended southeastward from Japan, with transport by the northeast Asian synoptic system at the beginning, then southwestward and northwestward before their arrivals during 7—14 April in Guiyang. The frst transport path of radioactive pollution tracer from the Fukushima Nuclear Power Plant to Guiyang was on the global scale while the second was on the East Asian regional scale. (Zheng Xiangdong)
2.17 Background stratospheric aerosol variations deduced from satellite observations
The Stratospheric Aerosol and Gas Experiment II (SAGE II) aerosol products from 1998 to 2004 have been analyzed to reveal the tendency of changes in background stratospheric aerosol properties. The aerosol extinction coeffcient E has apparently increased in the midlatitude lower stratosphere (LS) in both hemispheres, at an annual rate as great as 2%–5%. Positive changes in the aerosol surface area density S in the midlatitude LS are most distinct, with a rate of increase as high as 5%–6% annually. At the same time, there has been a secular decrease in aerosol effective radius R, especially in the tropical LS, at a rate of up to –2.5% per year. Corresponding to these trends, the aerosol number concentration is inferred to have increased by 5%–10% per year in the tropical LS and by 4%–8% per year in the midlatitude LS. Changes in aerosol mass are also deduced, with rates of increase in the midlatitude LS in the range of 1%–5% per year. The large uncertainty in operational S product is the major factor infuencing the trend in S, aerosol number concentrations, and mass. The authors’ global assessment supports the speculation of Hofmann et al. on the basis of local observations that the cause of an increase in lidar backscatter over a similar period was a consequence of aerosol particle growth due to enhanced anthropogenic sulfur dioxide emissions. Moreover, it is found that an increase in the injection rate of condensation nuclei from the troposphere to the stratosphere at tropical latitudes is required to sustain the increase in stratospheric aerosol concentration identifed in this analysis. (Liu Yu)
2.18 Characteristics of fne particles (PM2.5) at Lin an regional background station in the Yangtze River Delta region
Ground-base observation of fine particles (PM2.5) was conducted in 2010 at Linan regional background station in the Yangtze River Delta region. The annual average concentration of PM2.5 was (58.2 ± 50.8) μg/m3, and its seasonal variation was signifcant. Air mass backward trajectories were performed and analyzed in combination with corresponding pollutants concentrations using the HYSPLIT4 model. Higher PM2.5 levels were found at Linan, indicating that the site was under signifcant regional-scale infuence of the long-range transport from the Yangtze River Delta region and northern China. The annual concentration of total water-soluble inorganic ions was (28.5±17.7) g/m3, contributed an average of 47% of PM2.5 mass concentration. Three major ions SO42-, NO3-, and NH4+counted for 69% of the total water-soluble inorganic ions. The annual mean concentrations of OC and EC were (10.1±6.7) μg/m3and (2.4±1.8) μg/m3, respectively. OC and EC showed a signifcant correlation, indicating that OC and EC were mainly from the common sources. (Meng Zhaoyang)
3 The model development and the impact of atmospheric compositions on climate, weather, and human health
3.1 Improvements in simulating the chemical and optical properties of Chinese aerosols using an online coupled model CUACE/Aero
CUACE/Aero, the China Meteorological Administration (CMA) Unified Atmospheric Chemistry Environment for aerosols, is a comprehensive numerical aerosol module incorporating emissions, gaseous chemistry, and size-segregated multi-component aerosol algorithm. Online coupled into a mesoscale weather forecast model MM5, its performance and improvements for aerosol chemical and optical simulations have been evaluated using the intensive observational data of aerosols/gases from the CMA Atmosphere Watch network, plus aerosol optical depth (AOD) data from the CMA Aerosol Remote Sensing network (CARSNET), and from the Moderate Resolution Imaging Spectroradiometer (MODIS). Targeting Beijing and the North China region from 13 to 31 July 2008, when a heavy hazy weather system occurred, the model captured the general variations of PM10 with most of the data within a factor of 2 from the observations and a combined correlation coeffcient (r) of 0.38 (signifcance level of 0.05). The correlation coeffcients are better at rural than at urban sites, and better at daytime than at nighttime. Chemically, the correlation coeffcients between the daily-averaged modeled and observed concentrations range from 0.34 for black carbon (BC) to 0.09 for nitrates with sulfate, with ammonium and organic carbon (OC) in between. Like PM10, the values of chemical species are higher during daytime than those during nighttime. On average, the sulfate, ammonium, nitrate, and OC are underestimated by about 60%, 70%, 96.0%, and 10.8%, respectively. Black carbon is overestimated by about 120%. A new size distribution for the primary particle emissions was constructed for most of the anthropogenic aerosols such as BC, OC, sulfate, nitrate, and ammonium from the observed size distribution of atmospheric aerosols in Beijing. This not only improves the correlation between the modeled and observed AOD, but also reduces the overestimation of AOD simulated by the original model size distributions of primary aerosols. The normalized mean error has been reduced to 62% with the CARSNET observations and 76% with MODIS, from the original 111% and 143%, respectively. The factors resulting in the underestimation of aerosol concentrations and other discrepancies in the model are explored, and improvements in enhancing the model performance are proposed from the analysis. It is found that the accuracy in meteorological predictions plays a critical role in the simulation of the occurrence and accumulation of heavy pollution episodes, especially the winds and the treatment of the Planetary Boundary Layer (PBL). (Zhou Chunhong)
3.2 A parameterized method for air-quality diagnosis and its applications
A parameterized method is developed to diagnose air quality in Beijing and other cities with an index termed PLAM (parameters linking air-quality to meteorological elements), which is derived from a correlation between PM10 and relevant weather elements based on the data between 2000 and 2007. Key weather factors for diagnosing the air pollution intensity are identified and included in PLAM that include atmospheric condensation of water vapour, wet potential equivalent temperature, and wind velocity. It is found that the poor air quality days with elevated PM10 are usually associated with higher PLAM values, featuring higher temperature, humidity, lower wind velocity, and higher stability compared to the averaged values in the same period. Both 24-h and 72-h forecasts provided useful information and service for the day of the opening ceremony of the Beijing 2008 Olympic Games and the subsequent sport events. A correlation coeffcient of 0.82 was achieved between the forecasts and the air pollution index (API) and 0.59 between the forecasts and observed PM10, all reaching the signifcance level of 0.001, for the summer period. A correction factor was also introduced to enable the PLAM to diagnose the observed PM10 concentrations all year round. (Wang Jizhi)
3.3 PLAM index tracking for trajectories of the SDS system in China and its wave-like trends
The characteristic distributions of regional sand and dust storms (SDS) from 1980 to 2011 wereinvestigated using meteorological data from surface stations, atmospheric sounding data, high density weather data of the CMA, as well as the archived Chinese original weather maps. Based on the SDS deposited PSCF (potential source contribution function) method, a tracking analysis of sand-dust weather processes was developed by using the index of the PLAM (parameters of air quality and meteorology) in the Northeast Asian region. A spline trend analysis was also used to investigate the variability of the SDS system strength. The results show that during the period of 1980—2011, the SDS processes had a wave-like trend, featuring both a historical persistence and abrupt transitions, with an about 10-yr high-low oscillation. (Wang Jizhi)
3.4 Interactive enhancements of ascorbic acid and iron in hydroxyl radical generation in quinone redox cycling
Quinones are toxicological substances in inhalable particulate matter (PM). The mechanisms by which quinones cause hazardous effects are complex. Quinones are highly active redox molecules that can go through a redox cycle with their semiquinone radicals, leading to formation of reactive oxygen species. Electron spin resonance spectra have been reported for semiquinone radicals in PM, indicating the importance of ascorbic acid and iron in quinone redox cycling. However, these fndings are insuffcient for understanding the toxicity associated with quinone exposure. Herein, we investigated the interactions among anthraquinone (AQ), ascorbic acid, and iron in hydroxyl radical (•OH) generation through the AQ redox cycling process in a physiological buffer. We measured •OH concentration and analyzed the free radical process. Our results showed that AQ, ascorbic acid, and iron have synergistic effects on •OH generation in quinone redox cycling; i.e., ascorbyl radical oxidized AQ to semiquinone radical and started the redox cycling, iron accelerated this oxidation and enhanced •OH generation through Fenton reactions, while ascorbic acid and AQ could help iron to release from quartz surface and enhance its bioavailability. Our findings provide direct evidence for the redox cycling hypothesis about airborne particle surface quinone in lung fuid. (Li Yi)
3.5 Assessment on population exposure levels of PM10 in Lanzhou based on GIS and atmospheric numerical simulation technology
The pollutant concentration and population spatial distribution in January 2001 were overlaid, based on monthly average PM10 concentration values from observations and CMAQ simulations. Then, population exposure levels were calculated by the population-weighted PM10 concentrations. Assessment results from these two different sets of data were comparatively analyzed. The simulated PM10 concentration gradient is larger than the observed. The simulation provides more detailed spatial distribution of PM10 concentration as well as larger intervals between maxima and minima. Taking the factor of population weights into account, it was found that there were more people living in more polluted areas based on simulated PM10 concentrations. (An Xingqin)
3.6 Association between dust weather and number of admissions of patients with respiratory diseases in spring in Lanzhou
Excluding the confounding factors on respiratory hospitalizations such as long-term trend, meteorological factor, atmospheric pollution, and calendar effect, this study investigates the effect of sand-dust weather on respiratory diseases from 2001 to 2005 in Lanzhou City, on the basis of a semi-parametric generalized additive model (GAM). The results indicate that there is a lagged association between sand-dust weather and an increase in respiratory hospitalizations, with gender and age differences. The effect of sand-dust weather on health is severer on male than on female patients (with RR value being 1.148 for male and 1.144 for female without statistical signifcance), and much greater on people aged65 years old than<65 years old ( with RR value being 1.266 for65 years old, and 1.119 for<65 years old). (An Xingqin)
3.7 An assessment of Chinas PM10-related health economic losses in 2009
Using GIS software and based on exposure-response functions, this study estimated the health-related economic losses that China suffered in 2009 due to the presence of particulate matter (PM10). The resultsshow that China suffered a health-related economic loss due to PM10 of US$ 106.5 billion, or 2.1% of China s GDP, for the year 2009. Some urban areas, including Beijing, Tianjin, Shanghai, Guangzhou, Chongqing, and Changsha, reported large health-related economic losses due to PM10, with a value of US$ 1.5 million per square kilometer or greater. Some parts of Beijing, Ji nan, and Chongqing reported health-related economic losses due to PM10 as being greater than 4% of the 2009 GDP. (Hou Qing)
3.8 The interactive impacts between air pollutants and meteorological factors on human health
Meteorological conditions decide the diffusing, transport, and accumulation of air pollutants, and thus impact human being’s true exposure to air pollution. Air pollution may make people more vulnerable to the effects of temperature variability; while temperature may modify the associations between air pollution and cardio-respiratory diseases. There is often symmetry in modifcation—air pollution modifes temperature and then temperature modifies air pollution—but the magnitudes are likely to differ. The true magnitude of the association between temperature and health outcomes may be obscured if air pollution is an effective modifer of the relationship. Therefore, there are interactions between meteorological factors and air pollutants in their impacts on human health. (Li Yi)
3.9 Projection of heat-related mortality in Shanghai under the climate change
The statistical downscaling techniques are applied to simulations of daily mean temperature in Shanghai in the near and far future under the changing climate. Based on the published exposure-reaction relationship of temperature and mortality in Shanghai, we project the heat-related mortality in the near and far future under the circumstance of high speed increase of carbon emission (A2) and low speed increase of carbon emission (B2). Under the A2 scenario, annual average heat-related mortality is projected to be 516 and 1191 cases in 2030— 2059 and 2070—2099, respectively, increasing by 53.6% and 254.5% compared with the baseline period (336 cases). Under the B2 scenario, annual average heat-related mortality is projected to be 498 and 832 cases in 2030—2059 and 2070—2099, respectively, increasing by 48.2% and 147.3% compared with the baseline period (336 cases). Under the changing climate, heat-related mortality is projected to increase in the future; and the increase will be more obvious in 2070—2099 than in 2030—2059. (Cheng Yanli)
3.10 Aerosol chemical compositions of Beijing PM1 and its control countermeasures
The mass concentrations of sulfate, nitrate, ammonium products, organic matter, and black carbon are measured at urban Beijing during summer and autumn of 2007 and winter and spring of 2008. In comparison with assessment of major chemical compositions in less than 10 micron particles with at least an entire year data from various rural and urban sites in 16 areas of the world, the concentration level of mineral aerosol in China, which is partially a result of sand and dust transported from desert areas and contributions from urban fugitive dust/fy ash sources, is found to be almost equivalent to or even higher than the sum of all kind of aerosols in urban Europe and North America, suggesting the control countermeasures for aerosol particle in diameter between 2.5 and 10 micron in China should not be neglected, especially when the country pays much attention to controlling the fine PM2.5 particles. In urban Beijing, the averaged concentrations of PM1 are around 94, 74, 66, and 91 μg/m3for spring, summer, autumn, and winter, respectively, with the annual mean of 81 μg/m3. The relative contributions of organics, sulfate, nitrate, and ammonium product are about 41%, 16%, 13%, and 8%, respectively. The black carbon and chloride contribute Beijing PM1 about 11% and 3%, respectively. The fne mineral aerosol contributes about 7%. The key to the control of PM2.5 is the reduction in the main emission species and their chemical transformation of PM1 particles, and an important step is to control the organic matter in Beijing, although this has been very diffcult for a 26-million population living here. Scientifcally speaking, even if China’s control countermeasures are realized one hundred percent, it is still hard to reach the air quality level of the Europe and North America because of the higher background mineral aerosol level. The cost-effective control measures and new PM2.5 standard considering the health of the Chinese need to be further investigated. (Zhang Xiaoye)

2012年3月12日,在中国气象局局长郑国光等领导陪同下,江苏省副省长徐鸣一行到气科院考察工作,受到院长张人禾的热情接待。徐鸣副省长与气科院专家就城市及周边地区气溶胶形成和发展趋势等问题进行了讨论。On 12 March 2012, Vice Governor of Jiangsu Province, Mr. Xu Ming visited CAMS in the accompany of CMA Administrator, Dr. Zheng Guoguang, and was warmly welcomed by CAMS President, Prof. Zhang Renhe. Mr. Xu Ming exchanged views with CAMS experts on aerosol formation and development in urban and surronding areas.

2012年3月20日,国家自然科学基金委员会主任陈宜瑜一行参观访问气科院。副院长翟盘茂、张小曳为来宾做了第3次青藏高原试验和大气成分研究等工作汇报。陈宜瑜主任与郑国光局长及气科院专家就上述问题深入交换了意见。On 20 March 2012, the delegation of the National Natural Science Fundation of China led by its head, Mr. Chen Yiyu visited CAMS. CAMS Vice Presidents, Dr. Zhai Panmao and Prof. Zhang Xiaoye reported to the guests on the Third Tibetan Plateau Experiment and Atmospheric Composition Research, respectively. Mr. Chen Yiyu exchanged views on the above issues with Dr. Zheng Guoguang and CAMS experts thought-provokingly.

2012年4月28日,气科院2008—2011年工作评估会议在京举行。院长张人禾和6个重点研究领域学术带头人汇报了4年来气科院在科研业务、人才队伍建设等方面取得的丰硕成果。评估专家组充分肯定了气科院的成绩,并高度评价了气科院评估报告。On 28 April 2012, the CAMS Staff Work Performance Assessment Meeting was held in Beijing. CAMS President, Prof. Zhang Renhe and academic leaders reported on the fruitful outcomes achieved over the four years (2008—2011) in scientific research and capacity-building of personnel, etc. The expert team of assessment presented positive comments on CAMS’ achievement and spoke highly of the assessment report.
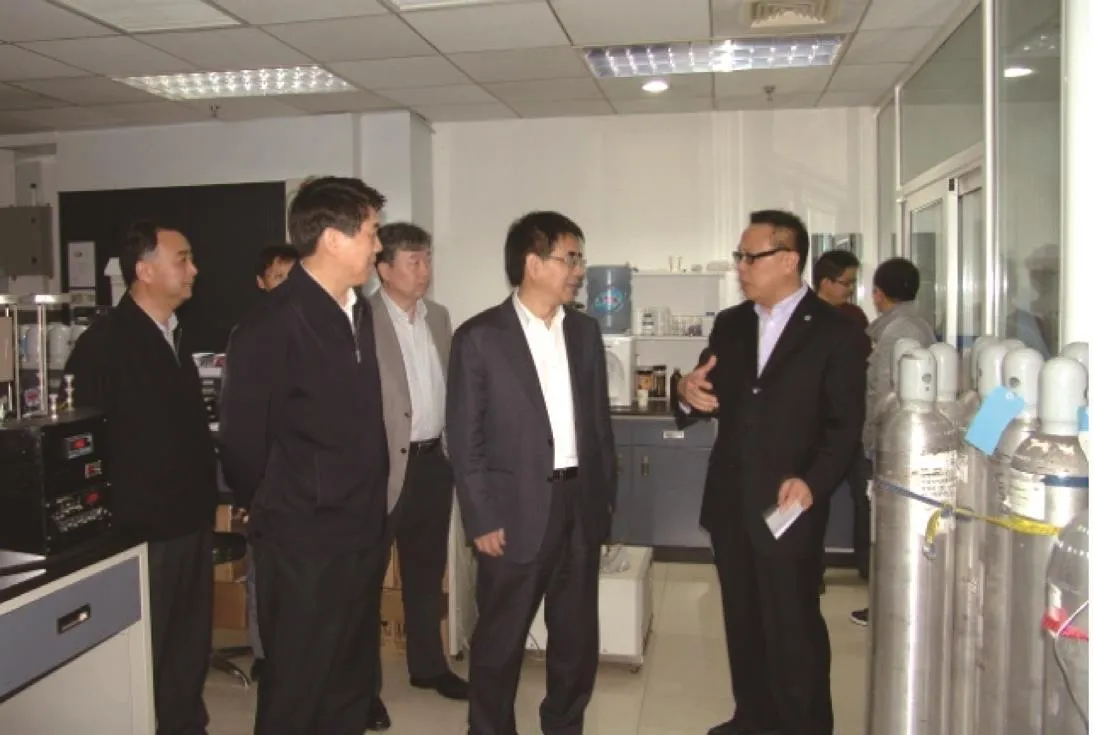
2012年4月23日,科技部副部长张来武一行在郑国光局长陪同下参观气科院。院长张人禾主持接待,副院长张小曳、周广胜分别做了大气化学研究进展、农业气象和人工影响天气相关工作的汇报。On 23 April 2012, the delegation headed by Vice Minister of Science and Technology of China, Mr. Zhang Laiwu visited CAMS in the accompany of CMA Administrator, Dr. Zheng Guoguang. CAMS President, Prof. Zhang Renhe received the guests and Vice Presidents, Prof. Zhang Xiaoye and Dr. Zhou Guangsheng reported on the progress of atmospheric chemistry research and agrometeorological and weather modifcation work, respectively.
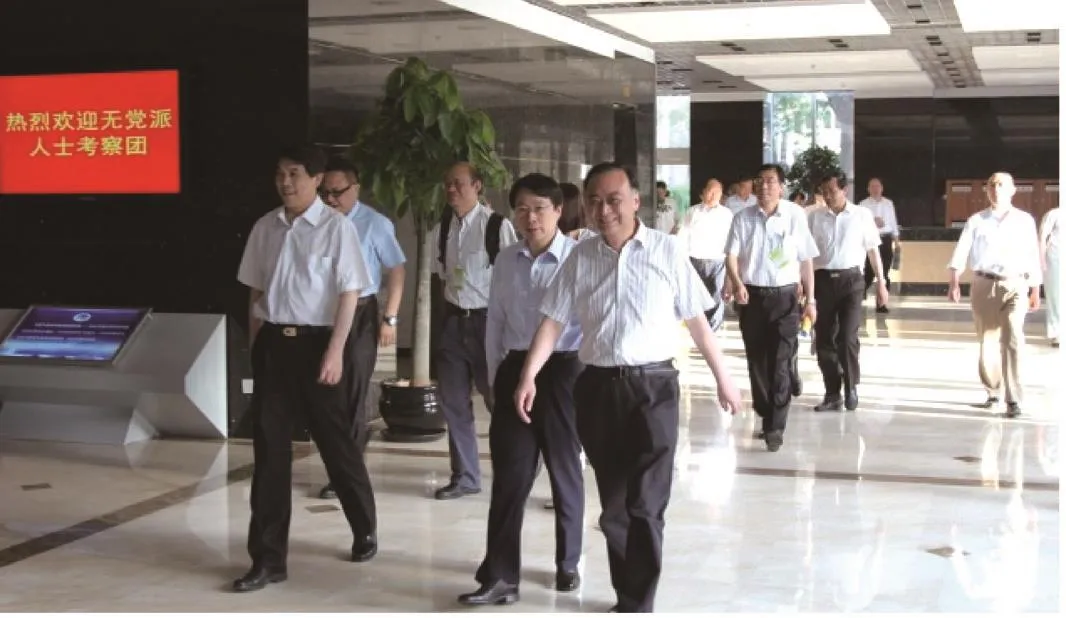
2012年5月24日,在郑国光局长陪同下,中央统战部副部长陈喜庆带领由全国无党派人士组成的“防治细颗粒物(PM2.5)的对策研究”考察团到气科院调研,并就细颗粒物(PM2.5)、空气质量及控制对策等问题与气科院专家进行了探讨。On 24 May 2012, accompanied by CMA Administrator Zheng Guoguang, the study tour delegation of maverick led by the Deputy Head of United Front Work Department of CPC Central Committee, Mr. Chen Xiqing visited CAMS for studying the response measures to prevent fine articles (PM2.5). The delegates exchanged views with CAMS experts on PM2.5, air quality, and control measures, etc.
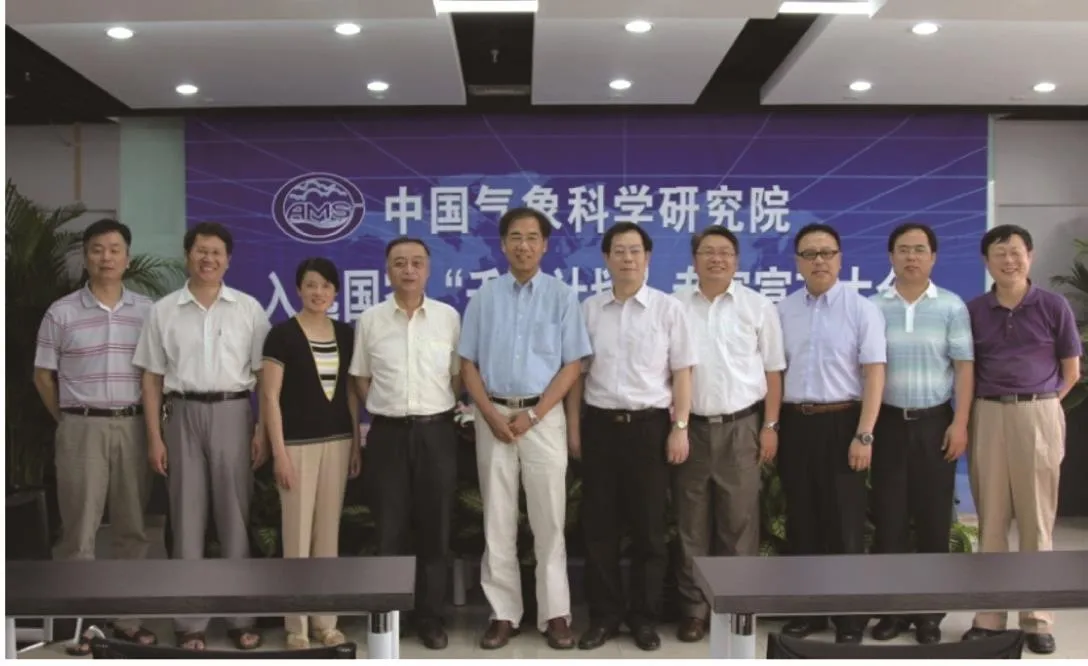
2012年6月13日,气科院召开特聘专家张大林教授入选国家 “千人计划”国家重点创新项目平台宣布大会。张大林是美国马里兰大学教授,主要从事暴雨、大暴雨机理研究工作。On 13 June 2012, the declaration ceremony for Prof. Zhang Dalin’s selection into the National Leading Innovation Project Platform of the “1000 High-Level Foreign Experts Project” was held at CAMS. Prof. Zhang Dalin works at University of Maryland of USA, researching in rainstorm and heavy rainstorm mechanisms.

2012年9月28日,气科院与河北省气象局合作签字仪式暨科学报告会在河北省气象局举行。双方将在试验基地建设、科学研究、人才培养、资源共享等方面开展全面合作。在之后举行的科学报告会上,张人禾、张小曳、王东海研究员做了学术报告,双方科研业务人员展开了深入的交流讨论。On 28 September 2012, the Signing Ceremony for Cooperation between CAMS and Hebei Provincial Meteorological Service (HPMS) along with a scientific seminar was held at HPMS. At the seminar, Profs. Zhang Renhe and Zhang Xiaoye, Dr. Wang Donghai made academic presentations, respectively, and research & operational staff from both institutions held heated discussions.
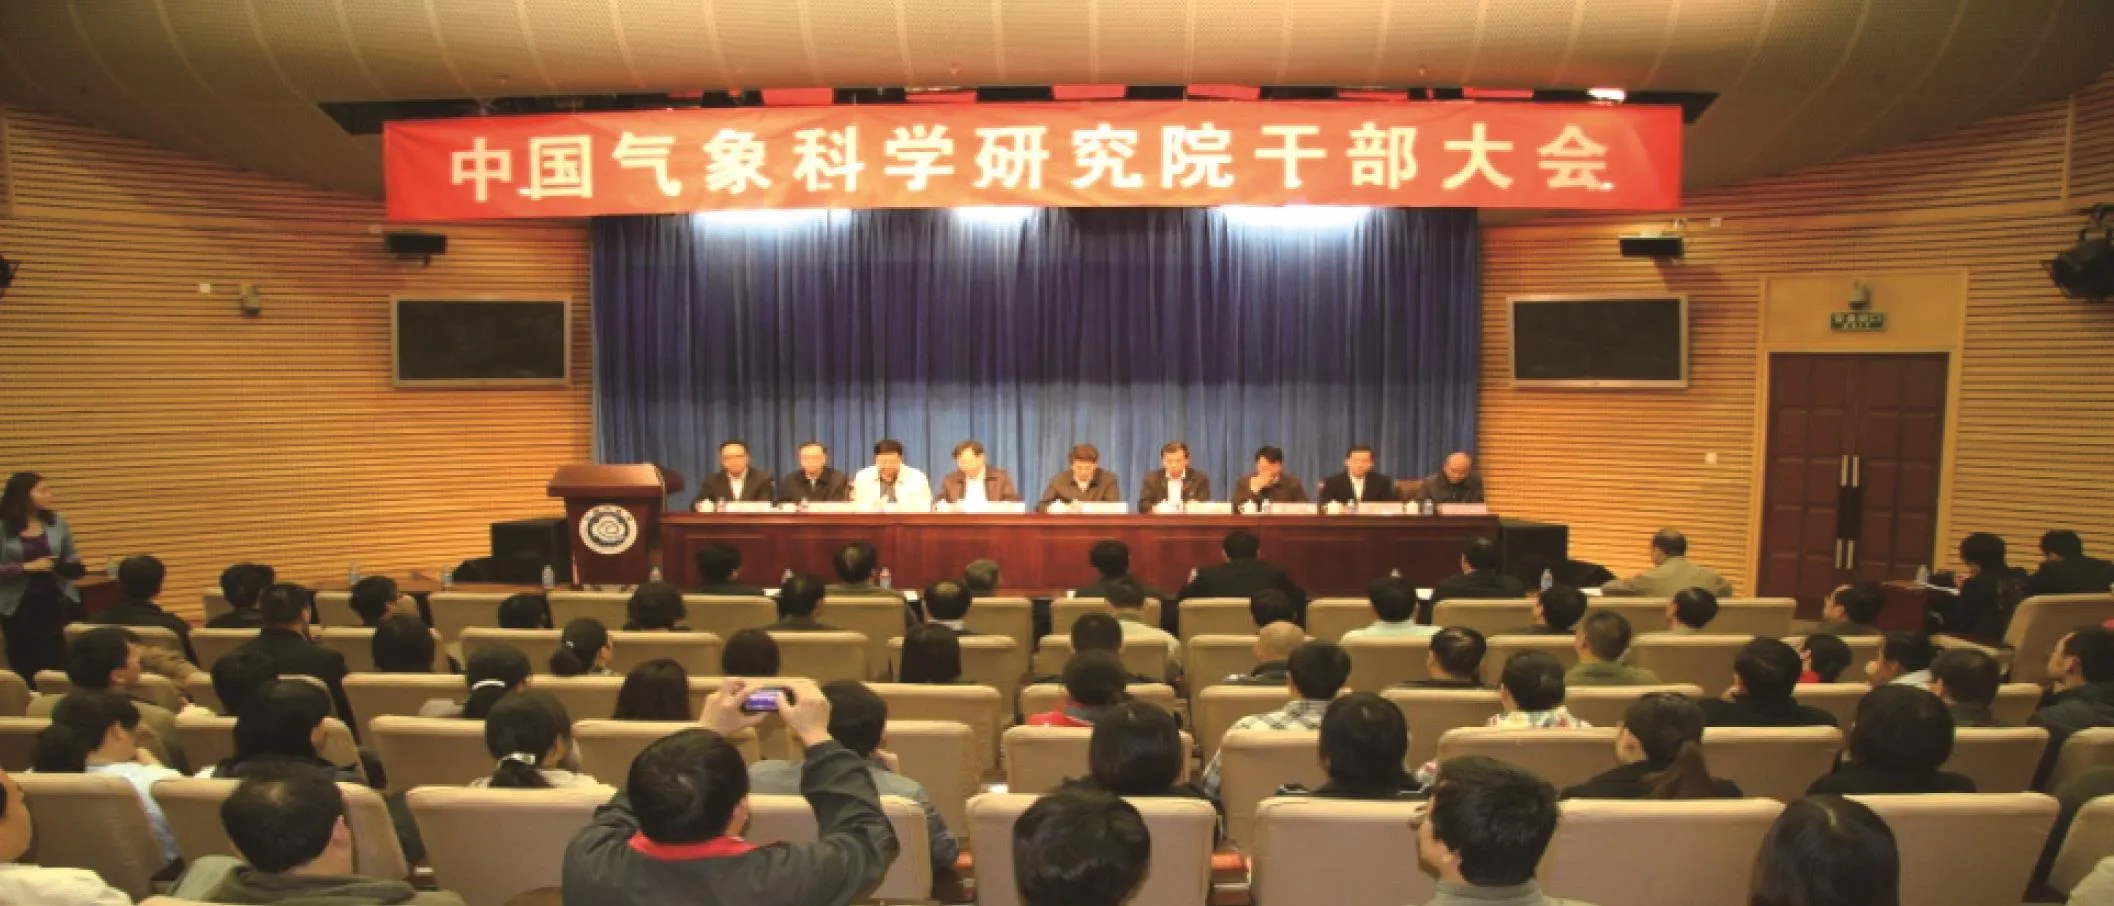
2012年10月16日,气科院召开干部大会,宣布由端义宏、王怀刚、李集明、赵平、翟盘茂和周广胜组成气科院新一届领导班子的决定。中国气象局局长郑国光等领导出席会议,人事司司长胡鹏主持会议。On 16 October 2012, CAMS held the Employee Plenary to announce its new Board of Presidents composed of Mr. Duan Yihong, Mr. Wang Huaigang, Mr. Li Jiming, Mr. Zhao Ping, Mr. Zhai Panmao and Mr. Zhou Guangsheng. CMA leaders including Administrator Zheng Guoguang attended the meeting, which was presided over by the Director-General of CMA Department of Personnel, Mr. Hu Peng.


2012年11月13日,端义宏院长组织召开“第3次青藏高原大气科学试验”专题会议,与会专家针对青藏高原大气科学试验问题进行了研讨。On 13 November 2012, CAMS President, Dr. Duan Yihong hosted a forum on “The Third Tibetan Plateau Scientific Experiment on Atmosphere”. The participating experts discussed about a number of issues related to the atmospheric experiments to be carried out over the Tibetan Plateau.

2012年,气科院获得国家科技进步2等奖1项、获得专利5项。In 2012, CAMS won a second prize of National S&T Progress Award and fve items were granted patent.
