Experimental validation method of elastic thin rod model for simulating the motional cable harness
2012-06-21WANGChunsheng王春生LIUJianhua刘检华NINGRuxin宁汝新CHENTao陈涛
WANG Chun-sheng(王春生), LIU Jian-hua(刘检华), NING Ru-xin(宁汝新),CHEN Tao(陈涛)
(School of Mechanical Engineering,Beijing Institute of Technology,Beijing 100081,China)
In order to transform power and signals,devices on the stabilized platforms(such as sensors,cameras,and telescopes)must be connected to other devices by some cable harness.We call this kind of cable harness as“motional cable harness”because they must move with the stabilized platform together.
During operation of the stabilized platform,motional cable harness can reduce the stabilizing precision[1-2].To predict this disturbing effect,a dynamic cable harness model following the Kirchhoff’s thin rod theorem[3-4]has been developed[5].
In order to validate this model,a suitable experimental system which can measure the motion and deformation of flexible cable harness has to be established.
The measurement of motion and deformation of cable harness is difficult because of the large geometrical deformation and the flexible characteristic of the cable harness.So the relevant literature is very limited.Buckham[6-7]et al.validated their lumped mass model of remotely operated vehicles(ROV)tether by aposition sensing device(record the motion of end point)and a under water camera(record the motion of the tether).But their system is a 2Dapparatus which is not suitable for a 3Ddynamic model.
In this study,based on binocular vision technique,a non-contact measurement system was established.A simplified stabilized platform system was constructed to provide driving operations to the cable harness.Mechanical parameters used in simulation,such as the bending and twisting rigidities of specimen were obtained from experiment.
The numerical and experimental results were compared,which qualitatively shows that the real and simulated cable harness exhibit similar deformation.The simulated spring force results changed with the expected trend.The quantitative disagreements were theoretically explained.
1 Thin rod model for motional cable harness
In the simulation model,motional cable harness is described as a homogeneous,isotropic,and linearly elastic thin rod with rigid cross-section,and the geometry profile is represented by the center line and cross section with inertial frame and principal frame(body-fixed frame).
The thin rod model is suitable for dynamic simulation of slender objects,such as cable,rope,and tube.Compared to the simple“mass-spring”model,this model is firmly based on structure mechanics and can account for twisting deformation and geometric nonlinearity.Compared to FEM,this model has higher computational efficiency due to its reduced dimensionality and concise algebraic structure.So this model is suitable for both physically based simulation and fast simulation of motional cable harness.
1.1 Dynamics equations
The simulation model consists of four non-linear partial differentials with four unknown vectors ofυ,Ω,F,M.Theseequationscanbecompactly writtenas
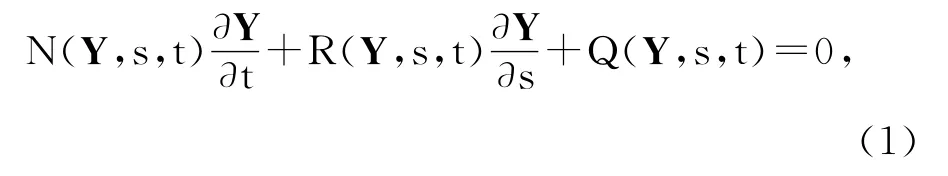
where Yis the set ofυ,Ω,F,andM;υis the linear velocity of the cross section center,Ωistheangularvelocityofthecrosssection,Fis the internal force,and Mis the internal moment;sis the arccoordinate,andtis time.
1.2 Solution of the model
The above partial differential equation set can be solved using differential quadrature method(DQM).By using zeros of the Chebyshev polynomial as the grid points[8],the arc-coordinateswas discretized to obtain a set of ordinary differential equations which were solved by implied method[9]in time domain to obtain the geometry and mechanics data about the profile and internal force of cable harness.
The convergence of the model on different number of nodes (11nodes,17nodes,and 21 nodes)is shown in Fig.1.
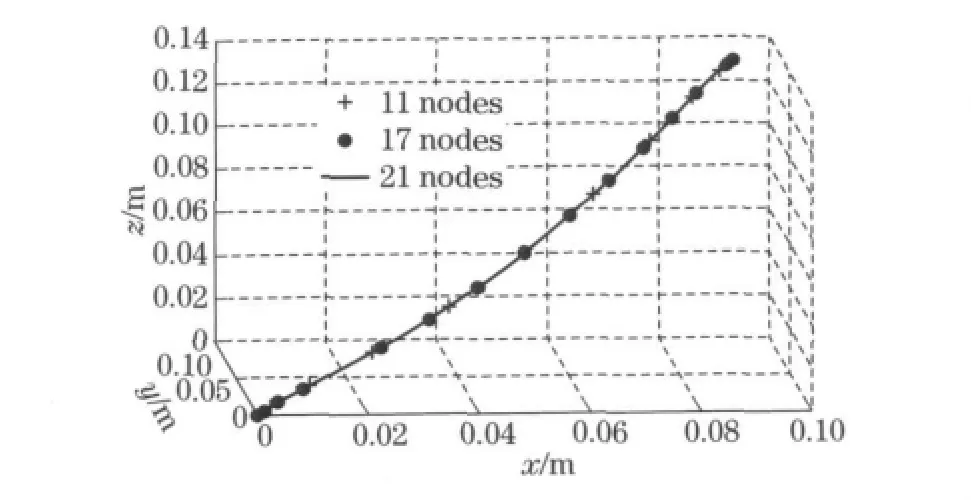
Fig.1 Convergence of the solutions
2 Measurement of specimen’s parameter
To compare the simulating and experimental results,the simulating calculation model must use the physical parameters of the experimental specimen.These parameters were obtained by experiments(Tab.1).
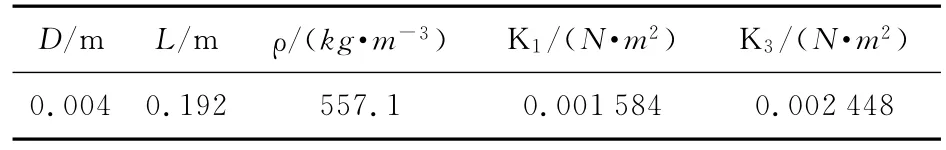
Tab.1 Cable harness physical parameters
Sincethetestspecimenconsistsoftencables packedcloselywithinathermoplasticsheath,itis difficulttomeasureitsYoung’smodulus.The bendingrigiditywasobtainedbytheexperiment asshowninFig.2.Acantilevercableharness specimensubjectedtoastayedconcentratedloadPatthefreeendB.WiththemeasureddisplacementYBandloadP,weobtainedthebendingrigidityK1asfollows

whereK1is the bending rigidity,Pis the concentrated load,andYBis the displacement of pointB.
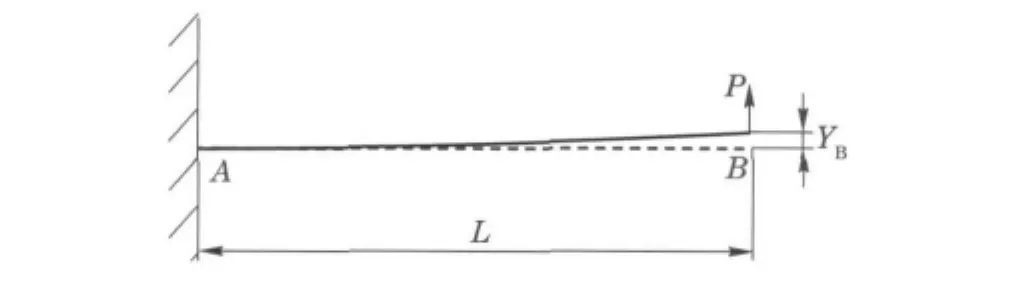
Fig.2 Cantilever cable harness subject to a concentrated load
Through a first order least squares fit as shown in Fig.3,we gotK1=0.015 84.

Fig.3 Calculation of bending rigidity K1
3 Disturbance force validation
As shown in Fig.4,a simplified stabilized platform system being precisely balanced was constructed to provide driving operation to the cable harness specimen.A force gauge (0.02Nprecision)was used to obtain the absolute value of spring disturbance force during the motion of the frame.The difference value(to remove the bearing friction torque)of these two sets of data was the driving force to overcome the spring disturbance force during the motion of frame.Then this value was used to validate the simulation results of spring force.By eliminating the imbalance and friction effect,this experiment system could faithfully present the spring disturbance force of cable harness.
The absolute values of spring disturbance force from experiment and simulation are plotted in Fig.5.It indicates that the data development trends of both the experiment and simulation agree well,and the largest disturbance force appears at the same time.

Fig.4 Experiment apparatus

Fig.5 Absolute value of disturbance force
As shown in Fig.5,the experimental value is 5%-20%less than the simulation value.This is because we assumed that there was no slip relative to each other or to the sheath,which will overestimate the bending rigidities when slipping actually exists within the cable harness.At the same time,the component materials in cable harness possess anisotropy property to influence cable behavior.There are also errors from frictional and plastic losses.As a result,real spring disturbance force is smaller than the simulation result(within an acceptable range).
4 Cable harness profile validation
A simplified two-axes stabilized platform system was constructed to provide three dimensional driving operations to the cable harness.The two frames of this platform were driven by two DC motors respectively.
To avoid interfering with the deformation to be measured,only non-contact method such as optical method can be used.In recent years,the binocular vision technique is developing quickly.Its advantages,such as full field,non-contact,and simple optical set-up,make it a suitable technique for measuring the motion and deformation of flexi-ble cable harness.Based on the binocular vision technique,an optical measuring instrument was developed for measuring the profile of motional cable harness specimen.While the platform moves,cable harness followed,which can be viewed from two cameras of the binocular vision system.Then,the measured results were compared with the simulation results.
The motional cable harness in this study possessed special geometrical properties.One of its dimensions(the length dimension)was much bigger than the other two dimensions(the cross section dimensions)and its centerline contained most of the information needed to represent it.Following the Kirchhoff assumption,we assumed that the cross-section of the cable harness was rigid.Then the motional cable harness was geometrically represented by its center line and cross section.The deformation of motional cable harness was represented by the bending of center line and the rotation of cross-section around the center line,which was measured respectively.
4.1 Binocular measurement system
The whole system (Fig.6)consisted of light sources,cameras with lenses,antivibration dome,microcomputer,and the special image correlation software.To grab enough frames,two high-speed 1 392×1 040CCD cameras were used,and the system uniquely combined two groups of lenses,so the typical measurement areas was 15mm×15mm or 120mm×60mm for different position of the cable harness.

Fig.6 Binocular vision measurement system
The two cameras were fixed on two antivibration domes to reduce the negative impact of environment vibration,and the flexible design of this light source system overcame the shading problem caused by the testing platform.
The binocular vision measurement system developed in this study has the following functions:high-speed cable harness deformation measurement,3Ddisplay of measured cable harness profile,customized coordinate system,and post processing of data.
An easy calibration procedure was also developed to support the quick setup of the system.As shown in Fig.7,18pairs of the calibration board pictures were used to calculate the inner and outer parameters of the two cameras.

Fig.7 Calibration of the binocular vision system
The measuring error of this system is less than 0.2mm[10],which is good enough for the motional cable harness measurement.
4.2 Measurement of centerline bending deformation
As shown in Fig.8,the binocular stereo measure system consisted of two cameras through which the motional cable harness specimen was observed.The two cameras had been calibrated,and the discrete 3Dpoints on the cable harness centerline were reconstructed from their images on the two cameras.
In Fig.8,τisthecenterline,andPisapoint onthecenterline.C1andC2aretheopticalcenters ofthetwocameras.P1andP′1aretheimagesofPontheimageplanesΠ1andΠ2.I1andI2arethe conjugateepipolarlines.e1ande2aretheepipoles.
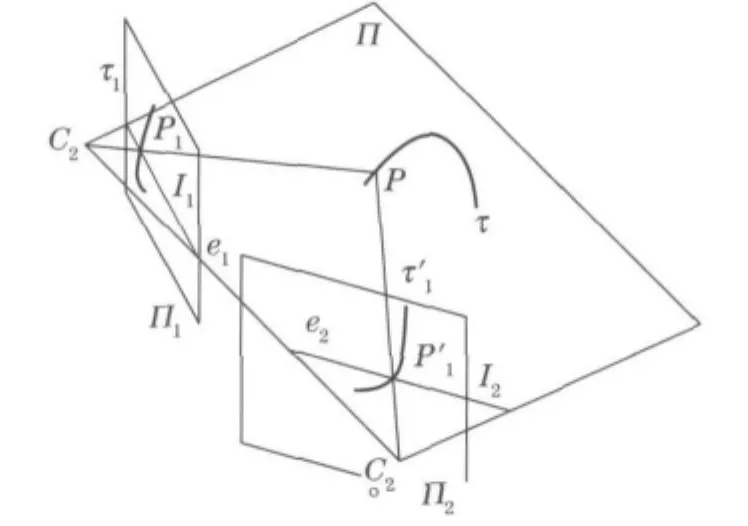
Fig.8 Center line bending measurement
ToreconstructP,thecorrespondingpointsP1andP′1mustbefixed.Followingtheprincipleofprojectivegeometry,givenanimagepointP1,its matchingpointP′1belongstothelinesegmentI2,whichisformedbyintersectingtheplanePC1C2withtheimageplaneΠ2.Thislineiscalledthe epipolarlineassociatedwithP1,whiletheepipolarlineI1associatedwithP′1isthelineformedby intersectingtheplanePC1C2withtheimageplaneΠ1.Thesetwolinesarecalledconjugateepipolar lines.
Anypointonthefirstepipolarlinehasits correspondingpointonthesecondepipolarline,andviceversa.Thisrelationshipiscalledthe“epipolarconstraint”[11].Usingthenotationof thefundamentalmatrix,wecanexpresstheepipolarconstraint.ForapointP1,theprojective representationofitsepipolarlineisrepresented as
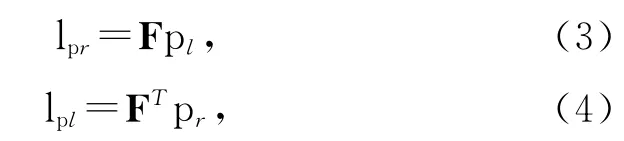
wherelpr,lplare the epipolar lines,prandplare the images ofP1,and Fisthefundamentalmatrix.
IfP1andP′1aretheimagesofthe3DpointPonbothimagesand(R,T)isthetransformmatrixfromthefirstcameratothesecondcamera,fundamentalmatrixcanbeexpressedas

where Al,Ararethecalibrationmatricesofboth cameras,Sistheskew-symmetricmatrixofT,andRandTarethetransformmatrixs.
AsshowninFig.9,thecenterpointscanbe reconstructedbyusingthe“epipolarconstraint”,whichcandramaticallyreducethesearchingand calculatingwork.Thenthedeformedcenterline canbefittedthroughthereconstructedcenter points.

Fig.9 Reconstructing the center point by using epipolar constraint
4.3 Measurement of cross-section rotation deformation
To measure the rotation deformation of crosssection,two parallel stripes were printed on the surface of cable harness specimen.When the crosssection rotated around the center line,the variety of angle between the stripes and the center line was measured.Then,the rotation deformation was represented byθ1,θ2,θ3…,asshowninFig.10.

Fig.10 Cross-section rotation measurement
4.4 Comparison and analysis
Thedeformationandmotionofamotional cableharnessspecimenwereexperimentallymeasuredandrecorded.Thesamekindsofdatawere alsoobtainedbynumericalsimulation.Comparisonbetweenthetwogroupsofdatacanrevealhow wellthesimulationmodelreflectsthereality.Snapshotsfromthescreenwereusedtoillustrate theresultsasshowninFig.11.
Thecomparisonoftheexperimentalresultsto thesimulationresultsshowsthattherealandsimulatedcableharnessesexhibitqualitativelysimilar deformation.Adisagreementintwistingwas causedbyplasticdeformationsoftherealcableharnesssheathandtherelativemotionbetweenthe sheathandthecables.Thelocaldistortionof specimens,calibrationerrorandcalculationerror ofbinocularvisionarealsosourceofmeasurement errors.
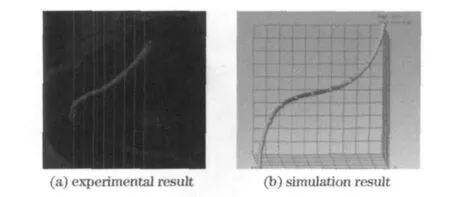
Fig.11 Cable harness profile
5 Conclusions
Todemonstratethevalidityofathinrod modelformotionalcableharness,aseriesofexperimentswasconducted.Thecomparisonofsimulatedandmeasuredresultsshowedthatthesimulationmodelcouldrepresenttherealmotionalcableharnesswell.
Abinocularvisionsystemwasdevelopedand usedtomeasurethemotionanddeformationof motionalcableharness.Itwasproventhatbinocularvisiontechniquewasafeasibleandconvenient techniquetoovercomedifficultiesinthemeasurementofmotionanddeformationofflexiblecable harness.
Thissystemmightalsobesuitableformeasurementofotherslenderflexibleobjectssuchas dragrope,ROVtether,andsurgicalsuture.In thesefields,theprofilemeasurementisstilla difficultproblem.
However,moreresearchneedstobedone.We couldonlycomparethespringforceattheattachmentpoint.Theprecisestrainandstressofinner pointsofthemotionalcableharness(beneaththe thermoplasticsheath)couldn’tbeobtained.Soit wasimpossibletomakeadirectvalidationofthe governingequationsofthesimulationmodel.Developinganewstrainandstressmeasurementsys-temisourfuturework.
[1]J Profeta J A,Vogt III W G,Mickle M H.Torque disturbance rejection in high accuracy tracking systems[J].IEEE Transactions on aerospace and electronic systems,1990,26(2):232-237.
[2]Michael K. Multritarget-multisensor tracking:Advanced applications[M].Storrs,Connecticut:YBS Publishing,1990:39-41.
[3]Love A E H.A treatise on the mathematical theory of elasticity[M].New York:Dover Publications,1944:20.
[4]Liu Yanzhu.Nonlinear mechanics of thin elastic rod[M].Beijing:Publishing House of Tsinghua University,2006:25-35.(in Chinese)
[5]Wang Chunsheng,Ning Ruxin,Liu Jianhua,et al.Dynamic simulation and disturbance torque analyzing of motional cable harness based on kirchhoff rod model[J].Chinese Journal of Mechanical Engineering,2012,25(2):346-354.(in Chinese)
[6]Bradley J B,Frederick R D,Meyer N,et al.Three dimensional dynamics simulation of slack tether motion in an ROV system[C]∥Proceedings of the Thirteenth(2003)International Offshore and Polar Engineering Conference.Honolulu,Hawaii,USA:[s.n.],2003:674-681.
[7]Bradley J B,Nahon M,Cote G.Validation of a finite element model for slack ROV tethers[C]∥Oceans 2000MTS/IEEE Conference & Exhibition 2.Holland:IEEE Conference Publication,2000:1129-1136.
[8]Bert C W,Malik M.Differential quadrature method in computational mechanics:a review.[J].Appl Mech Rev,1996,49:1-28.
[9]Hu Yujia,Zhu Yuanyuan,Cheng Changjun.DQEM for large deformation analysis of structures with discontinuity and initial displacements[J].Engineering Structures,2008,30(5):1473-1487.
[10]Wang Xiaoyin,Liu Jianhua,Ning Ruxin,et al.Pose measurement method of motional cable harness based on binocular vision technology [J].Optical Technique,2010,36(5):725-729.(in Chinese)
[11]Elias R,Robert Laganière.Projective geometry for three-dimensional computer vision[C]∥World Multi Conference on Systems,Cybernetics and Informatics(SCI 2003)V01.5:Computer Science and Engineering.Orlando,FL,USA:[s.n.],2003:27-30.
(Edited byCai Jianying)
猜你喜欢
杂志排行

Journal of Beijing Institute of Technology的其它文章
- Effects of laser beam divergence angle on airborne LIDAR positioning errors
- Large deflection of annular throttle-slices in shock absorbers
- Low-complexity transceiver design scheme based on channel null-space feedback
- Active contours with normally generalized gradient vector flow external force
- Bicycle capacity of borrowed-priority merge at unsignalized intersections in China
- Distribution of driving trajectory of passenger car in highway horizontal curves