EXPERIMENTAL STUDY OF FORCED SHOCK TRAIN OSCILLATION IN ISOLATOR UNDER ASYMMETRIC INCOMING FLOW
2011-10-08CaoXuebinZhangKunyuan
Cao Xuebin,Zhang Kunyuan
(College of Energy and Power Engineering,NUAA,29 Yudao Street,Nanjing,210016,P.R.China)
INTRODUCTION
To prevent the pressure rise associated with the precombustion shock train from affecting the flow through the scramjet inlet,a constant(or nearly-constant)area duct called an isolator is inserted between the inlet and the combustor of the scramjet engine.In fact,the low-frequency oscillation burning often occurs in the ramjet combustor with the low frequency and the large amplitude pressure fluctuation[1-2].So,the isolator has to withstand the pressure peak from the combustion chamber,and sustain its large amplitude of the pressure fluctuation to ensure that the inlet can work normally and continuously.Therefore,it is very interesting to experimentally investigate the isolator flow phenomenon influenced by the low-frequency pressure fluctuation in the combustion chamber.However,the study of this type of pipe flow is mostly concentrated in transonic channel[3-5]. For supersonic combustion ramjet engines,there are a few researches about the forced shock train oscillation in the isolator.
When the back pressure fluctuation of the isolator periodically changes,the length of the shock train in the pipe cyclically changes.In the forced shock train oscillation region(Fig.1),the pressure is periodically affected by the shock wave,and then the complex flow phenomena appear.Previous researches about the steady back pressure[6-8]prove that the isolator can isolate the chamber pressure from affecting the inlet.But the ability of isolating the pressure fluctuation from affecting hypersonic inlet has not been known.The back pressure fluctuation propagates upstream in the subsonic boundary layer,and then what is the law of the attenuation of the pr-essure fluctuation? To address the above problems,this paper designs the isolator experiment under the asymmetrical incoming flow[9].Then,the propagation mode and the attenuation of the back pressure fluctuation are analyzed.
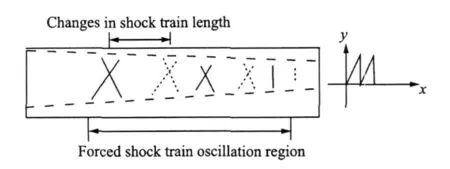
Fig.1 Sketch of forced shock train oscillation in isolator
1 EXPERIMENTAL APPARATUS
Experimental equipment composes of the high-pressure gas source,the control valves,the settling chamber,the Laval nozzle,the boundary layer development section, the isolator with spillage window,and the generator of back pressure fluctuation. From left to right in Fig.2,high-pressure air flows through a Laval nozzle to form supersonic flow,and then it flows through a certain length of the boundary layer development section to form thick boundary layer.The boundary layer of the upper wall can be excluded through the spillage window at the entrance of the isolator to form the asymmetry supersonic flow and to simulate the actual thick boundary layer on the forebody of a vehicle.
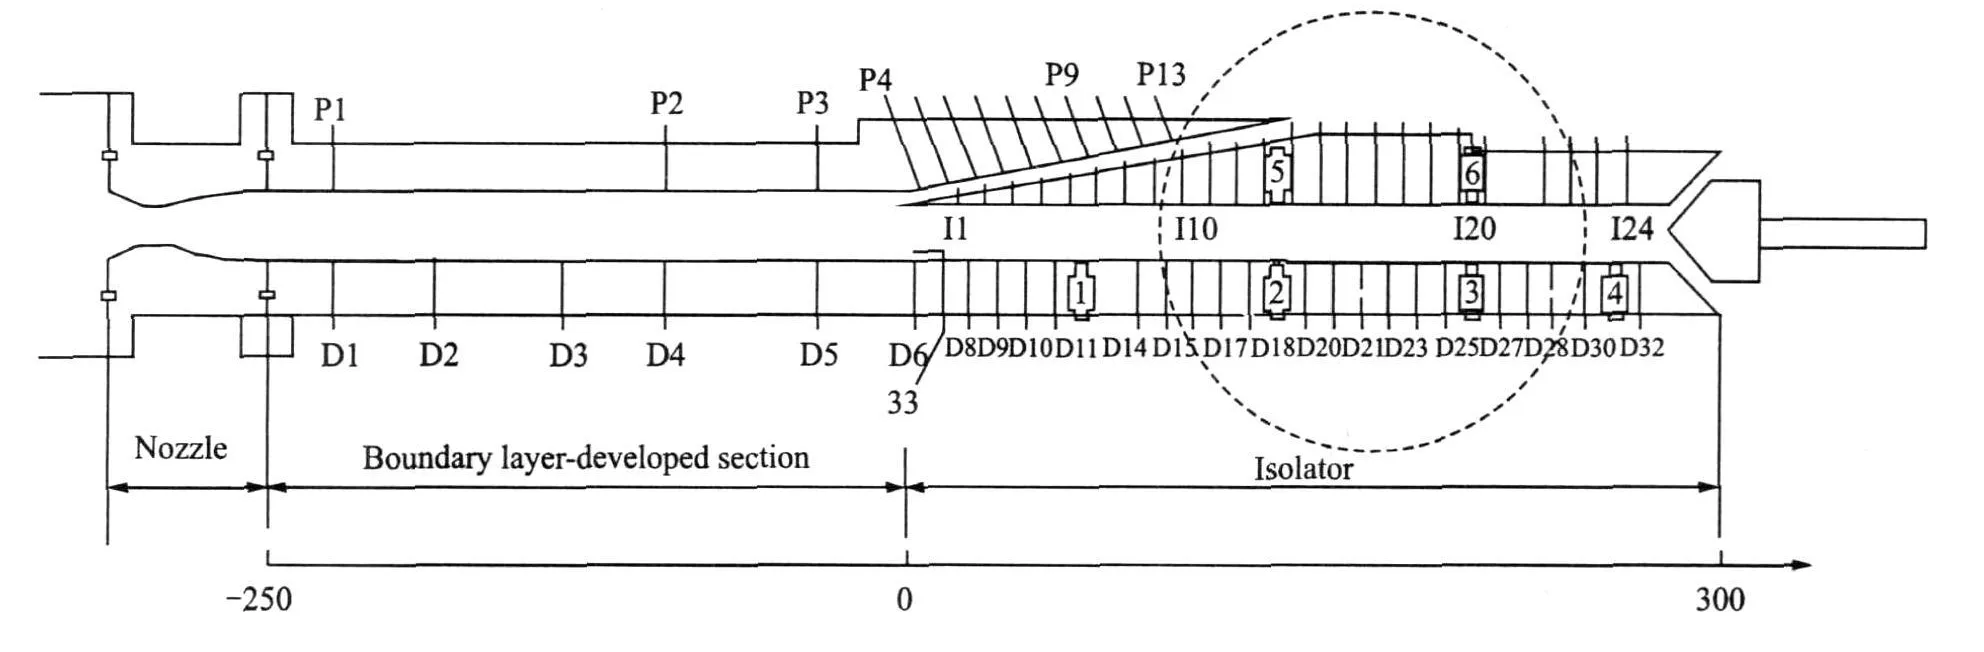
Fig.2 Schematic sketch of isolator
In order to produce the periodic back pressure fluctuation,a tail cone(Fig.3)is controlled by the straight line stepping motor.The curve shapes of the design displacement of the tail cone are the sine wave and the saw tooth wave respectively,and the frequencies are 2 and 4 Hz(Fig.4).
The test section has a 45 mm by 20 mm cross section,and its lengh th is nominally 300 mm with glass schlieren windows taking photographs.The expansion angles of the lower and the upper walls are about 0.5°.The length of the boundary layer development section is 250 mm.

Fig.3 Generator of back pressure fluctuation

Fig.4 Displacement of tail cone
A total pressure probe is placed at the settling chamber upstream to measure the total pressure of the gas entering the nozzle.In order to measure the parameters of the boundary layer,a probe which can move up and down is located at the entrance.Pressure taps are located along the centerline of the lower and the upper walls of the isolator,with a minimum space of 11 mm.Measurements of the wall static pressure are made with a TSI98RK electronic scanning valve calibrated within±0.05% of their full-scalevalves.Six dynamic pressure sensors are located on the position named by number 1 to 6 in Fig.2.The displacement of the tail cone is measured through the displacement sensor.Dynamic pressure data is recorded by the LMS SCADAS III multi-channel data acquisition system.The sampling frequency is 4 096 Hz.
The total pressure of the tunnel free-stream entering the test section is 360 000 Pa.The incoming flow is cold,and the total temperature curve is about 300 K.The isolator entrance flow contains one thick boundary layer with a thickness of 26.5% of the duct height.The Mach number on the core flow at the isolator entrance is about 1.98.
2 EXPERIMENTAL RESULTS
2.1 Pressure fluctuation
Figs.5,6 are the lower and the upper wall pressure fluctuations when the shape of the back pressure curve is saw tooth.Figs.7,8 are the lower and the upper wall pressure fluctuations for the sine wave back pressure,and the number of the curve is the sensor number.Figs.5-8 show that the appearing time of the wall pressure fluctuation peaks in(measuring points 2 and 3,5 and 6)both the saw tooth and the sine wave is the same,and no phase difference exists.And at the same position along the flow direction(measuring points 2 and 5,3 and 6),the appearing time of pressure fluctuation peaks is also the same.These phenomena indicate that the wall pressure fluctuation is mainly induced by the forced oscillation of the shock train in the forced shock train oscillation region.
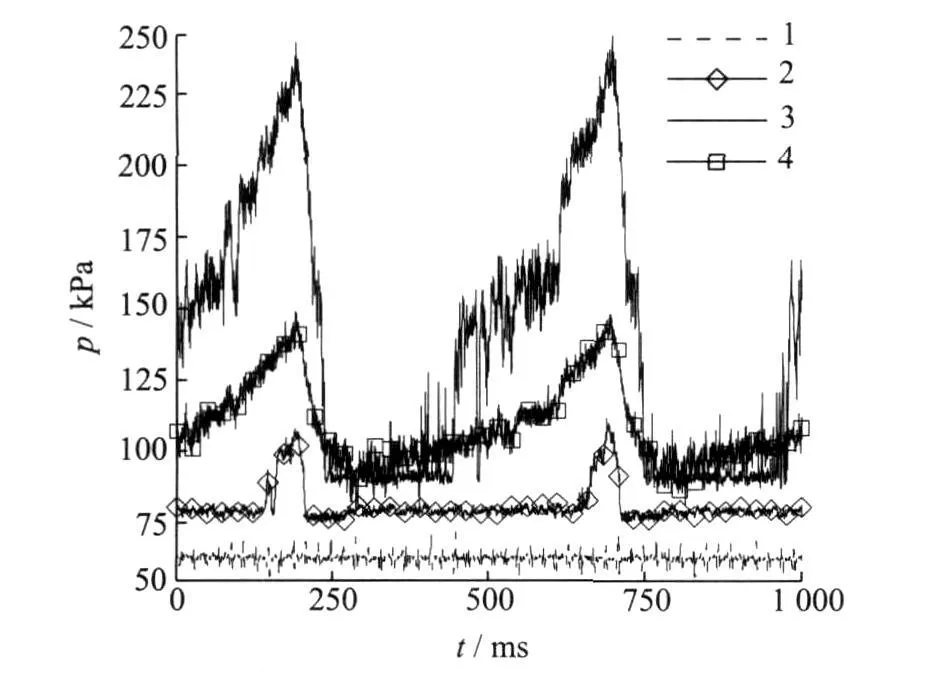
Fig.5 Lower wall pressure fluctuation for saw tooth wave back pressure
Fig.6 Upper wall pressure fluctuation for saw tooth wave back pressure

Fig.7 Lower wall pressure fluctuation for sine wave back pressure
Fig.8 Upper wall pressure fluctuation for sine wave back pressure
Under the condition of the saw tooth,the wall pressure fluctuation amplitude at the forepart of the isolator(25 k Pa,measuring point 2)is less than the wall pressure fluctuation amplitude in the rear of the isolator(145 k Pa,measuring point 3).The amplitude of pressure fluctuation(70 k Pa,measuring point 5)on the upper wall in the shock wave oscillation region is also smaller than that of the pressure oscillation amplitude(88 k Pa,measuring point 6).This indicates that the pressure fluctuation amplitude increases along the flow direction in the forced shock train oscillation region.However,the pressure fluctuation amplitude(145 k Pa,measuring point 3)at the end of the shock wave oscillation region is larger than the pressure fluctuation amplitude(56 k Pa,measuring point 4)at the tail of the isolator.This shows that the wall pressure fluctuation amplitude reduces along the flow direction between the end of the forced shock train oscillation region and the end of the isolator.It is noteworthy that the wall pressure oscillation amplitudes of the isolator are large,and the maximum amplitude of the wall pressure fluctuation is 3.16 times than the static pressureat the entrance of the isolator.
The experimental results under the sine wave condition are similar to the results under the saw tooth wave.The maximum fluctuation amplitude is 3.22 times than the static pressure at the entrance of isolator.
Fig.9 shows the pressure fluctuation at 191 and 290 mm from the entrance on the lower wall.The pressure fluctuations have the time delay,ΔT=9.4 ms,so the average propagation velocity of the pressure oscillation in the subsonic boundary layer traveling upstream is about 10.5 m/s.Fig.10 is the pressure fluctuation at 125 and 180 mm.It is also known that the upstream pressure fluctuation peak value have the time delay,ΔT=9.7 ms.The mean propagation velocity is found to be about 5.7 m/s for the upstream propagation.Under the sine wave condition,the time delay of the pressure oscillation peak value also exists(Figs.11 and 12),and the average propagation velocity is approximately 4.6 m/s.

Fig.9 Wall pressure fluctuation at 191 and 290 mm
Fig.10 Wall pressure fluctuation at 125 and 180 mm

Fig.11 Wall pressure fluctuation at 213 and 290 mm
Fig.12 Wall pressure fluctuation at 92 and 158 mm
From the analysis we can know that the mean propagation velocities are found to be the second characteristic wave velocity c-u,here c is the local sonic speed,and u the local flow speed.Therefore,low frequency back pressure oscillation propagates upstream by the second characteristic wave in the subsonic boundary layer,and affects the upstream wall pressure oscillation.But in the primary region of the shock oscillation,the second characteristic wave is difficult to be observed,because the wall pressure oscillation is influenced by the forced shock train oscillation.
2.2 Power spectrum
Fig.13 Power spectra
Fig.13 is the power spectrum charts of the pressure signal measured by number 1 to 6 sensors on the saw tooth wave and the sine wave operating mode,where the solid line is the saw tooth wave condition,and the dashed line is the sinewave condition in the chart.The power spectral density value uses the total pressure dimensionless.Under the saw tooth wave condition,the power spectral density value of the pressure signal measured by the first sensor has no obvious peak value.This sensor is located on the upstr-eam of the supersonic region,and is not influenced by the forced shock train oscillation.The second sensor is located on the forepart of the shock oscillation region,so the power spectral density value is large.It reaches the peak at the excitation frequency,and the harmonic phenomenon is obvious.The pressure signal power spectrum value measured by the third sensor located on the shock oscillation region terminal is largest.It has the largest value at the excitation frequency,but the harmonic phenomenon is not obvious.The power spectral density value of No.4 sensor located at rear part of the isolator is also large.The value reaches the highest point at the excitation frequency, but the harmonic phenomenon is not obvious.On the upper wall,the spectrum peak value of the measuring point 5 is large,and the harmonic phenomenon is obvious.The pressure signal of the measuring point 6 is similar to that of the measuring point 3,and the harmonic phenomenon is not obvious.
When the pressure oscillation propagates upstream,the harmonic phenomenon becomes obvious.This indicates that the pressure profile is greatly disturbed and the harmonic component increases a lot because of the shock train/boundary layer interaction,when the pressure fluctuation propagates upstream in the subsonic boundary layer.
On the sine wave operating mode,the harmonic phenomena of the pressure signal of the measuring points 2 and 5 are not obvious,which is different from the saw tooth wave.These phenomenaindicate that the back pressure profilehas the tremendous effect on the energy distribution of wall pressure oscillation.Because the back pressure fluctuation amplitude of the sine wave is larger than that of the saw tooth wave,the spectrum value of the pressure signal is larger than that of the saw tooth at the same measuring point.
2.3 Pressure fluctuation variance
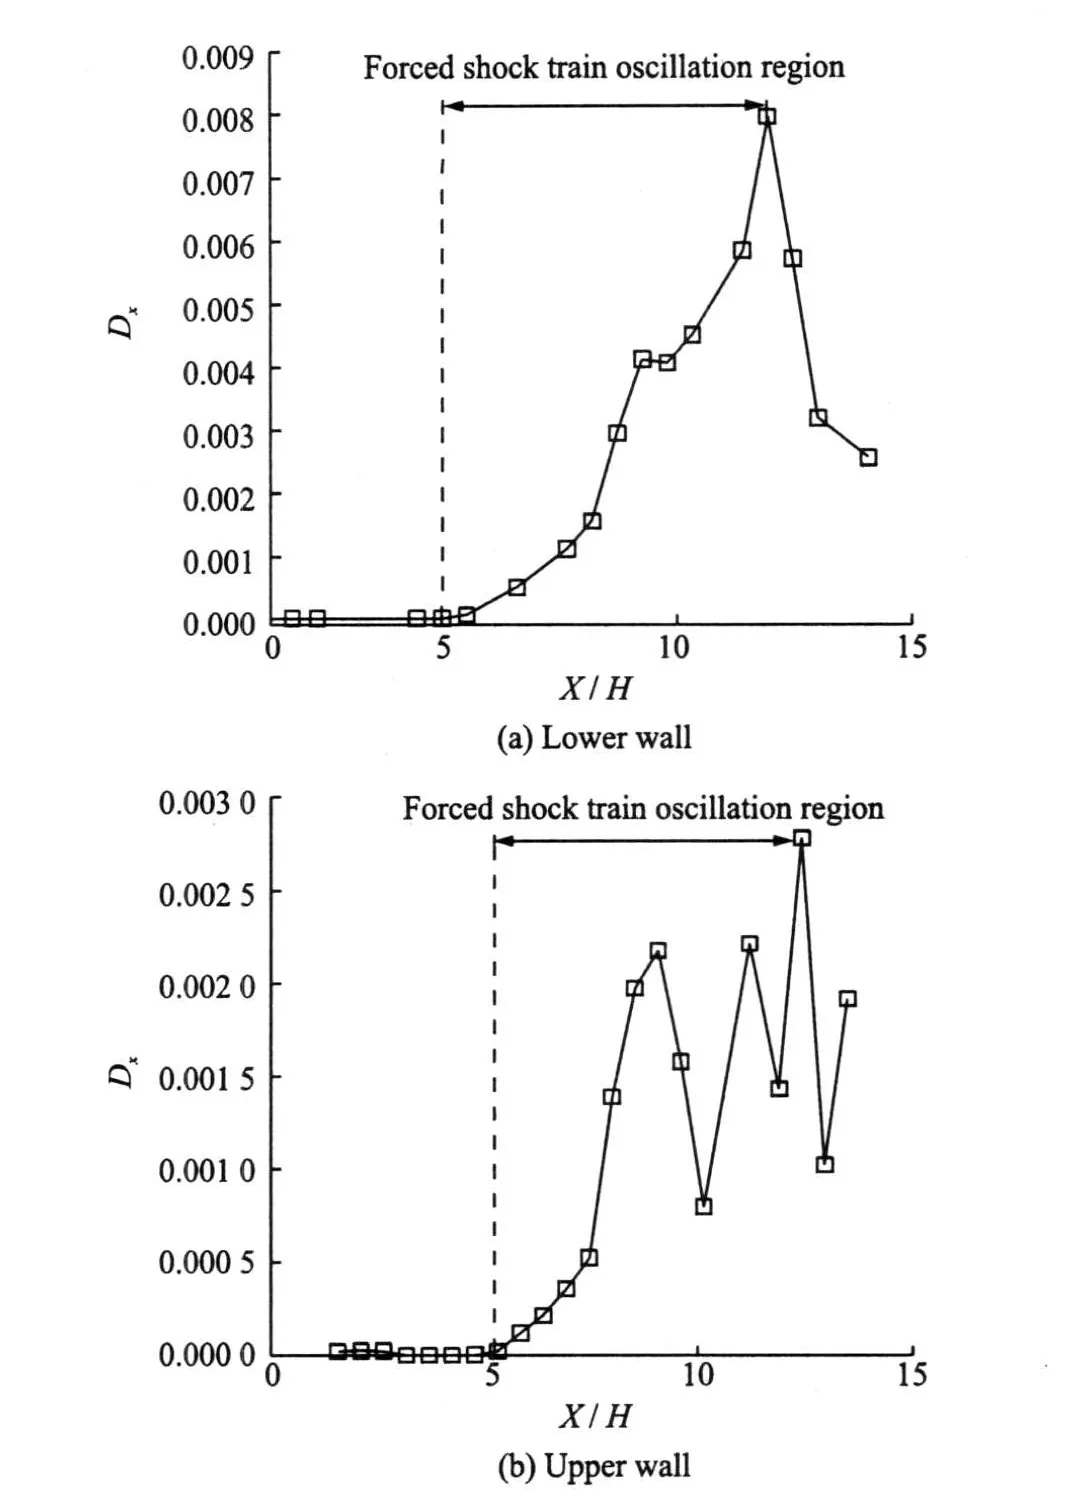
Fig.14 Variance of wall pressure fluctuation in sine wave
Fig.14 is the charts of the pressure oscillation variance on the lower and the upper walls when theback pressure oscillation is the2 Hzsine wave,where X is the distance from the entrance,and H the height of the isolator.From the exit to the shock oscillation terminal on the lower wall,the varianceof the pressure oscillation quickly rises.It indicates that the pressureoscillation amplitude increases.But in the shock oscillation region,the variance of the pressure oscillation rapidly drops,i.e.,the amplitude of the pressure oscillation rapidly reduces,and the variance is equal to zero in the upstream of the shock oscillation.This indicates that the pressure oscillation does not propagate to the upstream of the shock oscillation region.But the variance rule of the upper wall pressure oscillation has very large difference with the lower wall.In the shock oscillation region,the variance of the pressure oscillation presents the fluctuation shape.When the pressure taps reach the front of the shock oscillation region,the variance also approaches zero.About this phenomenon,we extrapolates that the enormous difference about the boundary layer thick-ness of the lower and the upper walls creates this phenomenon.
Fig.15 is the variance charps of the upper and the lower wall pressure fluctuation on the 2 Hz saw tooth wave operating mode.As can be observed that the variance of the lower wall pressure fluctuation rapidly drops in the forced shock train oscillation region,but the variance of the upper wall pressure oscillation fluctuates.

Fig.15 Variance of wall pressure fluctuation in saw thooth wave
The following four curves in Fig.16 are obtained by fitting the lower wall pressure fluctuation variance in the forced shock train oscillation region.Attenuation of wall pressure fluctuations accords with the exponential law on the lower wall with thick boundary layer.
Summarizing the above analysis,we can see that the isolator effectively isolates the periodic back pressure fluctuation from affecting the upstream undisturbed flow.Attenuation of wall pressure fluctuations in the forced shock oscillation region accords with the exponential law on

Fig.16 Fitted curve of wall pressure fluctuation variance
the lower wall.But it fluctuates on the upper wall.
3 CONCLUSIONS
(1)The isolator effectively prevents the periodic back pressure fluctuation from affecting the upstream undisturbed flow.In the primary region of the forced shock train oscillation,the wall pressure oscillation is induced by the forced shock train oscillation,thus the second characteristic wave is difficult to be observed.But in the rear part of the isolator as well as the forepart of the forced shock train oscillation region,the second characteristic wave obviously influences the upstream pressure oscillation.
(2)Attenuation of the pressure fluctuation variance of the lower wall with thick boundary layer accords with the exponential law in the forced shock train oscillation region.But it fluctuates on the upper wall with thin boundary layer.
(3)The harmonic phenomenon is obvious when the pressure fluctuation propagates upstream in the subsonic boundary layer.And the back pressure profile has obvious effect on the harmonic phenomenon.
[1] Ma Fuqua,Li Jian,Yang V,et al.The rmoacoustic flow instability in a scramjet combustor[R].AIAA 2005-3824,2005.
[2] Zhang Xiaomei,Xia Yunqing,Shan Hongbin,et al.Summarization of low-frequency oscillatory combustion study[J].Journal of Propulsion Technology,1996,17(1):47-53.(in Chinese)
[3] Sajben M,Bogar T J.Forced oscillation experiments in supercritical diffuser flows with application to ramjet instabilities[R].AIAA-81-1487,1981.
[4] Ott P,Bolcs A.Experimental and numerical study of the time-dependent pressure response of a shock wave oscillation in a nozzle[J].ASME J Turbo Machinery,1995(117):106-114.
[5] Bur R,Benay R.Experimental and numerical study of forced shock-wave oscillations in a transonic channel[J]. Aerospace Science and Technology,2006(10):265-278.
[6] Waltrup P J,Billig F S.Structure of shock waves in cylindrical ducts[J].AIAA J,1973,11(10):1404-1408.
[7] Sullins G,Mc Lafferty G H.Experimental results of shock train in rectangular ducts[R].AIAA 1992-5103,1992.
[8] Emami S,Trexler C A,Auslender A H,et al.Experimental investigation of inlet-combustion isolators for adual-mode scramjet at a mach number of 4[R].NASA,TP3502,1995.
[9] Zhang Kunyuan,Wang Chengpeng,Yang Jianjun,et al.Investigation of flow in isolator of hypersonic inlet[J].Journal of Propulsion Technology,2002,23(4):311-314.(in Chinese)
