A GNSS Signal Blind-decoding Algorithm at Low SNR
2011-03-09WANGYao王垚LUOXianzhi罗显志YUBaoguo蔚保国YANGShenyuan杨莘元
WANG Yao(王垚),LUO Xian-zhi(罗显志),YU Bao-guo(蔚保国),YANG Shen-yuan(杨莘元)
(1.College of Information and Communication Engineering,Harbin Engineering University,Harbin 150001,Heilongjiang,China;2.Hebei Satellite Navigation and Equipment Engineering Research Centre,Shijiazhuang 050081,Hebei,China)
Introduction
It is the vigorous development period of the satellite navigation signal design.GPS and Galileo all propose the respective new signals.In GPS modernization,three kinds of new civil signals are proposed,and GPS IIR-M launched the second civil signal L2C whose modulation is similar to GPS C/A code,and PRN code is compounded by CM and CL[1].GPS IIF launched the third civil signal L5 divided into two channels,i.e.pilot channel and data channel,which use different RPN codes[2].GPS III will launch the fourth civil signal L1C using Weil-code[3].Galileo also launched two experimental satellites,called as GIOVE A and B[4-5]used for carrying out the signal experiments.And in future,Galilieo will also launch new satellite navigation signals[6]in E1,E5 and E6.
There are many research institutions to carry out in-orbit satellite monitor activities.They mainly concentrate on signal monitoring of GIOVE A and B[7-9].However,these monitor experiments are all based on the high-gain dish antennas which are more than 30 meters in diameter.Although the high-gain antennas may effectively improve the signal-to-noise rat of receiving signal,they cost expensively and are not convenient for moving.Dr.Grace Gao[10]proposed a PRN code decoding method,but it can not estimate Doppler shift and code phase accurately,meanwhile,considers the modulation mode and code rate as known conditions.To improve it,a new satellite navigation signal blind-decoding method at low SNR is proposed in this paper.It estimates Doppler frequency and code rate by using spectral correlation theory.Wiped off Doppler shift,the navigation message bits are determined and removed by slide-correlating a small slice itself with the whole data.The start of the code is determined by stacking multiple periods of the whole data into a code period,and then the whole data is shifted to the start of the PRN code,and restacked.Then the individual period of PRN codes can be estimated after wiping off sub-carrier.
1 Signal Monitoring System
The structure of signal monitoring system,as shown in Fig.1,includes an L-band parabolic antenna of 2.4 m in diameter,with 26 dB gain and 6°beamwidth,controlled by satellite tracking software and indoor servo.The signal from the antenna’s feed passes through a band pass filter and LNAs and is sent to an Agilent 89 600 vector signal analyzer(VSA).The VSA can down convert the signal to I and Q base-band signals stores them in complex form for post-process.For general GNSS signals,the received SNR in the signal noise equivalent bandwidth is about-5 to 10 dB[10].The system’s precise time standard is provided by a rubidium clock.
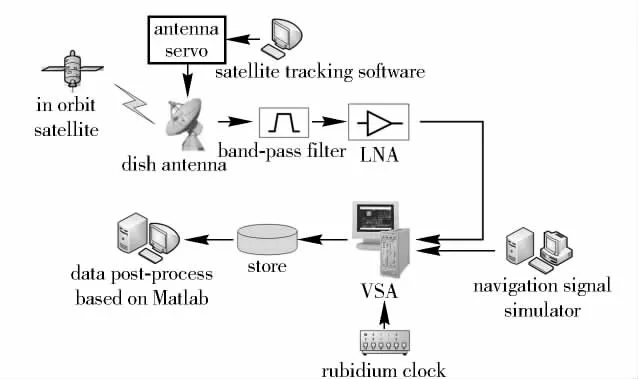
Fig.1 Diagram of signal monitoring system
2 Monitoring Algorithm
2.1 Signal Model
Most of satellite navigation signals are in CDMADSSS mode,and each satellite has its unique PRN code.The transmitted signal model can be expressed as

where P represents the signal power,dnthe data stream with data rate fdand data duration Td,fcand θ0the carrier frequency and initial phase respectively,n(t)the Gaussian noise,g(t)the pulse-modulation code expressed as

where ω (t)is the time-window of length Td,clthe PRN code with period N,code chip duration Tc,and pulse shape φ(t).The different modulations of signal are reflected in chip shape.There are BPSK,BOC(binary offset carrier)and BCS(binary coded symbol)[11-12].
The received signals are influenced by ionosphere,troposphere and stretched or compressed in time as a function of Doppler shift.Defined the coefficient kd=1 - fdop/fc,delay τdand attenuation α,the Eq.(1)can be rewritten as

In order to derive conveniently,the effect of attenuation and data stream can be ignored.Thus,the last equation can be rewritten as

The received signals are down-converted to baseband by VSA,as shown in Fig.2.Because that the local clock with a frequency deviation is different from the satellite clock,moreover,Doppler shift has to be considered,the signal collected by VSA contains residual carrier frequency.Assuming that the VSA’s local oscillation(LO)frequency differs from the carrier frequency by a fixed value fVSA,and its initial phase with respect to the carrier of incoming signal is θVSA,LO model can be expressed as

where

When fVSA≪fc,the above equation is tenable(For the 89600 VSA,the quantity fVSA/fc≤2 × 10-7.).Thus,the base-band signal can be given as

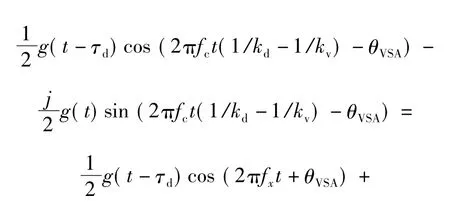
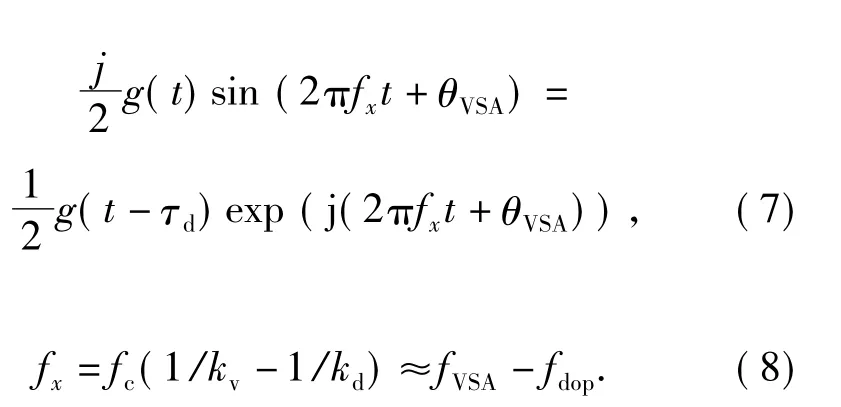

Fig.2 Block diagram of VSA system
2.2 Doppler Shift and Code Rate Estimatio n
In Eq.(7),the signal collected by VSA is a typical cycle-stationary signal.With the small dish antenna shown in Fig.1,the SNR is low,so the signal is buried in noise.The characteristics of cycle-stationary signal and noise can be conveniently separated by their cyclic spectrum,then,the parameters of signal can be estimated accurately.Based on the spectral correlation theory,the signal cyclic spectrum density(CSD)is derived as[13-14]

where α is the cycle frequency,Q(f)is FFT of chip waveform,k∈{Z}.It is known that there are several cycle frequencies,and the cyclic spectrum is relevant with Doppler shift,code rate and initial phase.When f=0,the envelope of signal cyclic spectrum is
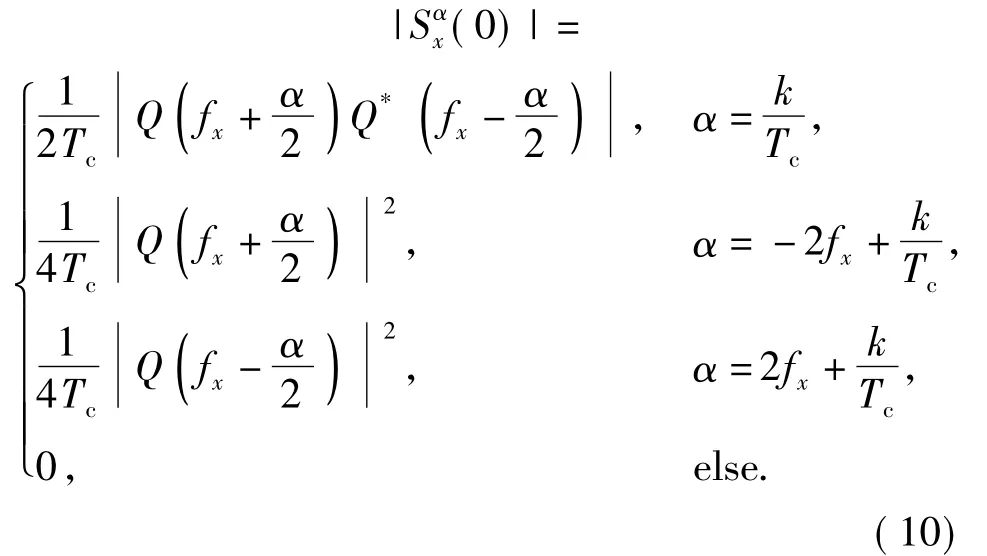
It is not difficult to observe that the maximum peaks are located in α = ± 2fx.Therefore,in the zero frequency cross-section of the envelope of CSD,the carrier frequency can be estimated by searching the maximum peaks in non-zero cycle frequencies.Moreover,the second maximum peaks are located at α = ±2fx±1/Tcin|0)|,therefore,the code rate can be estimated by determining the space between the maximum and second maximum peaks.The signal wiped off Doppler shift is called as raw signal in this paper.
2.3 Slide-correlation
The autocorrelation of raw signal can be expressed as


The last equation is simplified as autocorrelation of PRN code,including data bit,and wipes off the effect of carrier phase.And,it is periodical,because of the periodic property of PRN code.Thus,the space between correlation peaks is code period,denoted as T0.The small slice of the raw signal,which is less than a code period,can be denoted as

where t0is the duration of the slice of data.It is important that this slice of data can not contain a navigation data bit transition,that is,t0< td.On the other hand,the slice should be large enough to make the correlation peaks discoverable.The correlation function of slice data and raw data is
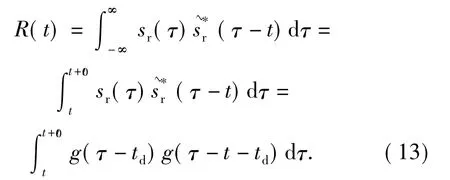
Its principle is shown in Fig.3.The first line is the collected raw data,and the second line denotes the navigation message bits or secondary code bits modulated in signal.Taking a slice data to slide-correlate with raw data,the correlation peaks occur whenever the slice aligns with similar versions of itself or flipped visions.Then the raw data is inverted with period T0,based on correlation peaks polarity.Stacking multiple periods of the flipped data,the transition point reveals the start of the RPN code period,τd.
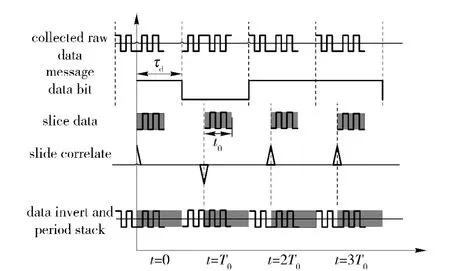
Fig.3 Principle of slide-correlation
Then,the raw data is shifted in time with τd,so the point of t=0 is the start of a period of PRN code.And,restacking multiple periods of the shifted data into one code period,the individual code chips are then visible over the noise.
2.4 Decoding Algorithm
In summary,the proposed satellite navigation signal decoding algorithm steps are shown in Fig.4.
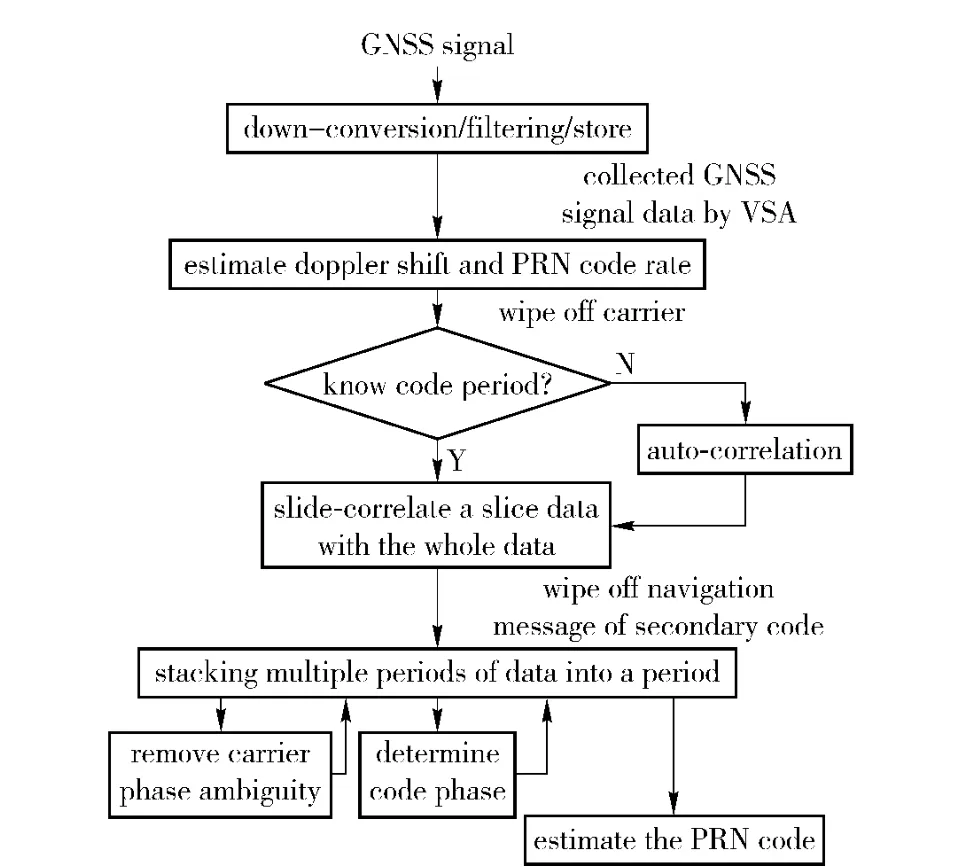
Fig.4 Decoding algorithm
3 Simulation and Verification
In order to verify the algorithm proposed above,a conventional GPS C/A signal is simulated,with carrier frequency 1 575.42 MHz,PRN code rate 1.023 MHz,code period 1 023,message data 50 Hz.Note that the secondary code is considered also.Considering the real situation shown in Fig.1,the lowest SNR is about -5 dB.Thus,SNR of simulated signal is -5 dB,the signal is buried in noise and it is not resolved from noise in time-domain.
The signal data is collected by VSA,and 200 ms data is read into computer.The cyclic spectrum of the signal is shown in Fig.5 and Fig.6.In order to improve the calculation speed,a fast Fourier transform accumulation method is used[15].As shown in Fig.6,the highest side peaks are located in ± 2.5 MHz,while,the second side peaks are located in ±3.523 MHz and ±1.477 MHz respectively.So it is found out that Doppler shift fxis 1.25 MHz and the code rate is 1.023 MHz,based on Eq.10.
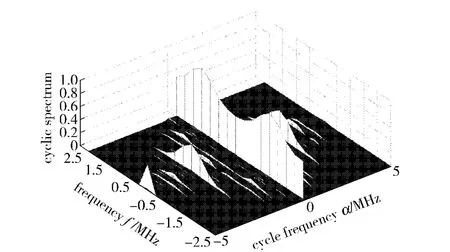
Fig.5 Cyclic spectrum(SNR= -5 dB)
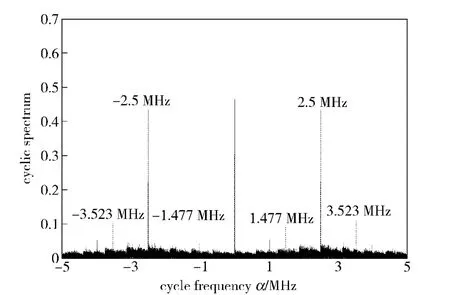
Fig.6 Frequency cross-section(f=0 Hz)
Wiped off Doppler shift,the calculated code period is 1 ms,according to Eq.(14).Taking a small slice of data,whose length is less than 1 ms,to correlate with whole data,the result is shown in Fig.7.It can be seen that a large peak at time 0,due to the alignment of both the signal and the noise.The other peaks are spaced in 1 ms intervals,because the signal PRN code repeats every 1 ms.The peaks are positive or negative,because the signal PRN code is modulated by the polarity of message data or secondary code.Fig.8 shows the in-phase and quadrature channels of periodic staking of signal with Doppler compensation and message data wiped off.The start of the PRN code is determined by estimating the transition point ofⅠchannel.Then,the whole data is shifted to the start of the PRN code,and restacked into one code period.The individual code chips are now visible over the noise.Fig.9 shows the first 0.02 ms.The whole code sequence is thus revealed.
4 Conclusions
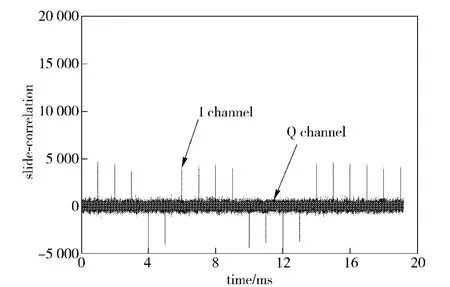
Fig.7 Slide-correlation results
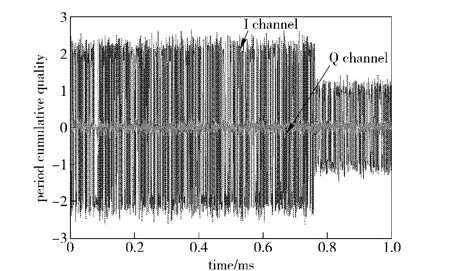
Fig.8 Result of periodic stacking
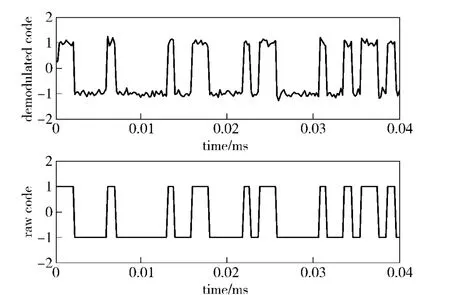
Fig.9 Estimated PRN code
In order to research the performance of satellite navigation signal,the RPN code monitoring has become one of the most important measures[16].However,there are few papers about the PRN code monitoring method home and abroad.The received signals are usually buried in noise and can not be revealed in time-domain.A satellite navigation signal monitoring based on small dish antenna is proposed.Moreover,a satellite navigation signal decoding algorithm at low SNR is put forward.The simulation results show that the proposed algorithm is available,and can be applied in the signal monitoring system.However,the preci-sion and efficiency of the algorithm should be further studied.In a word,it is very useful for the satellite signal design and development of multi-mode receiver.
[1]GPS Joint Program Office.GPS interface specification ISGPS-200[S].Revision D,IRN-200D-001.EI Segundo:CES,2006.
[2]GPS Joint Program Office.GPS interface specification ISGPS-705[S].EI Segundo:CES,2003.
[3]GPS Joint Program Office.GPS interface specification ISGPS-800[S].EI Segundo:CES,2007.
[4]Peijs K.First Galileo satellites named GIOVE[R].ESA Press Release,2005.
[5]ESA.ESA’s most advanced navigation satellite launched tonight[R].ESA Press Release,2008.
[6]ESA.Galileo OS SIS ICD[S].Draft 1,Galileo Joint Undertaking,2008.
[7]Rooney E,Unwin M,Gatti G,et al.GIVOE-A in orbit testing results[C].Proc of ION GNSS 20th ITM,US Manassas:ION,2007:467 -477.
[8]Gao Grace Xingsin,Akos D M,Walter T,et al.GIOVEB on the air:understanding Galileo’s new signals[J].Inside GNSS,2008,3(4):34-37 .
[9]Soellner M,Kurzhals C,Kogler W,et al.One year in orbit-GIOVE-B signal quality assessment from launch to now[C].European Navigation Conference-GNSS EUGIN,2009:1 -11.
[10]Gao Grace Xingxin.Towards navigation based on 120 satellites:analyzing the new signals[D].California:Stanford University,2008.
[11]Betz J W.The offset carrier modulation for GPS modernization[C].Proc of ION NTM 1999,US Manassas:ION,1999:639-648.
[12]Hegarty C,Betz J W,Saidi A.Binary coded symbol modulations for GNSS[C].Proc of ION 60th AM,US Manassas:ION,2004:56-64.
[13]Gardner W A.Spectral correlation of modulated signals:part 1-analog modulation[J].IEEE Trans Communication,1987,35(6):584 -594.
[14]Gardner W A.Spectral correlation of modulated signals:part 2-digital modulation[J].IEEE Trans Communication,1987,35(6):595 -601.
[15]HUANG Zhi-tao,ZHOU Yi-yu,JIANG Wen-li.Cyclic stationary signal processing and application[M].Beijing:Science Press,2006.(in Chinese)
[16]Nagle T J.GPS civil monitoring performance specification[S].DOT-VNTSC-FAA-09-08,EI Segundo:Global Positioning Systems Wing,2009.
猜你喜欢
杂志排行
Defence Technology的其它文章
- Deployable Antenna with Compact Ortho-mode Transducer and Feeding Systems
- Numerical Simulation on Flow Control for Drag Reduction of Revolution Body Using Dimpled Surface
- A Classification Algorithm for Ground Moving Targets Based on Magnetic Sensors
- Stability of Composite Braking Produced by Retarder and Braking System
- Study of Load Modeling Technology on Hardware-in-the-Loop Simulator of Gun Servo System
- Study on Instable Combustion of Solid Rocket Motor with Finocyl Grain
