Weighted Multi-sensor Data Level Fusion Method of Vibration Signal Based on Correlation Function
2011-03-01BINGuangfuJIANGZhinongLIXuejunandDHILLON
BIN Guangfu , JIANG Zhinong , LI Xuejun, and DHILLON B S
1 Diagnosis and Self-recovery Engineering Research Center, Beijing University of Chemical Technology,Beijing 100029, China
2 Hunan Provincial Key Laboratory of Health Maintenance for Mechanical Equipment,Hunan University of Science and Technology, Xiangtan 411201, China
3 Department of Mechanical Engineering, University of Ottawa, 161 Louis Pasteur, Ottawa K1B 6N5, Canada
1 Introduction
With the development of fault diagnosis and signal processing technology, data fusion has gained widespread use in different areas of measurement. The concept of multi-sensor data fusion and integration has been applied in military applications for many years[1–3]. Its applications have been in areas where the desired output of an analysis cannot be measured directly[4–6]. Nonetheless, the approach has gained widespread use in areas such as medical imaging, non-destructive testing, remote sensing, and fault diagnosis[7–10].
There are many ways and models of data fusion in different fault diagnosis areas. In the area of rotary machine fault diagnosis, the data fusion model can be referred to the functional model presented by the Joint Directorate of Laboratories, the United States Department of Defense[11–12].Relative to the characterization of information, it is noted that the data fusion can be divided into three levels: data level fusion, feature level fusion, and decision-making level fusion, in which the method and effect of three levels fusion are different. The data level fusion is the process of data integration and analysis for the original measuring data without pre-processing to reflect the real state of target as far as possible. Data fusion can be developed at the data level, feature level, or decision-making level, while the choices of different fusion level are mainly depended on the characteristics of targets, the cost of implementation, and fusion performances. At the data level fusion, the estimated uncertainty factors or prediction the machine status can be determined by using the algorithms of quantity form, such as Kalman filtering[13]; for the feature level fusion, many methods are employed from the pattern classification or identification areas, such as intelligent neural network[14–15];for the decision-making level fusion is mainly based on the methods of uncertainty measurement, such as Bayesian rule,D-S evidence theory, and fuzzy decision-making[16–17].
The reliability and accuracy of rotary machine fault diagnosis’s result are closely related to the measuring data.As the differences of sensor’s precision and some random factors are difficult to control, the actual measurement signals are far from the target signals. Data fusion can effectively deal with the noise, non-effective signals, and integrate the measured data to make it more accurate. The method of multi-sensor data fusion is an important development direction of fault diagnosis, which can make use of the information from multi-sensors to reduce or eliminate the information’s uncertainty of individual sensor,including the sensor’s measuring accuracy and the random factors in the process of measurement for improving the accuracy and precision of fault diagnosis’ result.
In the failure analysis process of vibration signals from rotary machine, due to the interaction of common failure mode, the failure mode data usually have different degrees of intercross[18–19]. For example, the rotor imbalance fault and rotor misalignment fault are manifested with abnormalities in varying degrees of vibration signal; from the view point of fuzzy set theory, the application of conventional signal analysis methods to deal with the intercross problem of these two types of failure mode data easily leads to the miscarriage of justice[20–21]. The traditional data fusion methods, such as classical inference and weighted averaging algorithm usually lack dynamic adaptability; they can not adapt to the differences of temperature, operation, and environmental random factors in the process of measuring. The multi-sensor information fusion technology based on D-S evidence theory is applied to the rotary machine fault identification, and the accuracy of fault diagnosis has improved, however, the fusion effect needs to be improved because the leaked-judge phenomena are still appear when the threshold value of failure determination is large[22–23]. Therefore, to meet the need of eliminating or reducing the uncertainty effect of the rotary machine fault diagnosis, and to further improve the measuring precision and accuracy of vibration signal in the process of rotary machine fault diagnosis, this paper presents a novel approach to determine the weighted value of multi-sensor vibration signal data level fusion based on correlation function analysis.
In section 2, by using the correlation function and data level fusion, the way to fast determine the weighted value of sensors on the basis of correlation measure of real-time data tested in the fusion process is presented. Then in section 3, we compare the dynamic adaptability, precision,fault-tolerance, and operability of proposed approach with the traditional weighted averaging approach through simulation and experiment analysis. Consequently, the simulation and experiment results analysis are presented in section 4, followed by discussions and conclusions.
2 System Data Level Fusion Processes
2.1 Correlation function
There are two certainty and limited power signals x(n)and y(n), respectively. For their causal relationship, the correlation coefficient ρxybetween x(n) and y(n) is expressed by:

In the vibration signals process, the correlation function can be used to describe the correlation measure for instantaneous value of the random sample function in different time. Autocorrelation function can be described as the instantaneous dependency relationship for the same random sample function in different time, which is also reflected by the cross compactness performance of the same random vibration signal waveform moving with time coordinate. Autocorrelation function of the discrete random vibration signal is expressed as follows:

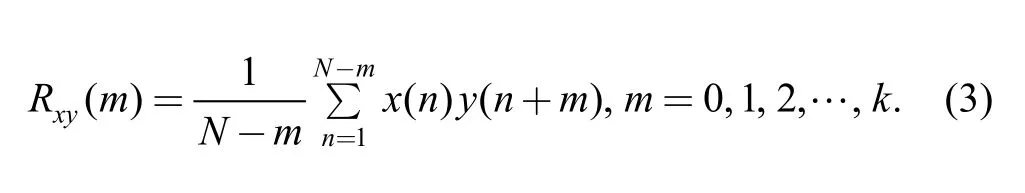
Cross-correlation function of vibration signals can be described as the dependency relationship of two different random samples function in different time, which is also reflected by the cross compactness performance of two random vibration signal waveforms moving along the time coordinate. The cross-correlation function of discrete random vibration signal is expressed as follows:
The cross-correlation function can directly reflect the correlation of two signals, and it also is the measure of waveforms’ similarity.
2.2 Data level fusion based on correlation function

Fig. 1. Weighted fusion model
Multi-sensors with same precision are measured on different parts of the same goal, and the validity of measuring data may be fuzzy when the sensor experiences unexpected situations such as strong external interferences,physical damage of sensor, and sensor failure. Under such conditions precision characteristics of sensors to distribute the weighted value is inappropriate. The data level fusion approach can distribute the weighted value based on the correlation measure of one signal with another signal[26–27].
2.2.1 Weighted value determination
Compared with the traditional methods of weighted average based on the precision of sensors, and self-adaptive weighted fused algorithm based on the prior knowledge about sensors to determine the weighted value, the data level fusion based on correlation function weighted method can take full advantage of the correlation function based on real-time measured signals to adjust the weighted value,and take into account the precision of sensors and random factors synthetically. To analyze the correlation function of any signal with others, the overall correlation measure is given greater weighted value for signal. More specifically,the signal that reflected the state of target has more energy.The energy of signal is usually used to express the correlation measure. Furthermore, the signal that has greater energy will have greater correlation measure.

The energy of discrete signal is expressed as follows[28]:
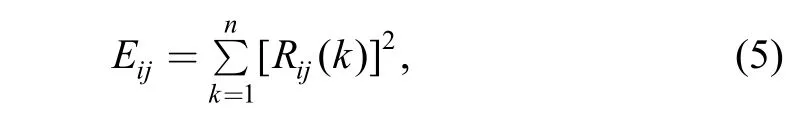
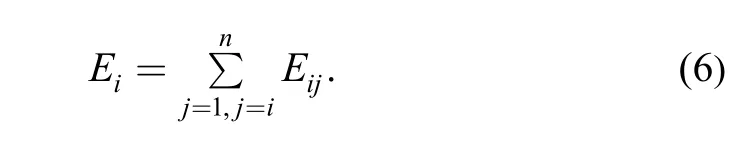
Where Eijis the correlation energy of signal after cross-correlation operation. The total correlation energy Eiof signal i correlated with other signals can be expressed as
In order to mark obviously the target signal, the energy of correlative signal is usually used to express the correlation measure. According to the past experiences, it is noted that the weighted value is directly affected by the correlation measure, thus, we can consider that the weighted value wiis the direct proportion of the energy of correlation function[29]:
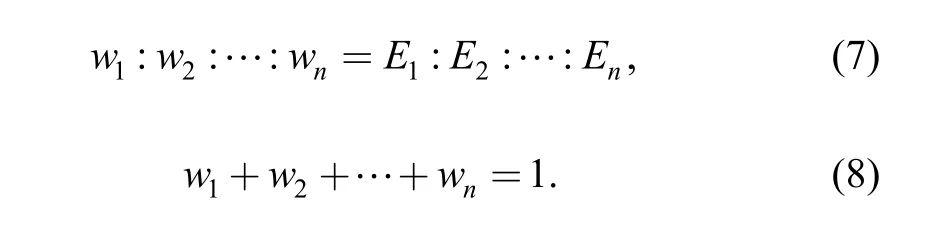
Therefore, we can get the weighted value of each signal through the above two equations, and the result of data level fusion:

2.2.2 Characteristics
(1) Simple arithmetic and easy to use. The method directly analyzes the correlation measure of real-time data,and then it determines the weighted value without having the prior knowledge about sensors and considering the external random factors. Thus, this method, to determine the weighted value, is simple and easy to use.
(2) Good dynamic adaptability. The weighted value of this method is determined after performing the correlation analysis for the real-time data. In other words, for any tested sensor signal, its weighted value is corresponding adjustment along with the change of correlation measure to other signals. Thus, it has better dynamic adaptability.
(3) Strong anti-jamming performance. It is assumed that measured vibration signalscontain noiseand useful signal si(n), because the rotary machine signal s(n) is periodic signal. Thus, we can get the cross-correlation functionfor any two signals:

It is generally believed that the relationship between signal and noise, noise and noise are not relevant[30–31], thus,we get:

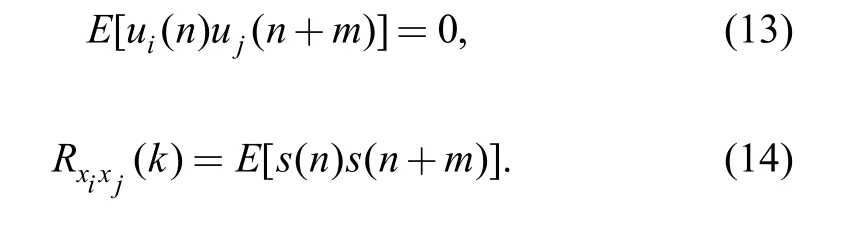
It can be noted from Eq. (14) that the distribution of the weighted value method is not subjected to unrelated noises,but only to useful signals and correlation measure of other signals. Therefore, the presented method has strong anti-jamming performance.
3 Simulation and Experiment
3.1 Simulation analysis
It is assumed that the measuring signal is standard sine signal, and collected five groups of vibration signal by simulating sensors, as shown in Figs. 2(a), 2(b), 2(c), 2(d),and 2(e), respectively, in which signals 1, 2, and 3 are sine signal with the same amplitude from 1.5 mm to 2 mm;signal 4 is no signal, i.e., simulated the sensor failure;signal 5 is the white noise with 2 mm amplitude, i.e.,simulated the situation that sensors have not collected useful signal. As the state of collected data is the same, it can be seen that sensors have the same precision in the process of data acquisition.
According to the data level fusion algorithm based on correlation function, we can get the weighted value: w1=w2= w3= 0.331 8, w4= 0, and w5= 0.004 6, and obtain the result of data level fusion, as shown in Fig. 2(f). It can be noted that w4and w5are far less than w1, w2, and w3, and satisfy the actual situation (i.e., signals 1, 2, and 3 are the effective simulating signals, in the nature of things, should be distributed correspondingly with larger weighted value).Therefore, this method can effectively inhibit unrelated signal (i.e., such as signal 5) in the process of data acquisition, and can effectively fuse useful information when parts of sensors are considered failed (i.e., such as sensor 4).
On the other hand, we can get the result of data fusion by using the traditional method of weighted average after eliminating noise, as shown in Fig. 2(g). The weighted value: w1= w2= w3= w4= w5= 0.2. Obviously, this method can not achieve the effect of inhibition for invalid signals. In addition, we can get the errors between fused signal and standard signal, as shown in Fig. 2(h). Data1 symbolizes the error between fused signal based on correlation function weighted method with standard signal,and data 2 symbolizes the error between fused signals based on weighted average method with standard signal,respectively. Furthermore, it can be seen that the data 1 is only small fluctuation in the ‘0’ position, but the data 2 has large error and is evidently greater than data 1.
Finally, it is added that the data level fusion based on correlation function weighted method is better than the traditional weighted average method with respect to dynamic adaptability, precision, and fault-toleration.

Fig. 2. Vibration signals of simulating sensors
3.2 Experiment analysis
In order to explain the advantages of this method, we take the rotor dynamics and integrated fault simulator as an example. The system can easily diagnose many types of mechanical failures to meet the practical engineering need.Examples of these failures include rotor failures including unbalance, misalignment, bending, resonance, poor tightness, and dynamic instability of gap; bearing failures including bearing wear, bearing pit, and inadequate bearing lubrication; gear box failures including gear wear, gear eccentricity, and gear pitch error is too large. The Dewetron multi-channel data acquisition system is used to collecting signals, which is virtual instrument based on personal computer, and can access various types of sensors.
To get the rotor supporting system loose failure, we deliberately loosen the No. 7 screw bolts. The working speed of rotor was set as 3 000 r/min, the sampling frequency was selected as 500 Hz, and the same type of displacement sensors were fixed at six different locations,including sensors 1, 2, 3, and 4 to collect the x direction of vibration signals, sensors 5, and 6 to collect the y direction of vibration signals. The time-domain and frequencydomain maps of collected vibration signals obtained are shown in Fig. 3 and Fig. 4, respectively.

Fig. 3. Time-domain of rotor supporting system loose failure
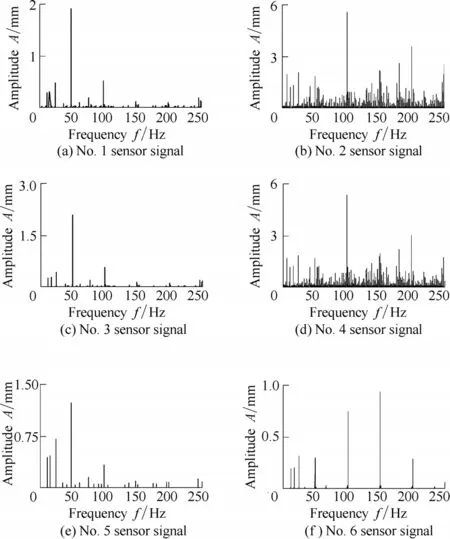
Fig. 4. Frequency-domain of rotor supporting system loose failure
It is to be noted that the collected signals are quite in different positions from Fig. 3 and Fig. 4. Now the question is how can we find the useful information to reflect the signal failure? It is very difficult to judge the right answer from these 6 collected signals in the condition of unknown failure types. Adopting the correlation function based on weighted arithmetic presented in this paper to calculate the weighted value: w1= 0.340 0, w2= 0.010 3, w3= 0.170 6,w4= 0.009 8, w5= 0.420 7, and w6= 0.048 6. We can see that signals 1, 3, and 5 have greater weighted values, thus with respect to the actual situation, the failure source is close to them. Therefore, this method can effectively achieve the dynamic weighted value distribution of vibration signals.
By eliminating the collected signals of Nos. 2, 4, and 6 sensors, and then distributing the weighted value for the three signals, we obtain: w′1= 0.332 2, w′3= 0.243 1, and w′5= 0.424 7. According to the spatial locations of sensors,and taking the phase compensation for these signals,respectively, we can obtain the signal waveform and frequency spectrum after data fusion, as shown in Fig. 5.we can observe that the distribution of frequency spectrum accords with the theoretic conclusion in which the loose-frequency characteristics of rotor supporting system represent in the baseband frequency, fraction harmonic, and multiplier frequency of 2x, 3x, .... Therefore, this method can effectively achieve the level of data fusion, and enhance the precision of data signal.
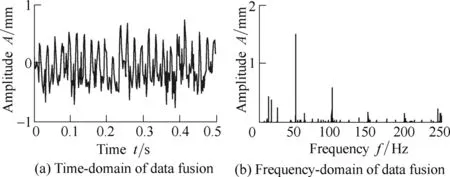
Fig. 5. Result of signals data fusion
4 Conclusions
(1) According to the actual needs of multi-vibration signal processing in the rotary machine fault diagnosis, the data level fusion method based on correlation function analysis is presented that doesn’t require knowing the prior knowledge about measured data.
(2) The method takes full advantage of sensor’s own-information to determine the weighted value based on the correlation measure of real-time data in the fusion process. That is also the greater weighted value is given to the greater correlation measure of sensor signals, and vice versa.
(3) With simulation is taken and the data level fusion based on correlation function weighted method shows a good performance, especially in the terms of the dynamic adaptability, precision and fault-toleration is better than the traditional weighted average method.
(4) The experiment of the rotor dynamics and integrated fault simulator with loose-frequency characteristics of rotor supporting system is implemented. The results verify the feasibility and advantages of the proposed approach which can effectively suppress large errors and make full use of sensor’s resources.
[1] PRABHJOT S, WU Yanyan, ROBERT K, et al. Multimodal industrial inspection and analysis[J]. Journal of Computing and Information Science in Engineering, 2007, 7(1): 102–107.
[2] XU Xusong, CAO Yanlong, YANG Jiangxin. Condition monitor of deep-hole drilling based on multi-sensor information fusion[J].Chinese Journal of Mechanical Engineering, 2006, 19(1): 144–146.
[3] ESTEBAN J, STARR A, WILLETS R, et al. A review of data fusion models and architectures: towards engineering guidelines[J]. Neural Comput & Applic, 2005, 14(4): 273–281.
[4] MORE K, INGMAN D. Quality approach for multi-parametric data fusion [J]. NDT & E International, 2008, 41(3): 155–162.
[5] BOYD J E, LITTLE J J. Complementary data fusion for limited-angle tomography[C]//Proceedings of the IEEE computer society conference on computer vision and pattern recognition, Los Alamitos, 1994: 288–294.
[6] GROS X E. NDT data fusion[M]. New York: Wiley, 1997.
[7] HORN D, MAYO W R. NDE reliability gains from combining eddy-current and ultrasonic testing[J]. NDT & E International, 2000,33(6): 351–362.
[8] RICHARD T A. Principles of effective multisensory data fusion[J].Military Technology, 2003, 27(5): 29–37.
[9] HARRIS C J, BAILEY A, DODD T J. Multi-sensor data fusion in defence and aerospace[J]. Aeronautical Journal, 1998, 102(1 015):229–244.
[10] HOLM-HANSEN B T, GAO R X. Vibration analysis of a sensor-integrated ball bearing[J]. Journal of Vibration and Acoustics,2000, 122(5): 384–392.
[11] CHEN Liyuan, HUANG Jin. Motor fault diagnosis with multisensor data fusion[J]. Proceedings of the CSU-EPSA, 2005, 17(1): 48–51.
[12] LI Xuejun, LI Ping, CHU Fulei. Data fusion of multi-sensor vibration signal using correlation function[J]. Journal of Vibration,Measurement & Diagnosis, 2009, 29(2): 179–183. (in Chinese)
[13] SHAFER G. A mathematical theory of evidence[M]. New Jersey:Princeton University Press, 1976.
[14] ZHU Daqi, CHEN E K. A quantum neural networks fault diagnosis algorithm for rotating machinery[J]. Proceedings of the CSEE, 2006,26(1): 132–136.
[15] SUN Q, CHEN P, ZHANG D, et al. Pattern recognition for automatic machinery fault diagnosis[J]. Journal of Vibration and Acoustics, 2004, 126(2): 307–316.
[16] BYINGTON C S, GARGA A K. Handbook of multi-sensor data Fusion[M]. New York: CRC Press, 2001.
[17] WANG Fengtao, MA Xiaojiang, ZHU Hong, et al. Research on fault diagnosis method based on Dempster-Shafer evidential theory[J].Journal of Dalian University of Technology, 2003, 20(4): 470–474.(in Chinese)
[18] LENG Yonggang, WANG Taiyong, LI Ruixin. Scale transformation stochastic resonance for the monitoring and diagnosis of electromotor faults[J]. Proceedings of the CSEE, 2003, 23(11):111–115.
[19] CHEN Tiehua, CHEN Qijuan. Fuzzy clustering analysis based vibration fault diagnosis of hydroelectric generating unit[J].Proceedings of the CSEE, 2002, 22(3): 43–48.
[20] YANG Dingxin, HU Niaoqing, ZHANG Zhaozhong. Early fault detection of electric machine rotor-bearing system based on complexity measure analysis[J]. Proceedings of the CSEE, 2004,24(11): 126–129.
[21] HOU Xinguo, WU Zhengguo, XIA Li. Stator winding fault diagnosis method of induction motor based on coherence analysis[J].Proceedings of the CSEE, 2005, 25(4): 83–86.
[22] QI Zhanwei, GU Chenglin. Application of fault diagnosis to equipment based on modified D-S evidential theory[J]. Journal of Naval University of Engineering, 2008, 13(1): 60–64.
[23] CAI Xingguo, MA Ping. Study on simultaneous fault diagnosis based on information fusion technique[J]. Proceedings of the CSEE,2003, 23(5): 112–115.
[24] SUN C. Application of multi-sensor fusion technology in diesel engine oil analysis[C]//Proceedings of the 3rd International Conference on Signal Processing ICSP, Piscataway, NJ, USA, 1996:1 695–1 698.
[25] ROY J, et al. Quantitative comparison of sensor fusion architectural approaches in an algorithm-level test bed[J]. Proceedings of SPIE -The International Society for Optical Engineering, 1996, 2 759:373–384.
[26] WANG Ji, HU Xiao. Application of MATLAB in vibration signal processing[M]. Beijing: China water conservancy and hydropower press, 2006. (in Chinese)
[27] DENG Zili, GAO Yuan, LI Chun-bo, et al. Self-tuning decoupled information fusion Wiener state component filters and their convergence[J]. Automatica, 2008, 44(3): 685–695.
[28] LU Wenxiang, DU Runsheng. Engineering testing and signal processing[M]. Wuhan: Huazhong University of Science &technology Press, 2002. (in Chinese)
[29] ZHONG Chongquan, ZHANG Liyong, YANG Suying, et al. A weighted fusion algorithm of multi-sensor based on the principle of least squares[J]. Chinese Journal of Scientific Instrument, 2003,24(4): 427–430. (in Chinese)
[30] LANG Hong, WANG Weichan, MICHAEL L. Multiplatform multisensor fusion with adaptive-rate data communication[J]. IEEE Transactions on Aerospace and Electronic Systems, 1997, 33(1):274–282.
[31] GUO Xincheng, LUO Dacheng, CAO Yong. Application of correlation function in digital signal processing[J]. Electronics Optics & Control, 2006, 13(6): 78–80. (in Chinese)