Diagnosis of Intermittent Connections for DeviceNet
2010-09-19LEIYongandDJURDJANOVICDragan1TheStateKeyLabofFluidPowerTransmissionandControlZhejiangUniversityHangzhou31007ChinaDepartmentofMechanicalEngineeringUniversityofTexasAustin7871USA
LEI Yong * and DJURDJANOVIC Dragan1 The State Key Lab of Fluid Power Transmission and Control, Zhejiang University, Hangzhou 31007, China Department of Mechanical Engineering, University of Texas, Austin 7871, USA
Diagnosis of Intermittent Connections for DeviceNet
LEI Yong1,* and DJURDJANOVIC Dragan2
1 The State Key Lab of Fluid Power Transmission and Control, Zhejiang University, Hangzhou 310027, China 2 Department of Mechanical Engineering, University of Texas, Austin 78712, USA
An intermittent connection is one of the major problems that affect the network reliability and communication quality. However, little attention has been paid to the detection, analysis and localization of the intermittent connections. Partially due to the limitations of the DeviceNet protocol, there is no effective online diagnostic tool available to identify the location of intermittent connection. On the basis of different DeviceNet fault scenarios induced by intermittent connections, a new graph-based diagnostic method is developed to analyze DeviceNet fault patterns, identify the corresponding fault scenarios, and infer the location of the intermittent connection problem by using passively captured network faults. A novel error source analysis tool, which integrates network data-link layer analysis and feature based network physical layer information, is developed to restore the snapshots of the network communication at each intermittent connection induced error. A graph based location identification method is developed to infer the location of the intermittent connections based on the restored error patterns. A 3-node laboratory test-bed, using master-slave polling communication method, is constructed to emulate the intermittent connection induced faults on the network drop cable by using digital switches, whose on/off states are controlled by a computer. During experiments, the network fault diagnosis is conducted by using information collected on trunk cable (backbone). Experimental study shows that the proposed method is effective to restore the snapshots of the network errors and locate the drop cable that experiences the intermittent connection problem.
network fault diagnosis, fieldbus, DeviceNet, intermittent connection
1 Introduction∗
The growing complexity of distributed automation systems has led to the needs for greater processing power and the spread of systems based on computer networks. As a consequence, new types of faults appear, which make the supervision and fault management of such systems a challenge. Hence, the detection and identification of faults and failures are critical tasks in the networked automation systems.
DeviceNet is a widely used fieldbus protocol in industrial automation systems. According to open DeviceNet vendor association, more than 40% of end users choose DeviceNet over other networks[1]. DeviceNet is an application layer protocol based on standard controller area network(CAN)[2]. The intermittent connections are amongst the most frequent and impacting failure modes observed in DeviceNet and other CAN based networks[3]. In this paper, the term “intermittent connections” is referring to an unreliable connection between the field device and the network backbone. Thus, the intermittent connections commonly indicate themselves through the corresponding field devices that have transient difficulties and breaks in communication with the network. In severe cases, system-wide shutdowns could occur because of the loss of nodes caused by intermittent connections. According to DeviceNet (CAN) protocol, each network node is equipped with a transmit error counter(TEC), each communication error the node experienced will increase the number in TEC while this node is in active network service. A node will switch to bus-off state when the number in TEC exceeds a predefined threshold, which will usually cause a system-wide shutdown in a DeviceNet due to safety and product quality concerns. The time to locate an intermittent connection may be considerably long after a system-wide shutdown, especially for vibration or motion induced connection problems. Moreover, the intermittent connections may cause nodes that do not have any connection problems to turn into the bus-off state, which may trigger unnecessary maintenance costs since the engineers tend to replace the bus-off nodes first. Hence, locating the intermittent connected nodes before a system level failure occurs is needed to ensure proper functioning of networked automation systems.
Fault analysis and management research for complex networks can be found in Refs. [4–8]. For example, traditional deterministic approaches, such as model based[4]and qualitative methods[5], are able to recover the possible faults in separate units and subsystems. The methods of fault diagnosis in communication networks have beenaddressed in general purpose network systems, including the network intermittent fault detection method[6], network monitoring method[7], and network alarm management[8]. However, the network information used in these methods is not available on common industrial networks. In addition, the network architectures these methods assumed are different from low level industrial networks. It is still necessary to develop the tools that can be used for performance evaluation and fault detection and diagnosis in industrial networks.
The networked automation systems can be modeled as discrete event systems. The existing fault diagnosis methods, such as the methods based on finite state machine[9–11]and time template method[12], cannot be directly applied to network intermittent connection analysis in DeviceNet. As can be seen in later sections, an intermittent connection event will trigger a set of stochastic communication interactions between network nodes, which cannot be described by a single event. Therefore, a new method needs to be developed to analyze the intermittent connection problems for industrial networks.
The goal of this study is to develop a novel methodology that can analyze the DeviceNet network errors induced by an intermittent connection and identify its location without interrupting the normal operation of the network. In this paper, we firstly define the intermittent connection problem in section 2, then we introduce the proposed methodology in section 3. Experiment design and results are discussed in section 4 and section 5 respectively. Section 6 provides the conclusion and future work.
2 Problem Definition
The design philosophy of the error confinement of CAN protocol[13]is to reduce the disturbances of a problematic node gradually so that the network can be protected from fl ooding of error packets. However, from industrial application point of view, the loss of a network node is often intolerable due to safety and product quality concerns. Moreover, the error packet fl ooding caused by a problematic node may force other nodes to turn to the bus-off state, while the problematic node itself remains active. Therefore, it is important that the location of the intermittent connection can be detected before the network loses its nodes. However, the error handling procedure of CAN protocol requires the nodes to discard the packet received once an error is detected. Hence it is impossible to obtain full information from the digital interface. Therefore, analog waveforms must be used to fully extract the detailed information about the interactions between the nodes when an error occurs.
The error packet defined in DeviceNet protocol has a simple format. Fig. 1 shows one segment of an analog waveform recorded by the data acquisition(DAQ) system.
As illustrated in Fig. 1, the error packet interrupts a packet in the middle, and after the error handling process is
finished, the network resumes normal transmission. Since the error packet contains six consecutive bits, the source of the error packet is not encoded. Moreover, error packets from different nodes can overlap. Therefore, it is difficult to determine which node initiated the error packet when the error occurs. In addition, although lost or repeated packets can be observed, as we will see in later sections, they are not necessarily sent from the node that has the intermittent problem. Therefore, the decision based solely on lost packets is not accurate.
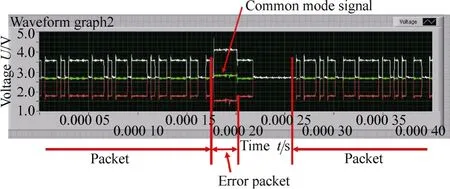
Fig. 1. Analog waveform of error packet recorded by setting error packet as a reference trigger in the DAQ system
Fig. 2 demonstrates two scenarios of the error propagation when the intermittent connection occurs on a drop cable of the network.
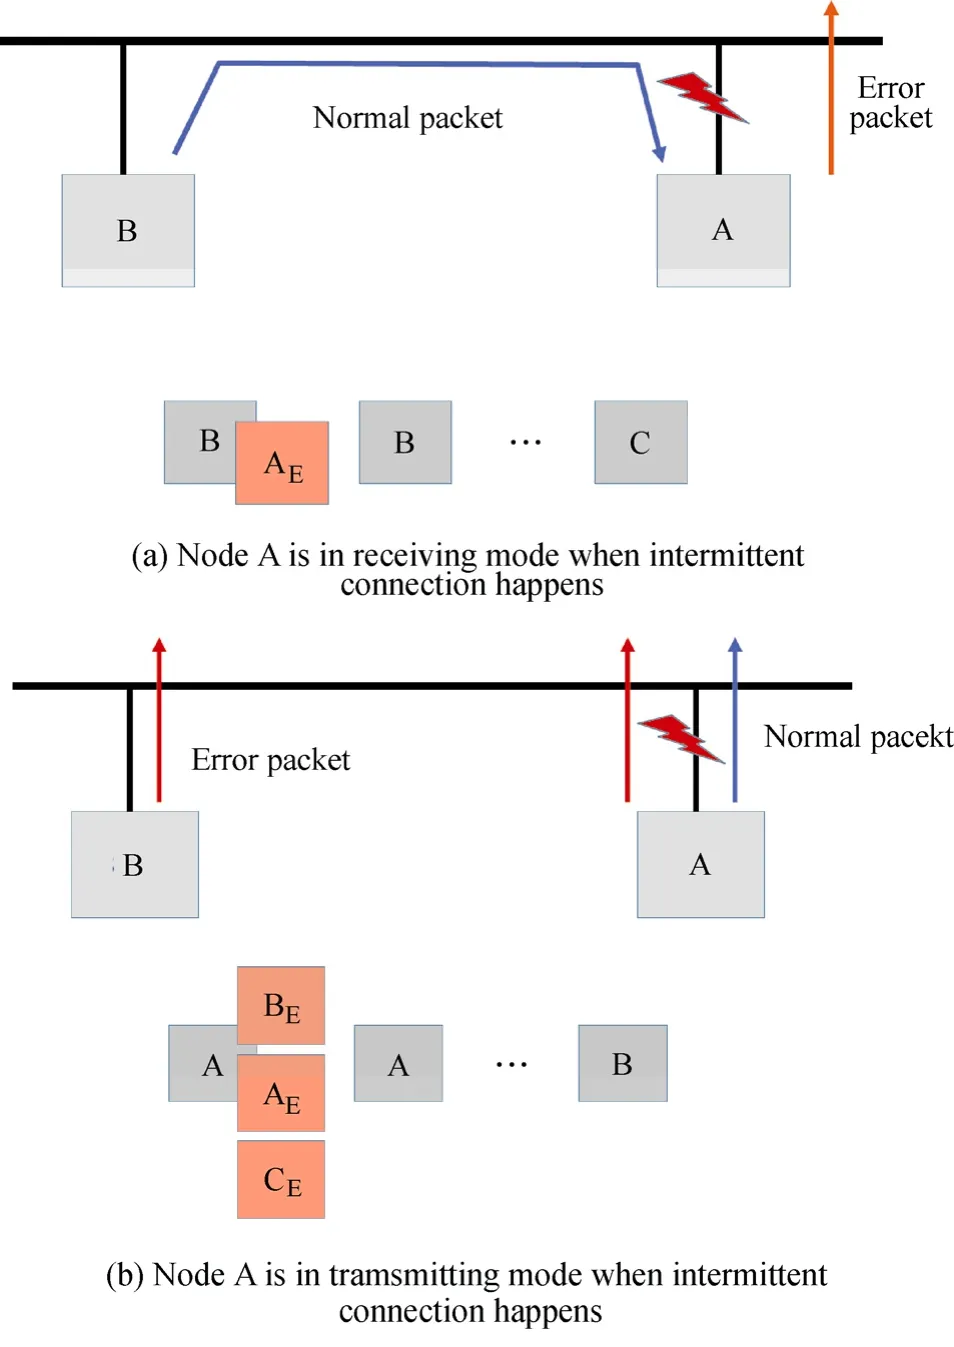
Fig. 2. Scenarios of error packet generation when intermittent connections happen at a drop cable
In Fig. 2, it is assumed that node A has intermittent connection problems. In scenario (a), when node B is sending a packet, only node A will initiate an error packet since at that moment, the intermittent connection affects the receiving result of node A only. In scenario (b), if node A is sending a packet and the communication is interrupted, whichever node captures the error first can initiate the error packet. Usually if it is not node A that initiates the error packet first, all other nodes will send error packets at their earliest possible time. As can be seen, locating the intermittent connection requires analyzing both the patterns of the interrupted and error packets, and inferring the intermittent location from these patterns.
The problem of developing a systematic methodology to analyze the communication errors, establishing the error patterns and locating the intermittent problem automatically without interrupting the normal network communication will be addressed.
This study is based on two assumptions:
(1) The intermittent connection location is on its drop cable. Since in practice, the backbone of the network is very stable, but the drop cables usually are mounted on a vibration or a moving component, which may cause intermittent connection problems.
(2) There is only one master device (e.g., PLC) on the network and the communication setup is polling method, which is the common setup in automotive plant networks.
3 Proposed Methodology
The key components in the detection and localization of intermittent connections are determining the node address of the interrupted packet when an error occurs, as well as identification of the first node that initiates the active error packet. However, as described in the previous section, it is no possible to obtain the source of error packets and interrupted packets using the information from the data link layer only. Our approach is to combine the physical and data link layer information to determine the root cause of the problem. More specifically, we will firstly integrate the information from physical and data link layers to reconstruct the snapshot of the network traffic at each time a network error occurs. On the basis of a series of such snapshots, a graph based tool will be used to infer the location of the intermittent location by analyzing the patterns of the network errors.
Crucial results enabling the aforementioned approach were shown in Ref. [3]. In Ref. [3], a set of features is extracted by using physical layer signals, and it was observed that the packets from each node have their unique transient feature patterns. This result is useful in determining the source of a packet using pattern classification methods applied to the physical layer features. Moreover, if the header data of the interrupted packet is preserved, the address of that packet can be read out directly. Since the error packet does not have the source information encoded, one must apply the classification methods to identify the sources of the error packets. On the other hand, determining of the interrupted packet can be done by reading out directly from the header, if the header of the interrupted packet is preserved (not corrupted by the error packet). If the header is corrupted, transient features from the physical layer must be used in conjunction with the data link layer information.
The data link layer provides timing and sequence information of the packets. By using this information, a stochastic model that describes the normal communication scenario of the network system can be constructed. On the basis of the established model, the interrupted packet can be estimated by calculating the probability of the packet given its time stamp. It is very useful, although rarely, when the header segment of the interrupted packet cannot be used.
Fig. 3 shows the detailed procedures for error packet and interrupted packet analysis. As can be seen from Fig. 3, the error packet source identification and the interrupted packet source identification are conducted separately. Both processes need datasets of analog waveform features based on which classification is accomplished. In addition, a stochastic network model is considered to estimate the source of the interrupted packet in case its address segment is fully destroyed (due to the page limits, we will address this part in a separate paper).
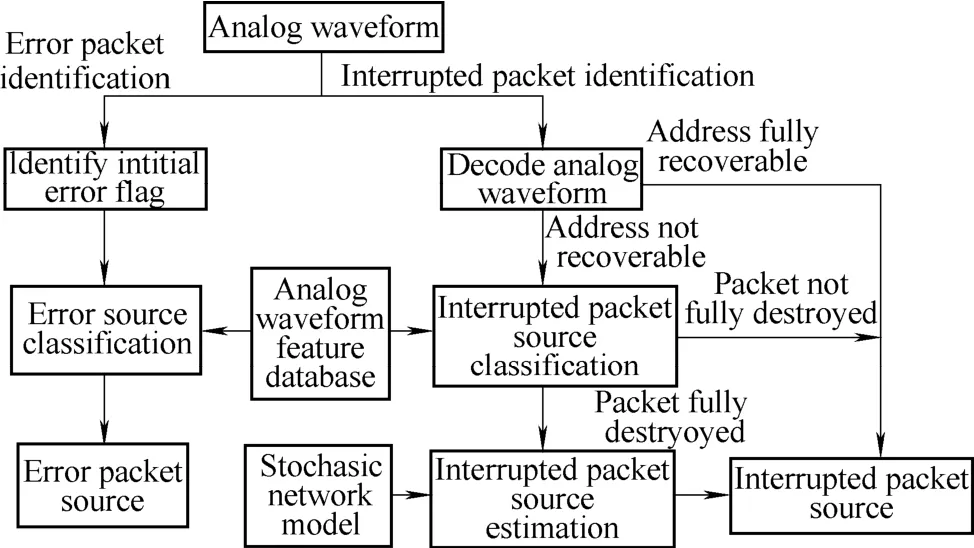
Fig. 3. Detailed procedures for error packet and interrupted packet analysis
3.1 Selection of analog waveform features
For most applications of pattern recognition, the choice of features considerably affects the performance of the classifier. Although each feature represents certain physical or statistical meaning, putting all the features into the classification might not be efficient, and in some cases may result in worse instead of better classification performance. Hence, it is essential to find an appropriate set of features so that the class separability can be preserved with the reduced feature set dimension.
The communication on DeviceNet is realized by transmitting a stream of binary state bits, namely, the dominant state for logic 0 and the recessive state for logic 1[2]. More than 20 features have been extracted from the physical layer. The features can be grouped into three categories.
(1) Dominant state features. Bit static features represent the static voltage profiles inside each individual bit. Features included are signal-to-noise ratios(SNR), common mode voltage features (mean voltage, standard deviation of the common mode voltage), DC voltage of dominant state (the static voltage difference of the differential signals) and Root mean square value of the noise (Signal-RMS-Noise2).
(2) Recessive state features. Features are extracted by using similar definitions as dominant state features.
(3) Dominant/recessive state transition features. Bit transient features represent the voltage profiles between different logic states. Features included are voltage overshoot and voltage rise/fall time features.
Since the error packets consist of only dominant state bits, the dominant state features are used in this study to construct a linear classifier for the error and the interrupted packets source identification.
3.2 Error packet and the interrupted packet source identification
As shown in Fig. 3, the interrupted packet and the error packet source identifications are conducted separately.
(1) Interrupted packet source identification
In DeviceNet, each communication packet has a header segment that contains the source address at the beginning. An address identification procedure is developed to recover the address, as shown in Fig. 4. If the address segment remains intact, the address can be read directly from analog waveform. Otherwise, a pattern classification method is conducted based on the selected dominant state features.
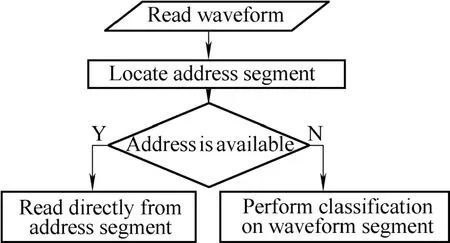
Fig. 4. Flowchart of interrupted packet source identification
(2) Error packet source detection
The error packet source detection is not as straightforward as the interrupted packet source detection since the error packets and the interrupted packet can overlap. Two overlapping scenarios are described as follows.
(1) Scenario I: Only the error packets are overlapped. The error packets from different nodes can overlap according to CAN specification. Fig. 5 shows an example of such scenario. In this figure, error packet from node A is overlapped by an error packet from node Y, beginning at the second bit of the node A’s packet (note that the voltage jump begins at the second bit).
If the total length of an error flag is 6 bits, according to CAN specification, all the nodes in the network will notice the error and send out the error flags at the same time.
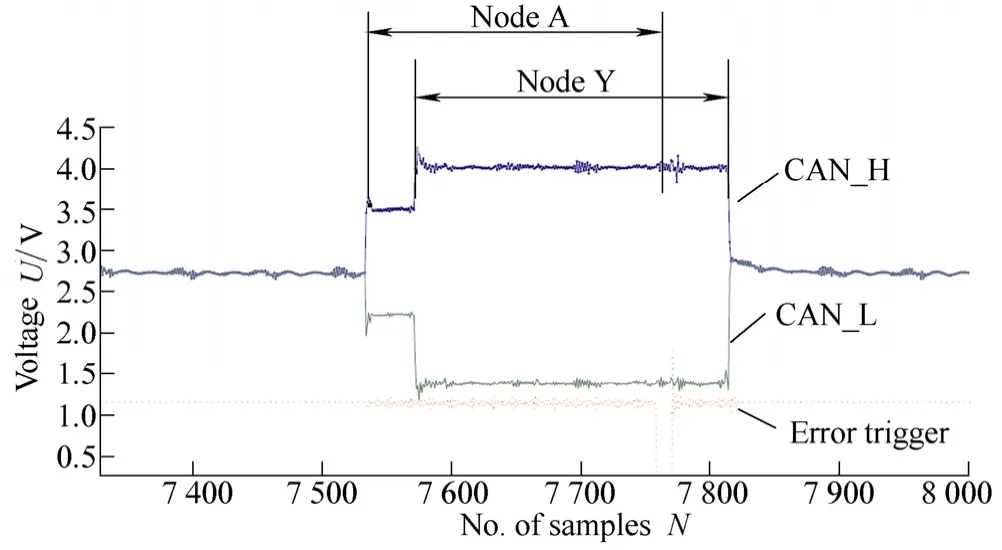
Fig. 5. Active error packet in CAN
(2) Scenario II: The error packets can overlap with the dominant bits of interrupted packet. As shown in Fig. 6, at the beginning, node 10 is transmitting a packet, and an error packet begins at time t1. The error packet from node 3 is overlapped at time t2with the error packets from all the nodes (identified as node 10 since it provides maximum voltage difference). In this case, the source of the first error packet needs to be determined.
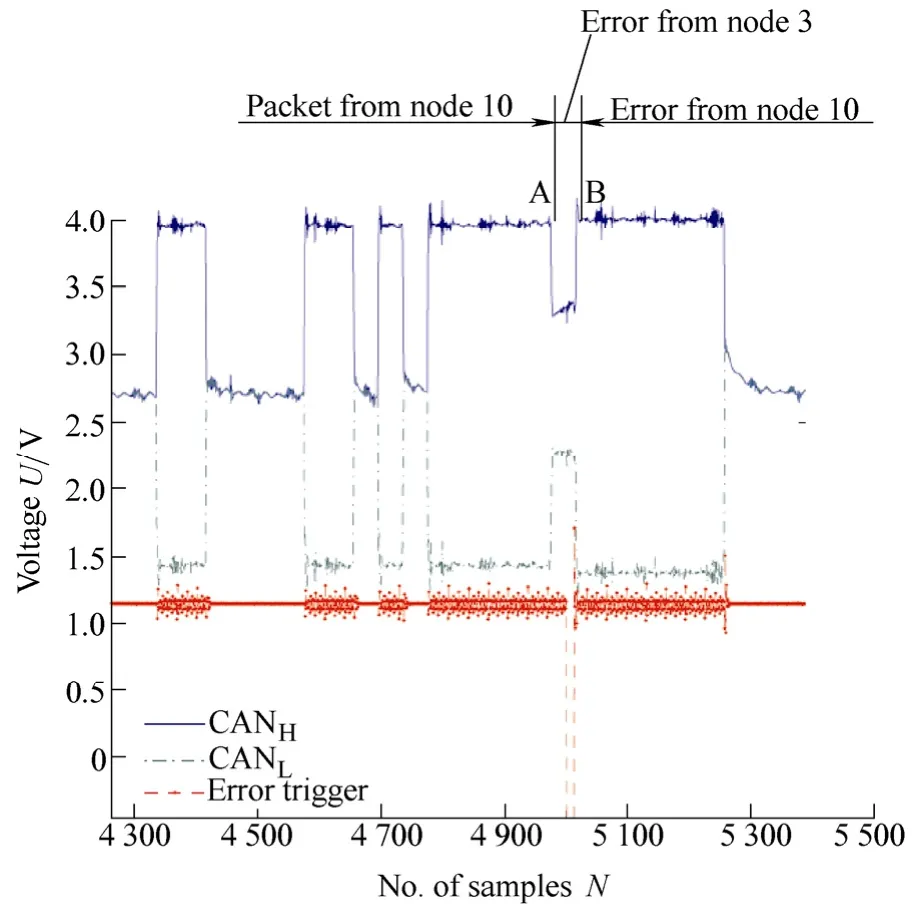
Fig. 6. Overlapping of the error and the interrupted packets on a 3-node testbed (PLC, node 3 and 10)
Fig. 7 shows the flowchart of the procedure for identifying the node that initiates the error packet. An error packet consists of two segments divided by the error trigger. In step 1, we use a linear classifier to identify the source of each bit in the first segment, which is 6-bit long in total. In step 2, we identify the duration of the second segment. In step 3, we determine the location of the first bit of the error packet. On the basis of the length of the second segment in step 2, if it is more than 6 bits and the bits in the first segment are not sent from the same source, then it means the error packet begins from the bit that is different from the first bit in the segment. In other words, the bits before the beginning bit are sent from the interrupted packet. Otherwise, we can take the first bit as the beginning of the error packet.
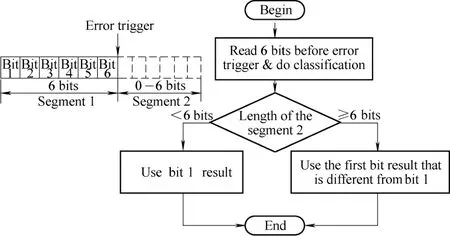
Fig. 7. Procedure for identifying the node that initiates the error packet
3.3 Location inference of the intermittent connection
After determination of the sources of the interrupted and the error packets, a complete communication data log can be reconstructed by synchronizing packet analysis results with the digital packet log.
According to CAN specification, two types of error scenarios may happen.
(1) Error scenario 1. A packet is interrupted by an error packet that is longer than 6 bits. In this study, the error packet is initiated by one node, and other nodes follow the error packet of the first node.
(2) Error scenario 2. A packet is interrupted by a 6-bit long error packet. In this scenario, the observed error packet is the superposition of the error packets sent by all the nodes.
Two error matrices are introduced to represent the relation of the interrupted packets and the error packets under these two error scenarios respectively.
(1) Error matrix E1. Each element E1(i, j) of error matrix E1∈RN×Nis defined as

where N(•) denotes the cardinal number of a set, and Xi1
j denotes the set of events in which the source of the error packet, whose length is longer than 6 bits, was node i, and source of the interrupted packet was node j.
(2) Error matrix E2. Each element E2(i, j) of error matrix E2∈RN×Nis defined as

where N(•) denotes the cardinal number of a set, anddenotes the set of events in which the source of the interrupted packet was node i, and sources of the 6-bit long error packet was node j .
The causal relationships of the interrupted and error packets can be visualized by using two graphs which use the error matrices as their adjacency matrices. Let graphs G1and G2denote the graphs using E1and E2as adjacency matrices, respectively. The vertices in each graph represent the network nodes. In this setting, the out-degree of a vertex in the graph G1represents the number of errors sent by this node. Similarly, the out-degree of a vertex in the graph G2denotes the number of packets originating from this node that is interrupted simultaneously by other nodes.
The error matrices E1and E2are 0∈RN×Nin a perfect environment. However, in the present of intermittent connection problems, they are non-zero matrices.
In graph theory, the degree d of a vertex in a digraph G is defined as the sum of out-degree d+and in-degree d−of this vertex[15]. In this paper, we define a severity measure (Si) of the node i as
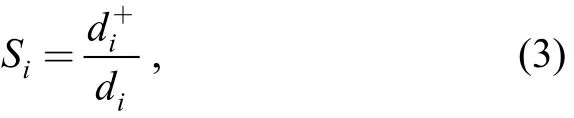
which represents the intermittent connection severity of the node i. It is bounded between 0 and 1. The more interruptions the node has, the higher the ratio is. In the extreme case, if a node always interrupts network communication, the ratio is 1, while a node’s packets are always interrupted by others, the ratio is 0.
In the network in which intermittent connections happen on a drop cable to a node, two error patterns may appear:
(1) The problematic node will frequently interrupt the normal communication packets when it is supposed to listen to the network traffic only. This pattern can be seen from the severity measure (Si) of the network nodes using error matrix E1.
(2) The packets from a node are frequently interrupted by 6-bit long error packets, which indicate that errors in the packets from this node are noticed at the same time by all other nodes. This pattern can be observed from severity measures of the network nodes in E2.
Therefore, if these two patterns of the error and the interrupted packet sources can be established, the location of the IC problem can be inferred.
4 Testbed Setup
The schematic of the laboratory testbed is given in Fig. 8. The DeviceNet scanner is set to communicate by using polling method with a 10 ms polling interval. The intermittent connection problems are induced by a digital on-off switch controlled by a computer. The intermittent inter-event time follows a uniform distribution and the duration of the disconnection is set to one bit width.
We developed an integrated data acquisition system to record the analog and digital packet information of the network simultaneously. The analog waveforms are acquired at 108samples per second sampling rate and the acquisition is triggered by an online error packet detector when an error is captured. The time stamped digital packet sequence is logged by using a DeviceNet interface card[16].
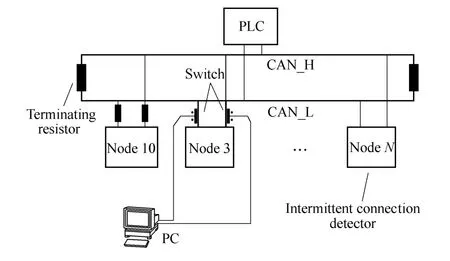
Fig. 8. Illustration for experiment design of intermittent connection emulation
5 Experimental Results
5.1 Error packet and the interrupted packet identification
Fig. 9 shows one data segment obtained using the DAQ system described previously. Differential analog waveforms (CAN_H and CAN_L) of the DeviceNet and error trigger signals are recorded. The falling edges of the error trigger signal mark the positions of the error packets.
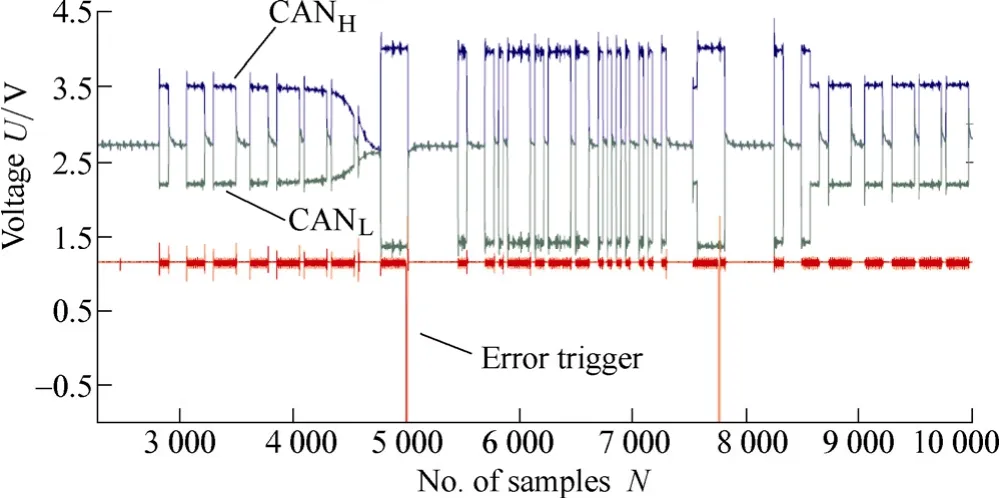
Fig. 9. Example of error packets and the interruptedpackets source identification using analog waveforms acquired upon each network error
Table 1 shows how the results of identification of the source of the error packets and the interrupted packets look like versus the information obtained from the standard DeviceNet digital interface. The first row of Table 1 represents the data log obtained using DeviceNet/CAN logging systems. The second row shows the identification result using methods developed in this study. P_3 denotes a packet sent by node 3, E_9 denotes the first error packet is sent by node 9. It can be seen from the table that our method can fully recover the sequence of the events, while the digital log obtained in testing can only indicate the presence of some errors.
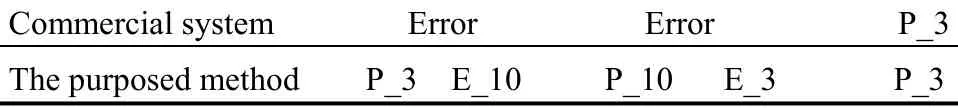
Table 1. Source identification result of data segment in Fig. 9
5.2 Intermittent connection inference
We observed 43 errors during one test and Fig. 10 shows the error relationship graphs constructed using the methods described in section 3.3. Table 2 shows the severity measures (Si) of the network nodes in the relationship graphs. As can be seen, the severity measure of node 3 in graph G1is 0.96, and in G2is 1. The severity measures of other nodes are 0. The 17 interruptions from node 10 in G2in Fig. 10 are all 6-bit long error fl ags. Note that node 10 has the highest differential voltage while it is in transmission mode. Therefore, the established error patterns indicate that node 3 has the intermittent connection problems.
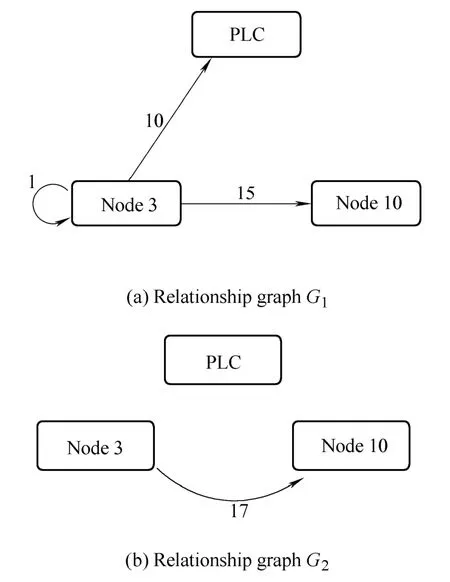
Fig. 10. Relationship graphs of the interrupted packets and error packets
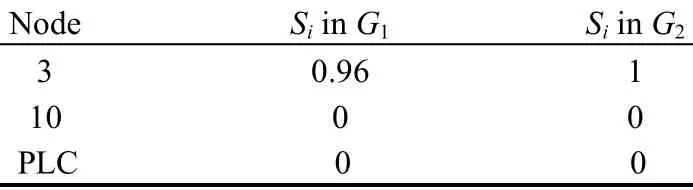
Table 2. Severity measures of the network nodes in the relationship graphs
6 Conclusions
(1) A novel diagnosis framework is proposed for discovering the location of an intermittent connection on a DeviceNet network. This framework is based on passive observations of network signals using analog and digital interfaces.
(2) A hybrid analog-digital domain analysis method is developed to identify the node addresses of the interrupted and error packets so that the causal relationship can be drawn by using collected data. The origin of each error packets is determined by feature classification with the help of error trigger hardware. The source address of each interrupted packets is obtained through hybrid analysis of physical and data link layer data.
(3) A graph based method is developed to infer the location of the intermittent connection by using the analysis results of the interrupted and the error packets. A severity measure is proposed to locating the intermittent connection.
(4) A test-bed is constructed to emulate the intermittent connection problem, and experiments are conducted to illustrate the effectiveness of the proposed method. The analysis results show that the proposed methods can correctly identify the intermittent collection on the drop cable of the network.
[1] ODVA. Open devicenet vendor association[EB/OL]. [2010-08-10]. http: //www.odva.org/default.aspx?tabid=66.
[2] Open DeviceNet Venders Association. DeviceNet specifications, 2.0 edition[S]. Ann Arbor, Michigan, USA, 1997.
[3] LEI Yong, DJURDJANOVIC D, BARAJAS L, et al. DeviceNet network health monitoring using physical layer parameters[J/OL]. Journal of Intelligent Manufacturing[2009-08-09]. http: //www. springerlink.com/content/75r656m00484q75h/.
[4] FRANK P M, DING X. Survey of robust residual generation and evaluation methods in observer-based fault detection systems[J]. Journal of Process Control, 1997, 7(6): 403–424.
[5] LIN Along. Hybrid approach to fault diagnosis in network and system management[R]. Palo Alto: Technical report, Hwelett Packard Lab Technical Publ. Dept., 1998.
[6] SANFORD M, PARISH D, PHILLIPS I. Neural approach to detecting communication network events[J]. IEE Proceedings: Communications, 2002, 149(5–6): 257–264.
[7] KABITZSCH K, KOTTE G, VASYUTYNSKYY V. A monitor tool for cim systems[C]//Proceedings of 2001 IFAC Workshop on Manufacturing, Modeling, Management and Control, Praque, Czech Republic, 2001: 81–85.
[8] CHAO Chi-Sih, LIU An-Chi. An alarm management framework for automated network fault identification[J]. Computer Communications, 2004, 27(13): 1 341–1 353.
[9] SAMPATH M, SENGUPTA R, LAFORTUNE S, et al. Failure diagnosis using discrete-event models[J]. IEEE Transactions on Control Systems Technology, 1996, 4(2): 105–124.
[10] ATHANASOPOULOU E, LI Lingxi, HADJICOSTIS C. Prababilistic failure diagnosis in finite state machines under unreliabile observations[C]//Proceedings of the 8th International Workshop on Discrete Event Systems, Ann Arbor, 2006: 301–306.
[11] CONTANT O, LAFORTUNE S, TENEKETZIS D. Diagnosis of intermittent faults[J]. Discrete Event Dynamic Systems: Theory and Applications, 2004, 14(2): 171–202.
[12] HOLLOWAY L, CHAND S. Time templates for discrete event fault monitoring in manufacturing systems[C]//Proceedings of the 1994 American Control Conference, Baltimore, 1994: 701–706.
[13] ISO. ISO11898-1 Road Vehicles—Controller Area Network (CAN) Part 1[S]. Data Link Layer and Physical Signaling, Switzerland, 2003.
[14] CASSANDRAS C, LAFORTUNE S. Introduction to discrete event systems[M]. Massachusetts: Kluwer Academic Publishers, 1999.
[15] WILSON R. Introduction to graph theory[M]. New York: John Wiley & Sons, Inc., 1986.
[16] PEAK-Systems Technik GmbH. PCAN trace[EB/OL]. [2010-08-10]. http: //www.peak-systems.com.
Biographical notes
LEI Yong, born in 1976, is an assistant professor in Zhejiang University, China. He received his BS degree in control science and engineering from Huazhong University of Science and Technology, China, his MS degree in machine building and automation from Tsinghua University, China, and his PhD degree in mechanical engineering from University of Michigan, Ann Arbor, USA. His research interests include intelligent maintenance systems, monitoring and fault diagnosis of networked automation systems, and statistical quality control.
E-mail: ylei@zju.edu.cn
DJURDJANOVIC Dragan, born in 1973, is an assistant professor in Department of Mechanical Engineering, University of Taxes, USA. He obtained his BS degree in mechanical engineering and
applied mathematics from the University of Nis, Serbia in 1997, his M. Eng. in mechanical engineering from the Nanyang Technological University, Singapore, in 1999, and his MS degree in electrical engineering (systems) and PhD degree in mechanical engineering from the University of Michigan, Ann Arbor, USA, in 2002. He is the recipient of several prizes and awards, including the 2006 Outstanding Young Manufacturing Engineer Award from the Society of Manufacturing Engineers (SME), and The Outstanding Paper Award at 2001 SME North American Manufacturing Research Conference. His research interests include advanced quality control in multistage manufacturing systems, intelligent proactive maintenance techniques and applications of advanced signal processing in biomedical engineering.
E-mail: dragand@me.utexas.edu
April 7, 2010; revised August 24, 2010; accepted September 2, 2010; published electronically September 6, 2010
10.3901/CJME.2010.05.606, available online at www.cjmenet.com; www.cjmenet.com.cn
* Corresponding author. E-mail: ylei@zju.edu.cn