Application Research of Batch Dynamic Principal Component Analysis in Chemical Process
2010-01-24LIYuanWENXuejie
LI Yuan, WEN Xue-jie
(Shenyang University of Chemical Technology,Shenyang110142,China)
In order to increase capabilities of meeting the need of constantly changing market situations,the batch and semi-batch processes play an important role in most industries.This especially rings true in the processes mainly involved in the production and processing of high-quality and value-added specialty chemicals.Batch processes are characterized by the precise sequencing and automation of allstages in the sequence[1].At present,the statistics methods for batch process monitoring are mostly based on multi-way principal component analysis(MPCA).However,for the batch monitoring,the computational and storage requirements would be very large when the traditional MPCA is applied.In this paper,batch dynamic principal component analysis is proposed to explain the batch process dynamics.The issues of changes in process operation,early warning of process malfunctions can be solved successfully.Then multivariate statistics such asHotelling’s T2and the squared prediction error(SPE)are to be calculated along with their appropriate control limits.
1 The traditional multi-way principal component analysis
MPCA isused foranalysisof batch process data.The experimental data can be constructed in the form of the three-dimensional array,as shown in Fig.1.
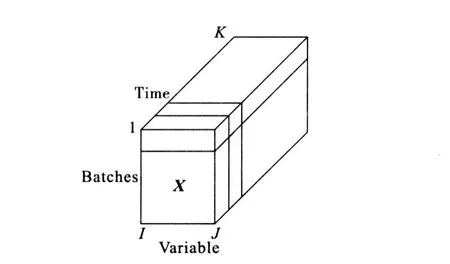
Fig.1 Three-dimensional matrix X
A three-dimensional matrix X(I×J×K), where I,J and K are the number of batches,variables and time instants.This multi-way method organizes the batch data into time-ordered blocks, each of which represents one batch run.MPCA unfolds the three-dimensional array into a large twodimensional matrix.Each vertical slice I×J is put side by side to the right,starting with the slice corresponding to the first time interval.The resulting two-dimensional matrix has dimensions I×J K[2]:
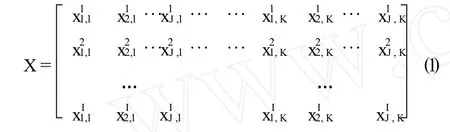
Where the observation ofvariable j at the time pointk in batch run i is represented as.Then,MPCA decomposes array X into the summation of the product of score vectors T and loading matrices P:

Where r is the number of principal components,E is an error matrix,Tkexpresses the relationship among batches and Pkis related to variables and their time variation.The error matrix E is arising from measure noise,ignoring the E will have the effect of eliminate the measure noise and not bring the losing of the useful information in the data.Note that the observations at any time are statistically independent to the observations at other time.This means that MPCA-based monitoring method is only concerned with static rather than dynamic relationships.
Operation data is analyzed by the model, Q-statistic(SPE)and Hotelling T2-statistic are usually used to monitor the process.
The Q-statistic is defined as:

The Hotelling T2is defined as:

S is a diagonal matrix,which is the covariance matrix of the principal component scores and T is the scores retained by PCA[3].
The Q-statistic orT2-statistic is a representative of the change that not explains by the model.If the Q-statistic shows an unexpectedly large value,it means that the process have the abnormal variables.
2 Batch dynamic principal component analysis
In dynamic process,the time dependency is found in the variable histories.To build a dynamic batch process model,not only is one concerned with the correlation among the batches,but also with the auto-correlation of the process variables during one batch run.The BDPCA method hasconsiderthisquestion fully.
In BDPCA,each batch is isolated from the others.It shows stacking the batch data window together for each batch(Fig.2(a)). A matrix XⅣ(J×K)is formed for each Ⅳbatch[4].Then each of the J variables is lagged d times resulting in a lagged XⅣ[(K-d)×(J× (d+1))]matrix(Fig.2(b)).
When the samples ofI batch runs are available,the average covariance of all batch can be estimated by pooling each batch’s covariance information SⅣ(Fig.2(c)).The elements in each of the SⅣmatrices are a measure of the dynamic relationship between variables in Batch Ⅳ.Having calculated these dynamic correlations for allI batches an average covariance matrix,Savg,is then calculated based on the I SⅣcovariance matrices(Fig.2(d)):

The average covariance matrix,Savg,expresses the average dynamic relationships between the process measurements.A PCA model is then developed based on Savg(Fig.2(e)).The resulting BDPCA model is finally used to calculate the T2and SPE statistics for monitoring purposes.

Fig.2 Batch dynamic principal component analysis
In previous literature,d mostly takes1or 2.Now,a method is given to calculate d.The calculation steps are as follows:
Step1Set d=0.
Step2The previous d observations are increased in the currentk observation vector, then an augmented matrix is obtained.
Step3The matrix is decomposed by PCA to get all scores vector.
Step4Set n=J×(d+1)and r(d)=0.
Setp5Set the singular value threshold(the threshold limit is set close to0)which is get from decomposing the covariance matrix by singular value decomposition.
Step6If the singular value n(arranged in order decrease)is less than or equal to the threshold limit set,it means that singular vectors have described linear relationship between original measure variables,then continue to execute the following steps,else jump to step8.
Step7Set n=n-1and r(d)=r(d)+1, return to step6.
Step8Calculate the new related coefficient. rnew(d) = r(d)-

Step9Ifrnew≤0,then calculating process end,otherwise,continue to the next step.
Step10Set d=d+1,return to step2.
Where n is the number of variable in the matrix,r(d)is related coefficient and rnewis new related coefficient.Through selecting the value of d suitably,the accuracy of BDPCA model will be improved greatly.
A dynamic BDPCA approach can be summarized as follow:
(1)Collect the historical batch data sets at the normal operations.
(2)Select the number of time lags(d)of all batches in order to extract the dynamic relations among batch data.
(3)Develop BDPCA models.By the use of PCA,the average loading vectors among all batches are produced from the average covariance matrix.
(4)Compute the score for all batches at each time point to set up the control limits Q and T2for each time point k individually.
3 Application of the BDPCA
In this section,take an example in order to demonstrate the effectiveness of the BDPCA.The data is industrial data from TE process.
In BDPCA,the average time lagged window of all batches is3.The data set is arranged in a time lagged data matrix form and the average covariance matrix of all batches is computed.The simulation results showed in the Fig.3.The control charts of the MPCA model are shown in Fig.4.If the batch has no abnormal behavior at any time during the batch.This batch is assigned as being“in control”or“normal”.The final product quality described by the BDPCA empirical model should be satisfied under the product specification.

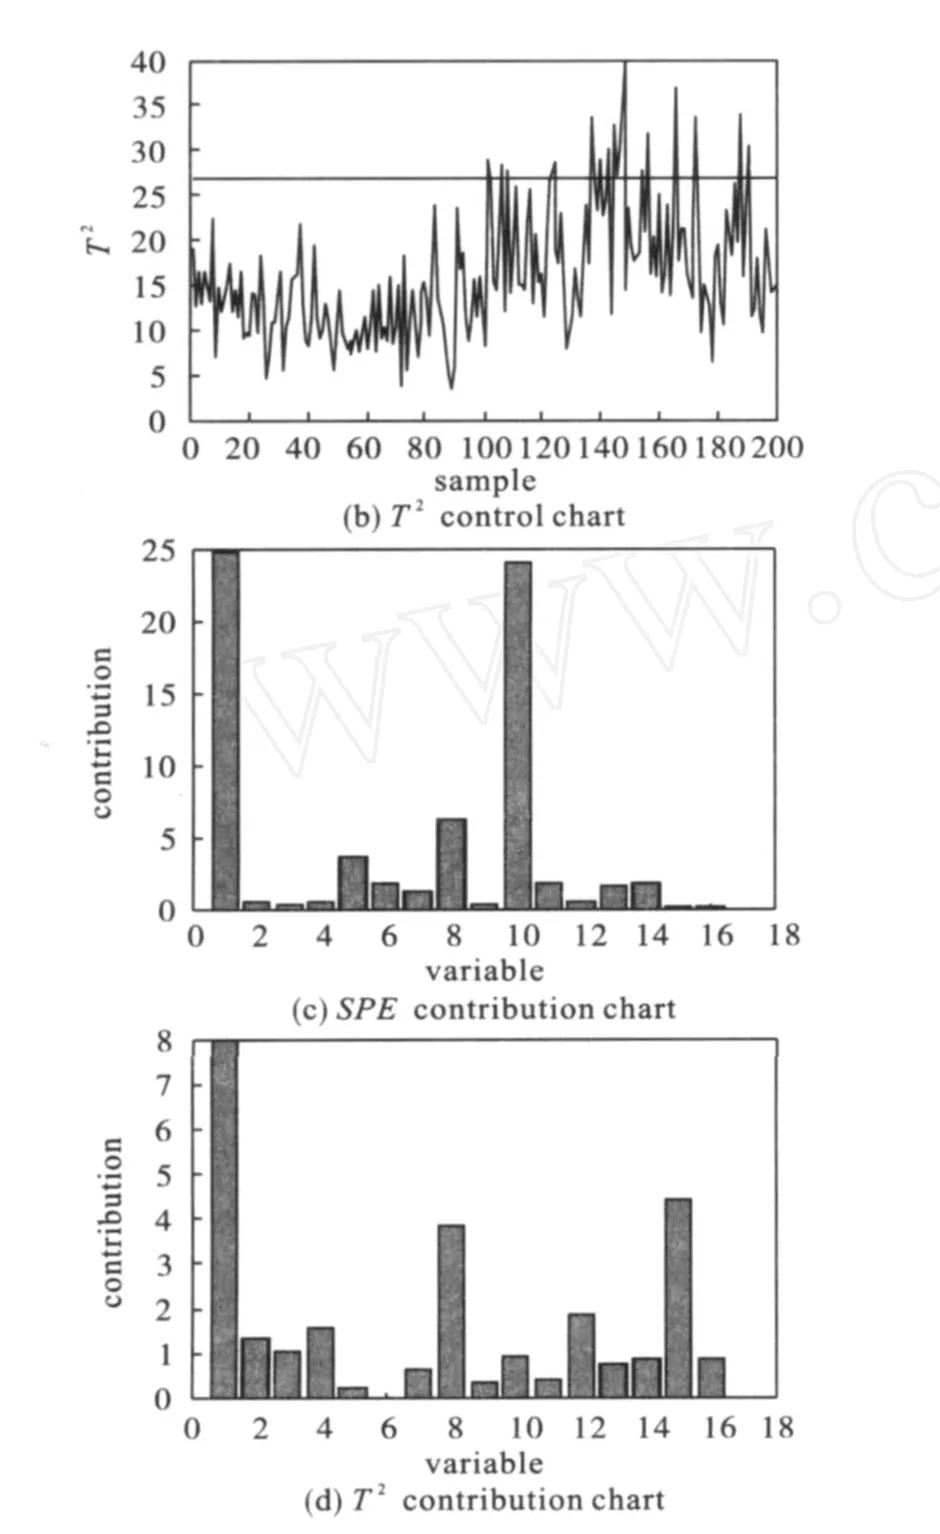
Fig.3 Control charts for monitoring using BDPCAfor Batch1
In Fig.3and Fig.4,one batch is particularized to explain the monitoring result.Some variation causes the batch operating behavior in the model projection plane to exceed the control limits,which is95%.According to Fig.3(a)and Fig.3(b),the SPE control charts and the T2control charts show that the abnormal point appears at the sampling100in batch1.Once operator finds a fault,the contribution chart can be generated to help find which variables have the largest deviation from normal operation conditions.From the Fig.3(c)and Fig.3(d),it can be seen that process variables1,10and16have large contributions to the deviation.Fig.4shows the monitoring situation of the MPCA method.Fig.4(a) and Fig.4(b),the same faults in batch1are captured at the sampling120.Compared the figures, it’s clear that the BDPCA approach can capture the faults earlier than the MPCA approach.For the actual production process,detecting process faults quickly is very important,since it can give the operator enough time to adjust the production process,which will succeed to minimize the potential harm.

Fig.4 Control charts for monitoring using MPCA for Batch1
Fig.5shows another case,the batch has abnormal behavior and then through adjustment the process has returned to normal working condition.Comparing with Fig.6,the BDPCA algorithm can not only detect abnormal behavior,but also reflect the operators’efforts for elimination ofabnormal operating conditions.The MPCA detects the faults late and when the process returns to normal it still appears abnormal point at the sampling32.It shows that the algorithm don’treflect the changes in the process rapidly.
As a result,it is obvious that BDPCA can describe the process fault behavior much earlier,and has better accuracy and real-time characteristic.


Fig.6 Control charts for monitoring using MPCA for Batch2
4 Conclusion
In this paper,the batch dynamic principal component analysis is used for dynamic batch process,the process itself is challenging since it is carried out in multiple phases and there exists strong nonlinear and dynamic effects between the variables.The BDPCA approach is attractive in thatthe quality variables are closely correlated with and are reflected by the process measurements.The advantage of the method is that,it does not need to predict or fulfill the future unmeasured data.It is based on current and previous measured data only.
An algorithm of the time-lagged variable is proposed.Using the time-lagged variable, the BDPCA incorporates both the series-correlation in one batch and the cross-correlation within the batches.Simulation results show thatcompared with the traditionalMPCA method,BDPCA method detects process faults quickly and accurately and the method also performs well when small process variances are propagated.However,several future works are still needed,such as BDPCA must analyze a much larger covariance matrix and batch processes with the nonlinear behavior,process dynamics and disturbances shifted from time to time,and changing operation points.
[1] Di LiQing,Zhang Jie,Yang Xiahui.MWMPCA with Application to Batch Processes Monitoring [J].J ournal of Jilin University(Information Science Edition),2004,22(4):397-400.
[2] Simoglou A,Georgieva P,Martin E B,et al.Online Monitoring of a Sugar Crystallization Process [J].Computers and Chemical Engineering,2005, 29(6):1411-1422.
[3] Simoglou A,Martin E B,Morris A J.Statistical Performance Monitoring of Dynamic Multivariate Processes Using State Space Modeling[J]. Computers and Chemical Engineering,2002,26 (6):70-79.
[4] Louwerse D J,Smilde A K.Multivariate Statistical Process ControlofBatch Processes Based on Three-way Models[J].Chemical Engineering Science,2000,55(7):55-69.
[5] Lee J ong-Min,Yoo Chang Kyoo,Lee In-Beblm. Enhanced Process Monitoring of Fed-batch Penicillin Cultivation Using Time-varying and Multivariate Statistical Analysis[J].Journal of Biotechnology,2004,110(2):119-136.