Trade Credit, Future Earnings, and Stock Returns: A Self-Dealing Perspective*
2009-07-05JigaoZhuandGuohuaJiangGuanghuaSchoolofManagementPekingUniversityChina
Jigao Zhu** and Guohua JiangGuanghua School of Management, Peking University, China
Trade Credit, Future Earnings, and Stock Returns: A Self-Dealing Perspective*
Jigao Zhua,** and Guohua JiangaaGuanghua School of Management, Peking University, China
Chinese listed firms are characterized by a great magnitude of long-duration accounts receivable from controlling shareholders and their af filiates, and they often do not make bad debt allowances. On many occasions, these receivables are never collected. We find that firms with a great magnitude of accounts receivable demonstrate a low level of future profitability and low stock returns. It does not appear that the low earnings persistence of these firms is responsible for their poor future performance as predicted by the accrual anomaly, because the firms also report low concurrent earnings. In the context of the Chinese stock market, we interpret the results as being consistent with self-dealing through trade credit by controlling shareholders. This study contributes to the self-dealing literature by identifying a more subtle channel of expropriation of minority shareholders in China.
JEL classification: G11; M48; G30
Trade credit; Self-dealing; Minority shareholder interest; China
1. Introduction
The agency problem between controlling shareholders and dispersed minority shareholders in modern corporations has drawn considerable research attention in the economics, finance, and accounting fields in recent years. Controlling shareholders, who have control power and insider information, can divert resources away from companies under their control for their own benefit to the detriment of minority shareholder interests. This phenomenon is called tunneling or self-dealing (Johnson et al., 2000b; Djankov et al., 2008).
An important channel of self-dealing is through intercorporate loans. For example, La Porta et al. (2003) find that in Mexico, banks make loans to firms controlled by the bank owners on preferential terms. Research into the Asian financial crisis of 1997 reveals similar loan practices (Johnson et al., 2000a). Self-dealing can also involve personal loans, as in the case of Adelphia Communications and the Rigas family, in which members of the controlling family took out loans from the company to pay for personal expenses.
In the Chinese market, Jiang et al. (2009) document vast amount of loans from listed firms to their controlling shareholders, which are reported as ‘Other Receivables’ in the financial reports of these firms.
However, self-dealing through corporate loans can take more subtle forms. We study one such form in this paper - plain vanilla accounts receivable. Accounts receivable in Chinese listed firms have two features that are rarely seen in other markets. First, the magnitude of accounts receivable due from controlling shareholders is great, partly because many Chinese listed firms are carve-outs from parent companies in their initial public offerings. Consequently, the outputs of listed firms tend to supply a downstream division of their parent companies, which creates a large dollar amount of accounts receivable due from the parent companies. Second, these accounts receivable can remain on the balance sheets of listed firms for a long time, even up to five years. These two features combine to seriously damage firm value.
In this paper, we document the magnitude of accounts receivable in Chinese listed firms, and then examine its impact on the future earnings and stock returns of these firms. From 2000 to 2004, Chinese listed firms reported accounts receivable that constituted on average 12% of total assets, of which 26.9% were more than 12 months old. However, Chinese listed firms rarely make an allowance for bad debts against receivables (including accounts receivable) due from controlling shareholders and their af filiated companies. We find that firms with a great magnitude of accounts receivable (high accounts receivable firms) underperform compared to those with a small magnitude of accounts receivable (low accounts receivable firms) in terms of current profitability and profitability in three years. Investors initially appear to underreact to the information about accounts receivable, and mispricing is corrected only in the following year when more earnings information is disclosed. These results hold for both univariate and multivariate analysis where other firm characteristics are controlled.
The accrual anomaly does not explain the negative relationship between a great magnitude of current accounts receivable (an important part of a high level of accruals) and low future earnings and stock returns. We find that current earnings are actually lower among high receivable firms than among low receivable ones, contrary to the prediction of the accrual anomaly. However, our results are consistent with the expropriation of listed firms and minority shareholders through trade credit and‘occupation’ of the funds of listed firms for a long time by controlling shareholders.
This paper adds to the growing literature on self-dealing, especially in China. Earlier studies focus on more transparent forms of self-dealing including the direct diversion of cash (Jiang et al., 2009) and related party transactions (Cheung et al., 2006; Jian and Wong, 2006),1Accounts receivable are included in some of these early studies (Jian and Wong, 2006), but represent only a small portion of related party transactions. Furthermore, other related party transactions may not be loans.which are explicitly prohibited and tightly regulated, respectively, in China. For example, listed firms’ making outright loans to controlling shareholders, reported as ‘Other Receivables,’ was largely eliminated in China after 2006 following a government crackdown on this practice. However, the incentive to engage in self-dealing remains. It is very likely that controlling shareholders now rely on other forms of selfdealing, such as extracting trade credit from listed firms. Thus, our study draws to the attention of investors and regulators this more subtle form of self-dealing.
The rest of this paper is organized as follows. Section 2 provides the institutional background and literature review. Section 3 reports the empirical analyses, and Section 4 concludes the paper.
2. Institutional Background, Literature Review, and Hypothesis Development
2.1. Self-dealing in China
Studies of agency problems have traditionally focused on the conflict of interest between management and a diffused group of shareholders (eg, Berle and Means, 1932; Jensen and Meckling, 1976). However, more recently, considerable attention has been paid to the conflict of interest between controlling shareholders and dispersed minority shareholders, a phenomenon that is typical in emerging or transitional economies (eg, La Porta et al., 1999). In such economies, concentrated ownership is commonplace, and traditional investor protection and corporate governance mechanisms are weak (eg, La Porta et al., 2000). Taken together, these factors create an environment that is highly conducive to self-dealing by controlling shareholders.
China is a typical example of a transitional economy. Following the accession to power of the Chinese Communist Party in 1949, market mechanisms and corporateshareholding were abandoned in China. Since 1978, a number of reforms have been implemented to take China from being a centrally planned economy to a market one. Shareholding companies have emerged, which allow the participation of private investors, and stock exchanges were opened in 1990 and 1991 to facilitate the financing of the economy. The majority of listed firms have been restructured from former stateowned enterprises (SOEs), and many are carve-outs from a parent group, either a state entity or a private enterprise, which retains a controlling stake in the listed firm. Prior to 2006, shares owned by controlling shareholders were mostly non-tradable, which deprived controlling shareholders of the benefits of share price appreciation.
A number of recent studies examine self-dealing in China. Cheung et al. (2006) study stock price reactions to announcements of related party transactions (RPTs) by Hong Kong-listed mainland China firms, and find that market reactions tend to be negative, which suggests that controlling shareholders divert resources away from listed firms through RPTs. Jian and Wong (2006) provide evidence that corporate insiders use RPTs to prop up the earnings of and tunnel resources from listed firms. Their examination of related sales, lending, and investment between listed firms and controlling shareholders reveals that these transactions are used to meet regulatory earnings targets (propping), and that more propping leads to more tunneling (Jian and Wong, 2006).
Jiang et al. (2009) document a more transparent form of self-dealing in China, which is rare elsewhere, namely, controlling shareholders directly taking money out of listed firms in the form of loans. They find that these loans are negatively related to the future earnings and stock returns of listed firms, which indicates that self-dealing is detrimental to the interests of minority shareholders (Jiang et al., 2009).
In this paper, we study a more subtle form of loans from listed firms to controlling shareholders - trade credit. Because many Chinese listed firms are carve-outs, related party sales are common and their dollar amount is large, which results in a great magnitude of accounts receivable due from controlling shareholders and their af filiates. These related party accounts receivable tend to remain outstanding for a long time, which hurts firm profitability. They potentially represent another channel that facilitates self-dealing in China.
2.2. Self-dealing through Trade Credit
Extending trade credit to customers is a common, if arms-length, way of doing business. When trade credit is extended to controlling shareholders or their af filiates, a number of issues arise that can jeopardize the fairness of the transaction, including whether the transaction price is a fair market price, the credit terms are reasonable, and receivables are collected in a timely manner. Because controlling shareholders potentially dictate the operational decisions of firms, extending trade credit could facilitate selfdealing, which harms the interests of minority shareholders.
In China, self-dealing through trade credit is possible because 1) trade credit represents a large proportion of total firm assets, 2) trade credit is of long duration, and 3)an allowance for uncollectible debts is rarely made against accounts receivable due from controlling shareholders, regardless of how long the accounts have been outstanding.
After China established stock exchanges, regulators initially maintained tight control over the listing process. They deliberately kept the number of listed shares low. For example, before 2001, regulators annually set the total number of shares to be issued each year, and quotas were allocated to provinces and central government ministries. Each province or ministry then allocated its quota to firms within its jurisdiction. Only these firms were able to go public (within the quota) and be listed on stock exchanges.Thus, to meet the quota requirement, many firms had to carve out a part of the firm (normally the productive part) to list while the rest of the firm remained in the parent group. The practice continues today of a newly listed firm continuing to supply output to the downstream divisions of the parent group, as it did before listing, which inevitably results in a large dollar amount of trade credit.
For example, Wu Liang Ye (stock code: 000858) is a carve-out from the Wu Liang Ye Group. The listed Wu Liang Ye is mainly the production division of this famous brand of Chinese liquor. The sales division remains with the Wu Liang Ye Group, which is effectively the controller of the listed firm. In 2007, 53.68% of the output from the listed firm was sold to the sales division of the parent group, the Wu Liang Ye Import and Export Company.2This figure is computed based on the listed firm’s annual report. It is also widely reported that sales to the parent group are made at discounted prices.
In our sample, which covers the 2000-2004 period, total accounts receivable amount to 12% of the total assets of listed firms, and the interquartile range is from 4.2% to 17%. Although limited data availability prevents us from identifying the exact proportion of accounts receivable due from controlling shareholders, examples such as the Wu Liang Ye case and anecdotal evidence suggest that it is quite substantial.
Accounts receivable due from controlling shareholders tend to be longstanding, and an allowance for uncollectible accounts is rarely made. The credit history of Chinese businesses is sub par. During the transition from a planned and government-owned economy to a market one, uncollectible trade credit has constantly been a problem. A new term, ‘triangle debt,’ has been coined to describe the situation where one firm owes money to another, which in turn owes money to yet other firms. In the late 1990s, the credit problem resulted in a huge number of non-performing loans among Chinese banks. The government assumed the bad loans through equity injection into the banks and removed the loans from bank balance sheets.
Such a credit environment is likely to harm listed firms. The first consequence is that accounts receivable tend to be longstanding. A cursory examination of the balance sheets of Chinese listed firms reveals that accounts receivable stay in the balance sheets for as long as five years. In our sample, accounts receivable aged between 13 and 24 months comprised 10.8% of total accounts receivable, those aged between 25 and 36 months,5.8%, and those aged more than 36 months, 10.3%. In total, accounts receivable more than a year old represented 26.9% of total accounts receivable, not including those receivables that had been written off. Such longstanding overdue accounts amount to interest-free long-term loans to customers, including controlling shareholders, and obviously harm shareholder interests, especially those of minority shareholders.
In developed economies, trade credit over a year old tends to be written off completely; however, this is not the case in China. Chinese listed firms make an insufficient bad debt allowance against accounts receivable, and nearly none against receivables (including accounts receivable) that are due from controlling shareholders.This leads to another negative effect of a sub par credit environment on listed firms - the inflation of corporate earnings.
However, this environment is not the only reason that firms do not make a bad debt allowance against accounts receivable. Government regulations, in fact, discourage listed firms from making a bad debt allowance, especially against receivables due from controlling shareholders. On October 26, 1999, the Ministry of Finance issued Directive on Accounting Policy No. 35,3财会字[1999]35号《股份有限公司会计制度有关会计处理问题补充规定》.which sets a high threshold for listed firms to recognize bad debt expense. For example, for their overdue debts to be written of f, customers must have filed for bankruptcy, be experiencing severe cash flow problems, or have experienced disastrous events, or the overdue accounts must be more than five years old. The Directive prohibits writing offreceivables due from controlling shareholders in any event, and requires firms to hold employees who made the trade responsible for the losses if a substantial amount of trade credit becomes uncollectible.
In summary, the foregoing observations suggest that controlling shareholders in China use trade credit to tunnel resources away from listed firms. These shareholders owe listed firms a substantial amount in accounts receivable, which tend to be outstanding for a long time. Also, listed firms make an insuf ficient, and more often no, bad debt allowance against accounts receivable in general, and accounts receivable due from controlling shareholders in particular. Consequently, a substantial amount of the funds of listed firms is used by controlling shareholders for a long period, interest free, which hurts firm profitability and harms the interests of minority shareholders.
2.3. Three Cases of Self-dealing through Trade Credit4The details of these cases are available from the authors upon request.
Case A: San Jiu Yi Yao (stock code: 000999)
The controlling shareholder, the San Jiu Group, owned more than 70% of San Jiu Yi Yao’s common shares. From 2000 to 2004, total accounts receivable routinely constituted more than 10% of total assets. The bad debt allowance rate was as low as2% for accounts receivable aged less than 12 months, and as high as 30% for those aged more than 36 months. However, a footnote in San Jiu Yi Yao’s 2001 report specifically indicated that a bad debt allowance was not to be made against receivables due from controlling shareholders. By the end of 2004, total receivables (accounts and other receivables) due from controlling shareholders accounted for 45% of the firm’s total assets. San Jiu Yi Yao’s external auditor issued a qualified opinion every year after 2001 on the grounds that it could not judge the impact of the outstanding receivables on the firm’s operation. However, the board of directors insisted that the receivables due from controlling shareholders would be collected and did not approve making an allowance for bad debts. Unfortunately, the minority shareholders of San Jiu Yi Yao never saw these receivables collected in cash. In 2007, with receivables due from controlling shareholders mounting and under pressure from regulators and minority shareholders, the controlling shareholders took a debt-for-assets swap to settle part of the receivables and transfer control to Hua Run Group.
Case B: Zheng Zhou Mei Dian (stock code: 600121)
Zheng Zhou Mei Dian is a typical carve-out. In 1997, the Zheng Mei Group carved out its coal production part, which become Zheng Zhou Mei Dian, and listed the latter on the Shanghai Stock Exchange. After the IPO, the Zheng Mei Group owned more than 70% of Zheng Zhou Mei Dian’s common shares. Zheng Zhou Mei Dian’s main product was coal. After listing, it never established its own distribution channel. Thus, nearly 80% of the listed firm’s outputs were sold through the sales division of the Zheng Mei Group. However, the Zheng Mei Group was slow to pay Zheng Zhou Mei Dian, and by 2004, the Group owed it RMB560 million, accounting for 43.7% of the latter’s 2004 revenues. The listed firm did not report whether it had made a bad debt allowance against receivables due from the Zheng Mei Group, but that is unlikely given that the total bad debt allowance accounted for only about 5% of total receivables before 2005.The allowance was likely to have been made against receivables due from non-related customers, which bought the other 20% of Zheng Zhou Mei Dian’s outputs. The minority shareholders did not see the majority of these receivables paid back in cash. On December 28, 2005, a debt-for-equity swap took place, and Zheng Zhou Mei Dian wrote offRMB465 million worth of common shares owned by the Zheng Mei Group and thus forgave an equivalent dollar amount of receivables due from the Group.
Case C: Lu Bei Hua Gong (stock code: 600727)
Although in both Cases A and B, controlling shareholders take up precious capital of the listed firms for a long time in the form of outstanding accounts receivable and minority shareholders of the listed firms never see the money paid back in cash, the argument can still be made that ex ante, this form of loans represents an efficient internal capital market arrangement whereby controlling shareholders can tunnel listedfirms in times of need and prop up listed firms when the latter require help. Of course, this argument does not hold ex post in the two abovementioned cases, because the controlling shareholders are unable to pay back the loans.
In the case of the Lu Bei Hua Gong, we are able to access the financial data of its controlling shareholder.5China Statistical Bureau publishes annually the financial data of large business firms.These data show that although Lu Bei Hua Gong suffered losses, the controlling shareholder, the Lu Bei Group, reported increasing profitability. Nevertheless, the Lu Bei Group and its af filiates owed Lu Bei Hua Gong a substantial amount in loans in the form of accounts receivable, which is inconsistent with the internal capital market argument but consistent with the self-dealing argument.
Prior to 2005, the Lu Bei Group owned about 50% of Lu Bei Hua Gong’s common shares, a figure that declined to 27.9% after 2006, which remained the controlling stake. From 2002 to 2008, the ratio of accounts receivable to total assets increased from 4.39% to 25.07%, with increases occurring mostly in 2006, 2007, and 2008. By the end of 2008, receivables due from the controlling shareholder, af filiates, and other related parties account for 80% of total accounts receivable. During the same period, Lu Bei Hua Gong’s return on assets (ROA) decreased from 2.89% to -29.18%, and its cash ROA (operating cash flow divided by total assets) decreases from 5.07% to -7.59%. Because of two consecutive annual losses, the listed firm’s stock was placed under special treatment status (ST). However, the ROA of the controlling shareholder, the Lu Bei Group, increased nearly monotonically from 7.2% in 2002 to 20.36% in 2007, and its cash ROA increased from 15.88% in 2004 to 25.42% in 2007.
2.4. Hypothesis Development
In summary, anecdotal evidence and case studies strongly suggest that in China, controlling shareholders engage in self-dealing activities by extracting trade credit from listed firms, and thus expropriate value from minority shareholders. This form of selfdealing is harder to recognize than the more transparent ‘Other receivables,’ which is explicitly prohibited by regulations. Trade credit is a part of the normal operating activities of any business, and traditionally, the outputs of listed firms tend to be sold via the sales division of controlling shareholders. China’s sub par credit environment makes self-dealing through trade credit less distinguishable from the overall credit problem in the marketplace.
However, the great magnitude and long duration of trade credit to controlling shareholders seriously hurt the profitability of listed firms, and reduce the value of shares owned by minority shareholders. Thus, in this paper, we test the following hypotheses:
Hypothesis 1a: Trade credit is negatively related to the future profitability of listed firms.
Hypothesis 1b: Trade credit is negatively related to the future stock returns of listed firms.
3. Empirical Analyses
3.1. Data and Preliminary Analyses
Our sample period is from 2000 to 2004. We start at 2000 because prior to 1999, the Ministry of Finance did not have a clear policy on bad debt allowances for listed firms. New policies issued in 1999 and 2000 required listed firms to make a bad debt allowances and also gave guidelines on assessing bad debts. We stop at 2004 because we examine accounting performance and stock returns over three years. From all listed firms, we exclude financial firms, first-year IPO firms, and firms without the necessary financial data. In total, we have 4,882 firm-year observations, ranging from 757 observations in 2000 to 1,117 observations in 2004. In the analyses below, we winsorize the main financial variables (not including future returns) at the 1% and the 99% level to minimize the influence of outliers.
We collect gross accounts receivable, in total and by age of receivables outstanding. Our main purpose is to investigate whether accounts receivable due from controlling shareholders and affiliates are negatively related to the future profitability and stock returns of listed firms; however, financial disclosure during our sample period does not allow us to systematically collect disaggregate information on accounts receivable. Thus, we rely on total accounts receivable to do our analyses. The problem with this approach is that accounts receivable include those from parties unrelated to the controlling shareholders, and thus the extent of self-dealing through trade credit is overstated. We take two approaches to minimize this problem.
First, our conclusions are drawn based on portfolio analyses where portfolios are constructed by sorting firms annually based on measures of total receivables (divided by total assets, ARC). Specifically, we compare whether low and high ARC portfolios differ significantly in terms of future accounting profit and stock returns, with and without controlling for other firm characteristics. Ex ante, we do not have reason to believe that high ARC firms will have a larger portion of receivables due from controlling shareholders than low ARC firms. If this conjecture is true, then the results of sorting based on total receivables will be similar to those of sorting based on receivables due from controlling shareholders.
Second, in the main analyses below, we report results using industry-adjusted accounts receivable aged more than 24 months divided by total assets (IARC2)6Using total accounts receivable, receivables aged more than 12 months, and receivables aged more than 36 months produces similar results.to sort firms. Accounts receivable that are outstanding for more than two years are morelikely to be attributed to controlling shareholders and their af filiates, whereas accounts receivable due from unrelated parties tend to be collected in a timely manner.7We examine the top 20 firms in terms of IARC2 in 2002, and find that 40% of them received an unclean auditor opinion, and that 40% of them entered ST status in the next three years, which further confirms that IARC2 reasonably captures the self-dealing nature of related party receivables.
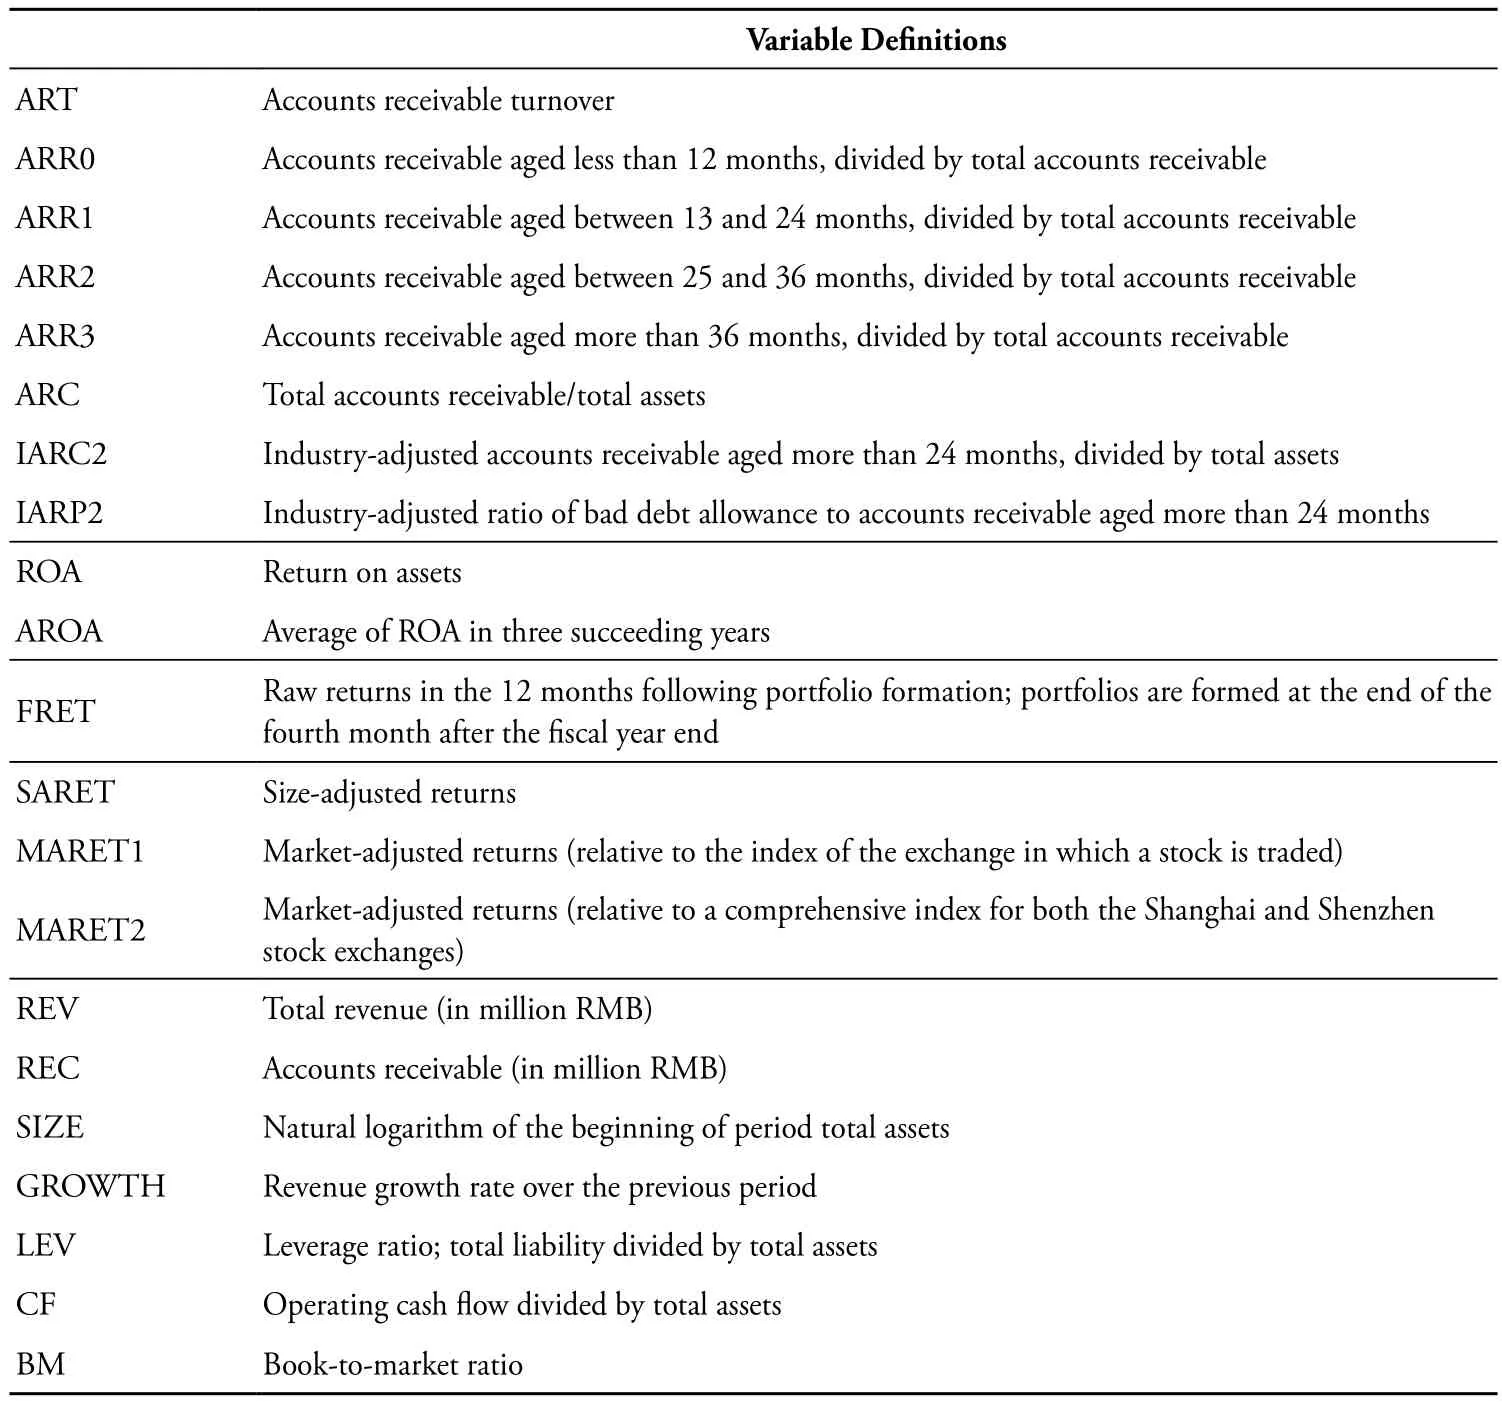
Table 1. Definition of Main Variables
Table 2. Summary Statistics of Main Variables
Table 1 defines the main variables used in our analyses. Table 2 reports the summary statistics of our sample firms. On average, our sample firms report RMB 1,761.46 million in revenue and RMB 219.82 million in gross accounts receivable. Thus, on average, gross accounts receivable outstanding constitute 12.5% of the revenue of listed firms. The mean (median) ROA of our sample firms is 2.7% (3.1%),8The mean and median ROA of our sample are similar to those reported by Niu et al. (2007).and amazingly, the mean (median) ratio of gross accounts receivable to total assets (ARC) is 12.0% (9.6%). Put differently, on average, accounts receivable outstanding are more than four times the firm profits in Chinese listed firms over a five-year period. Another interesting observation from Table 2 is that cash earnings (CF, operating cash flow divided by total assets) are actually higher than earnings (ROA). Over a five-year period, cash earnings (as a percentage of total assets) are greater annually than the reported total earnings by 2.8%. One wonders where the cash generated by operations went. One likely explanation is that controlling shareholders took the cash away from listed firms through ‘Other Receivables’ (Jiang et al., 2009).
The mean (median) ratio of accounts receivable aged less than 12 months to total accounts receivable (ARR0) is 73.1% (79.1%), 10.8% (7.4%) for accounts receivable aged between 13 months and 24 months (ARR1), 5.8% (3.0%) for accounts receivable aged between 25 months and 36 months (ARR2), and 10.3% (4.2%) for accounts receivable aged more than 36 months (ARR3). Thus, on average, 26.9% of total accounts receivable are outstanding for more than a year, and represent 3.2% of totalassets (26.9%*12.0%). Again, if firms wrote offaccounts receivable more than a year old, then a profit year would into a loss year for the average firm.
3.2. Accounts Receivable, Future Profitability, and Stock Returns
Each year between 2000 and 2004, we sort sample firms based on IARC2, which is industry-adjusted accounts receivable aged more than 24 months divided by total assets. We use an industry-adjusted measure to avoid concentration in certain deciles with a limited number of industries, which eliminates the industry effect of receivables-related policies. Because our time series is short, we pool together observations from the same deciles from all five years. This treatment creates serial correlation among observations across years; thus, in the multivariate regressions, we control for the year effect, and adjust the t-statistics using the standard errors corrected for clustering at the firm level (Peterson, 2009).

Table 3. Mean Firm Characteristics of Deciles Formed Based on Accounts Receivable
Table 3 reports the firm characteristics of the ten deciles. First, high IARC2 firms tend to have a high level of total receivables (ARC). Total accounts receivable comprise 10.7% of firm assets in the lowest IARC2 decile. This ratio actually decreases to 8.2% in the sixth decile before increasing to 22.8% in the highest IARC2 decile. Accounts receivable turn over faster in the low IARC2 deciles (ART, 29.185 times in the lowest IARC2 decile) than in the high IARC2 deciles (only 2.937 times in the highest IARC2 decile). This result indicates that the large amount of receivables in the high IARC2 deciles is not supported by large sales; rather, these are receivables that have been outstanding (and accumulating) for some time. This observation is further supported by the relative magnitude of revenue versus receivables. In the lowest IARC2 decile,accounts receivable constitute 9.3% of revenue, whereas in the highest IARC2 decile, they comprise nearly 40% of revenue.
High IARC2 is negatively related to current-period ROA and cash earnings (CF, operating cash flow divided by total assets). Return on assets decreases from 4.7% in the lowest IARC2 decile to -0.8% in the highest IARC2 decile, while cash earnings decrease from 7.6% to 3.5%. These findings provide preliminary evidence that a great magnitude of accounts receivable points to damage done to listed firms by the self-dealing of controlling shareholders.9The argument can be made that the results in this paper are also theoretically consistent with the accrual anomaly (eg, Sloan, 1996; Xie, 2001). The accrual anomaly would interpret high IARC2 firms as being low earnings persistence firms as accounts receivable are a major part of accrued earnings. Because of the low earnings persistence, high IARC2 firms experience low future earnings and low stock returns as we document below. However, the accrual anomaly would require that high IARC2 firms have high current earnings, not low current earnings as we document in Table 3.
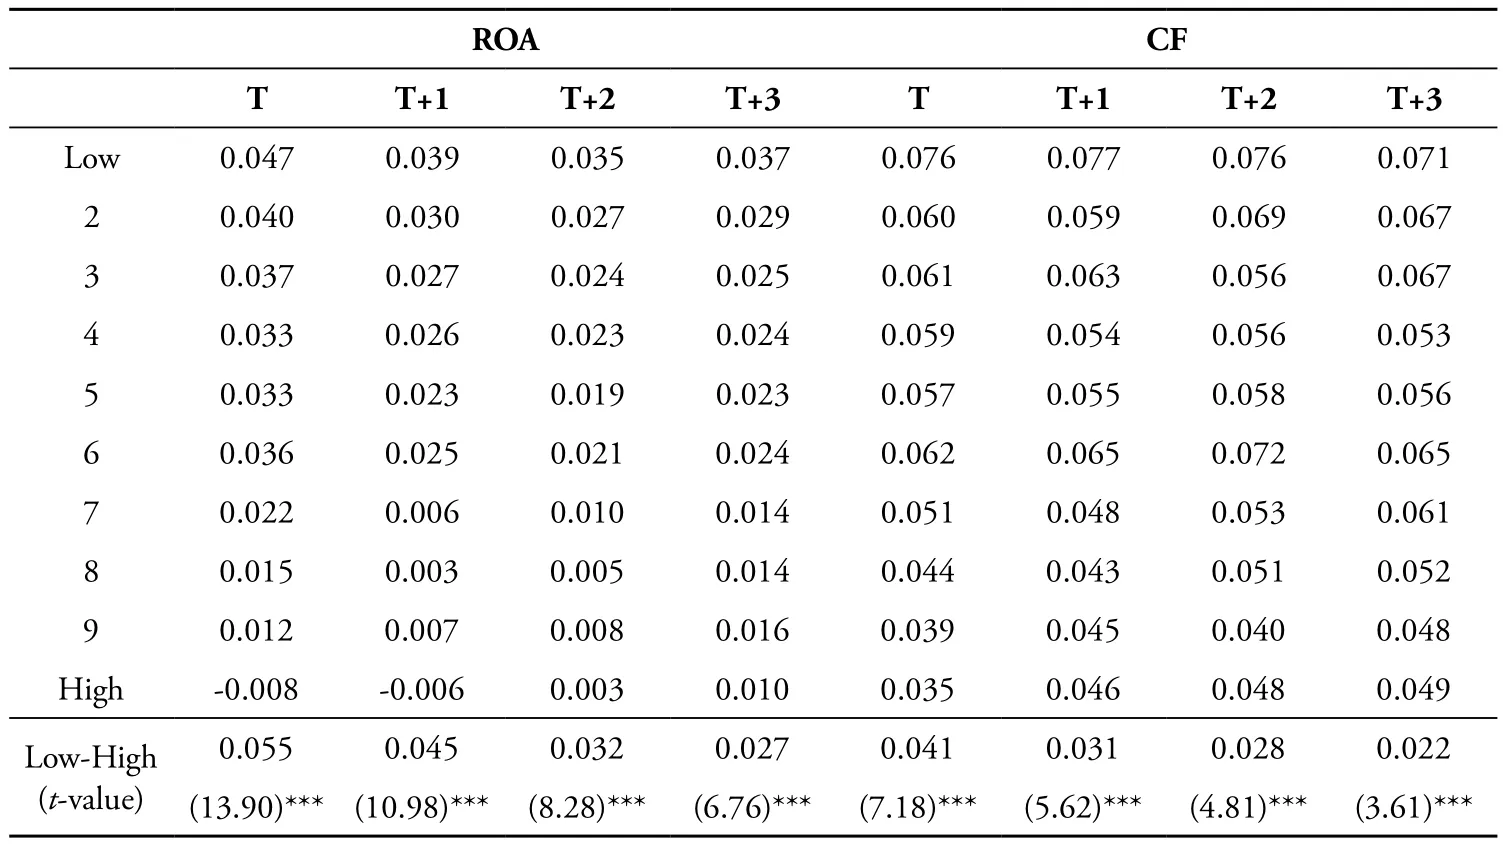
Table 4. Accounts Receivable and Future Profitability
In Table 4, we report the ROA and CF of the ten IARC2 deciles during the sorting year (year T), and three succeeding years. In year T, the lowest IARC2 decile reports 4.7% ROA, which is 5.5% higher than the -0.8% ROA of the highest IARC2 decile, and the difference is statistically significant. In addition, thelowest IARC2 decile outperforms the highest one in ROA by 4.5% in year T+1, 3.2% in year T+2, and 2.7% in year T+3, and all of the differences are statistically significant. In any of the four years, as IARC2 increases, ROA decreases nearly monotonically. We also observe a similar trend in cash earnings. In terms of CF, the lowest IARC2 decile outperforms the highest one by 4.1% in year T, 3.1% in year T+1, 2.8% in year T+2, and 2.2% in year T+3. Thus, high IARC2 firms not only report lower accrued earnings, they are also less capable of generating operating cash flow.
Investors do not seem to fully understand that IARC2 is negatively related to future profitability (Bernard and Thomas, 1995; Burgstahler et al., 2002). Table 5 reports the size-adjusted returns and two measures of market-adjusted returns for the ten IARC2 deciles in three succeeding years. In year T+1, the lowest IARC2 decile firms earn 3.9% size-adjusted returns, beating the highest IARC2 decile firms (-1.4%) by 5.3%, and the difference is statistically significant. When we use the market-adjusted returns, the lowest IARC2 decile beats the highest one by a larger margin in year T+1, 8.1%, when we use Shanghai Stock Index returns and Shenzhen Stock Index returns separately for Shanghai and Shenzhen listed firms (MARET1), and 8.2% when we use a composite index of both exchanges as the market return (MARET2). In general, the size- and market-adjusted returns for the low IARC2 deciles are positive, whereas those for the high IARC2 deciles are negative.
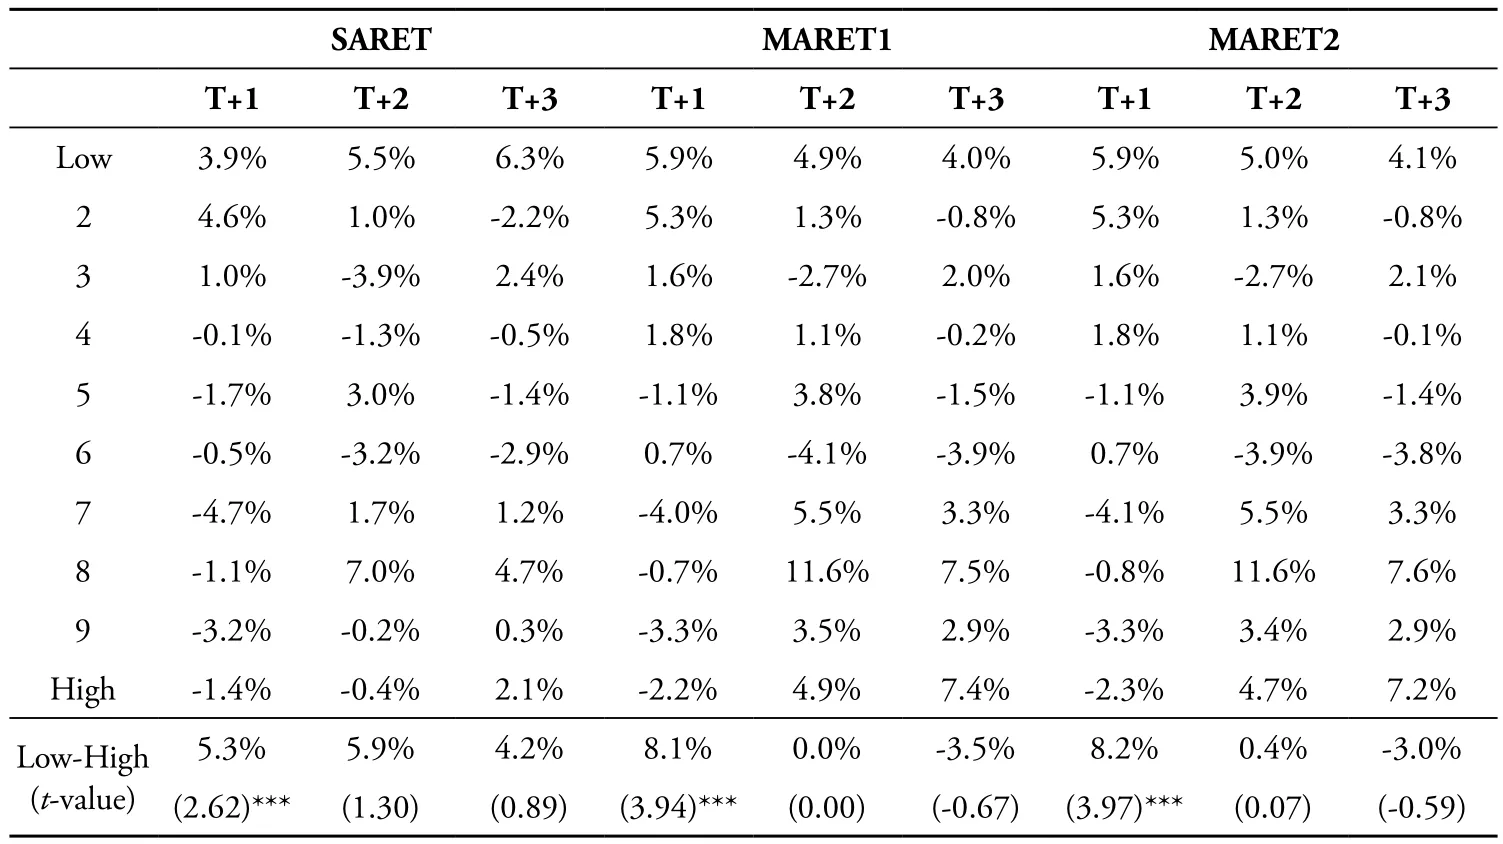
Table 5. Accounts Receivable and Future Stock Returns
In year T+2, although the lowest IARC2 decile firms still beat the highest IARC2 decile ones, the differences are no longer significant. In year T+3, the highest IARC2 decile actually outperforms the lowest one in terms of market-adjusted returns, but the difference is insignificant.10In return tests, one is always left wondering whether risk has been suf ficiently controlled for before abnormal returns are recognized. However, little is known about the return structure in the Chinese market. Eun and Huang (2007) attempt to address this issue and conclude that size is still the major possible risk candidate in China, whereas beta is not. Hence, we do not use beta-adjusted returns.Therefore, although investors do not fully recognize the negative implications of IARC2 for future earnings, it takes only a year before the mispricing is statistically corrected.
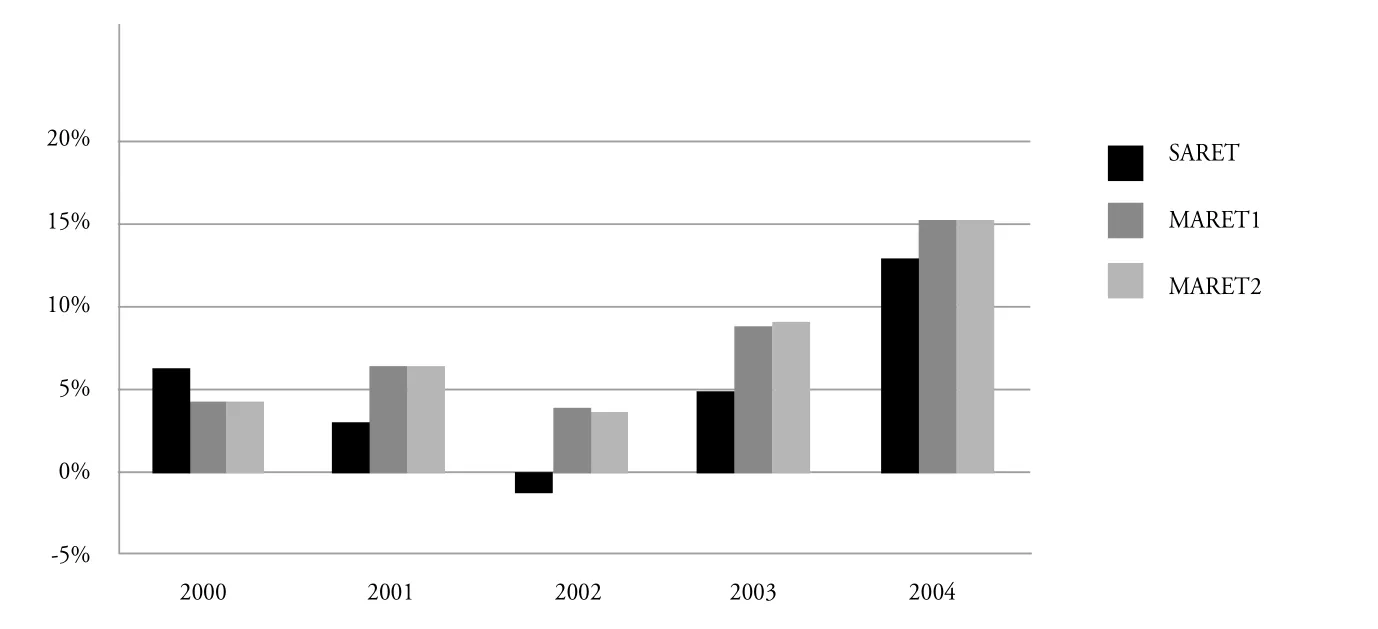
Figure 1. One-year-ahead Abnormal Returns of a Hedge Portfolio with Long Bottom Decile Accounts Receivable (IARC2) Stocks and Short Top Decile Accounts Receivable (IARC2) Stocks
Figure 1 plots the three measures of hedge returns (low minus high IARC2 deciles) by year. Only in one year (2002) do high IARC2 firms outperform low IARC2 ones in terms of size-adjusted returns during year T+1. All other hedge returns across the five years are positive, which indicates that the better performance of the low IARC2 decile in year T+1 is consistent over time.
In the univariate analysis, other factors that could affect future profitability and stock returns are not controlled. Now, we turn to multivariate analysis.
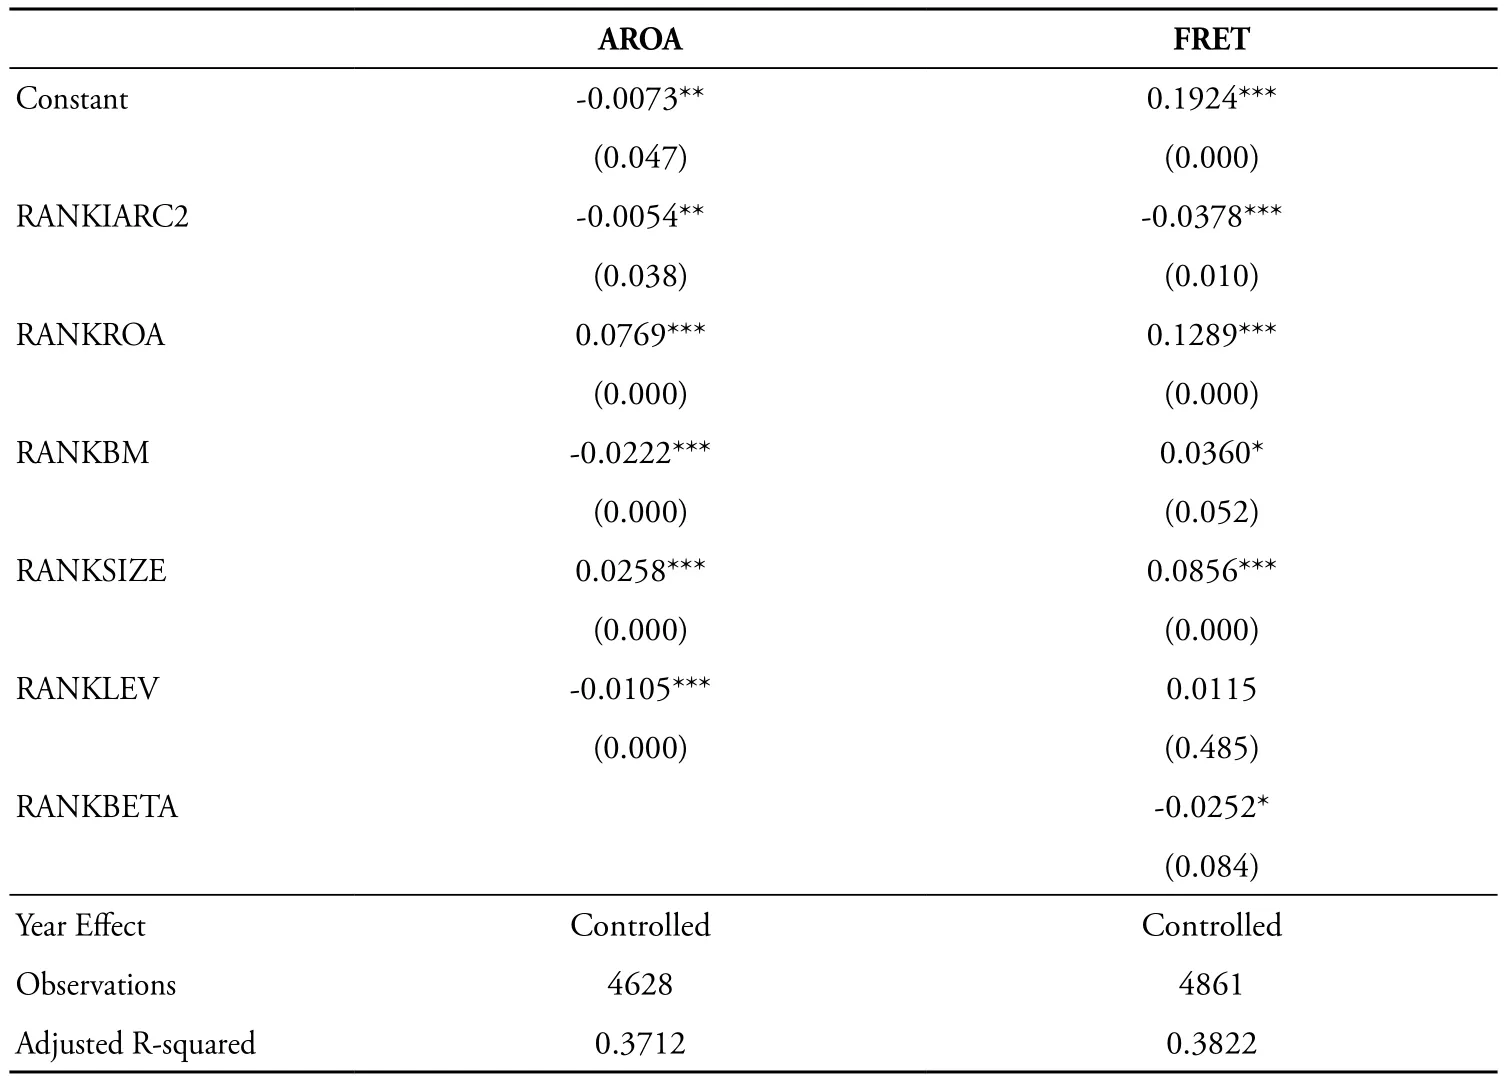
Table 6. Multivariate Analysis of Accounts Receivable, Future Earnings, and Future Stock Returns
In the second column of Table 6, we regress the average of ROA in three succeeding years, AROA, on IARC2, current ROA, book-to-market ratio (BM), firm size (SIZE; measured by the natural logarithm of total assets), and firm leverage (LEV). All independent variables are measured at the end of current year T. Instead of the original values of the independent variables, we use the decile ranks of each independent variable and scale the ranks between 0 and 1. The main reason we use decile ranks rather than the original values in our regressions is that the financial data of Chinese listed firms tend to be highly skewed (Wang et al., 2007); that is, the distribution of financial data has fat tails, and violates the normality assumption of ordinary least square regression. Using the rank decile as the independent variable also makes easier the interpretation of the regression coefficients.
After controlling for current profitability and other firm characteristics, IARC2 is still significantly negatively related to ROA in the three succeeding years, with a coefficient of -0.0054 (p < 0.05). All else being equal, the highest IARC2 decile firms underperformthe lowest IARC2 decile ones by 0.54% every year over the three years. Given the low level of profitability of our sample firms (Table 2), this difference is also economically significant.
The coefficient on ROA (0.0769) is significantly positive. However, this coefficient is quite low, which indicates faster mean reversion of profitability, consistent with the finding of Niu et al. (2007). Finally, future profitability is negatively related to book-tomarket ratio and firm leverage, and positively related to firm size, as expected.
In the third column of Table 6, we regress the one-year-ahead stock returns (FRET) on the variables in the AROA regression, and the decile rank of firm beta. Firm betas are obtained from the SinoFin database and computed up to the end of year T. After controlling for the other firm characteristics, IARC2 is found to be significantly negatively related to future returns with a coefficient of -0.0378 (p < 0.10). The highest IARC2 firms underperform the lowest IARC2 ones by 3.78% in the 12-monthahead period, all else being equal. Current ROA, book-to-market ratio, and firm size are positively related to future returns, whereas firm leverage is insignificantly related. However, beta is negatively related to future returns (p < 0.10). Given the noise in computing beta, we have no clear explanation for this relationship.
In summary, the univariate and multivariate analyses show that the magnitude of accounts receivable is negatively related to future profitability and stock returns. The results are robust after controlling for firm characteristics that typically affect firm profitability and returns. This negative relationship does not appear to be driven by low earnings persistence (Sloan, 1996; Xie, 2001) as predicted by the accrual anomaly.The accrual anomaly would require high (low) current earnings for high (low) IARC2 decile firms; however, high (low) IARC2 decile firms report low (high) current earnings. Thus, a more plausible explanation is that IARC2 captures the extent of self-dealing by controlling shareholders through trade credit. High IARC2 firms are those among which controlling shareholders tie up firm capital through a large magnitude of accounts receivable, which they do not pay back for a long time. Consequently, listed firms run into operating dif ficulties, which hurts their profitability. When investors realize the selfdealing nature of receivables, stock prices are depressed.
3.3. Bad Debt Allowance, Future Earnings, and Stock Returns
In this section, we examine the relation between bad debt allowance and future earnings as well as stock returns. The literature has identified two main reasons that listed firms make a bad debt allowance (Elliott and Shaw, 1988; McNichols and Wilson, 1988; Chen et al., 2004). The first reason is economic - firms make an allowance for bad debts or impairment losses when assets lose value, and the second is earnings management. Asset impairment or bad debt allowance is made without economic loss to shuf fle earnings across accounting periods.
It is not the purpose of this paper to differentiate between these two reasons with regard to the incentive among Chinese firms to make a bad debt allowance. Thus, wefocus on the industry adjusted ratio of bad debt allowance to accounts receivable aged more than 24 months (IARP2).11Using the ratio of bad debt allowance to total receivables, receivables aged more than 12 months, and receivables aged more than 36 months produces similar results.We believe that this measure can also capture the extent to which controlling shareholders expropriate listed firms through trade credit. First, the Ministry of Finance policies on making a bad debt allowance discourage listed firms from making such an allowance against receivables due from controlling shareholders and related parties. The policies clearly indicate that the employees of the listed firms who extend the trade credit will be held responsible for any losses. Second, making a bad debt allowance against receivables due from controlling shareholders would immediately damage the reputation of the controlling shareholder and listed firm, for it would send a signal to the market that the party that controls the listed firm can actually take money from the firm without intending to pay it back. Therefore, the allowance listed firms have already made is likely against receivables due from unrelated parties. By sorting based on IARP2, we also capture the extent of self-dealing through trade credit: the higher is the IARP2, the lower is the amount of receivables due from controlling shareholders.
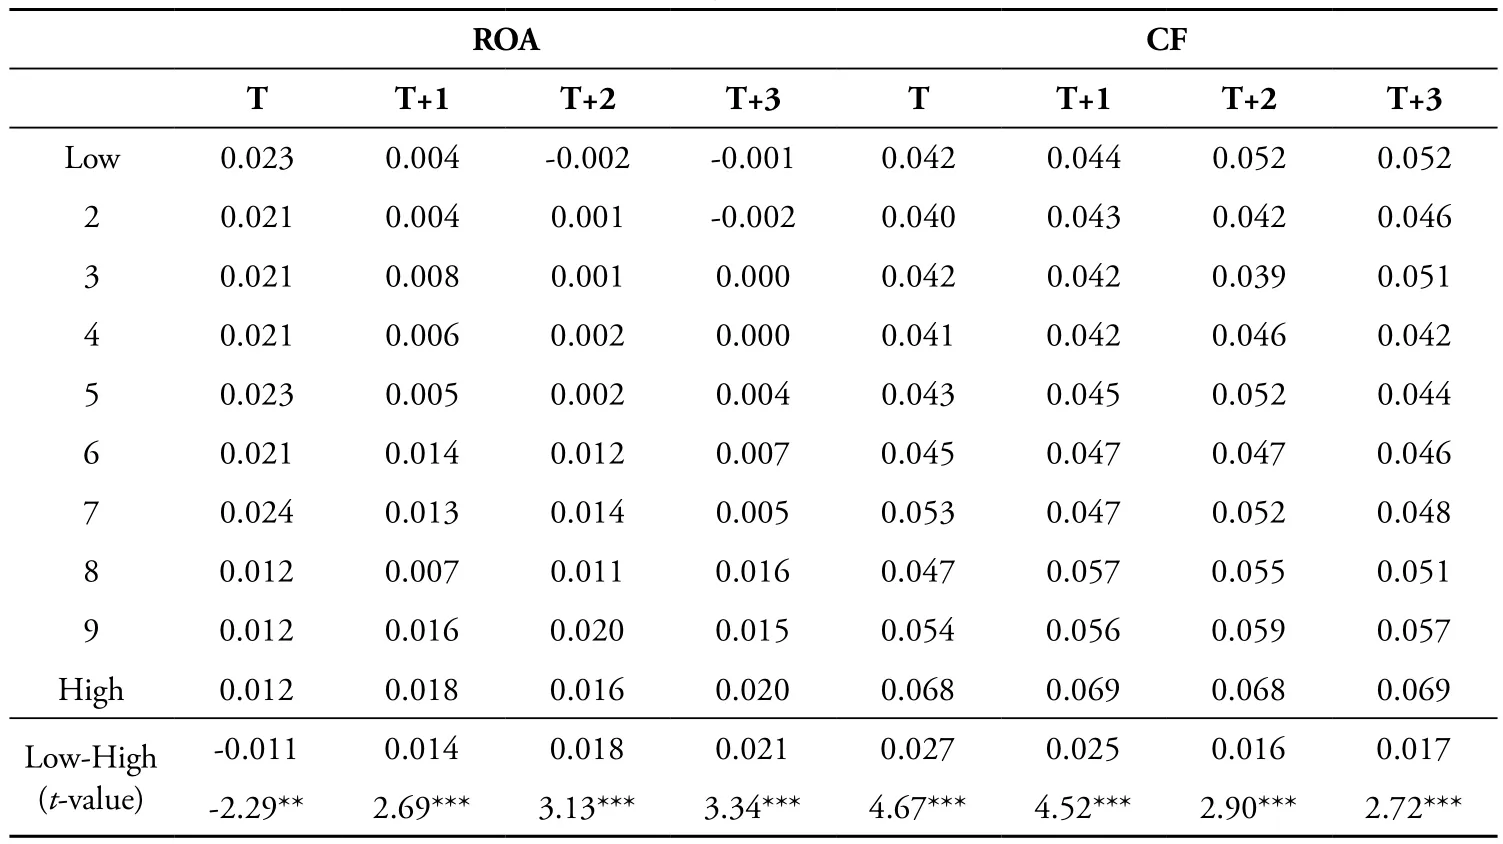
Table 7. Bad Debt Allowance, Future Earnings, and Stock Returns

Note: Each year between 2000 and 2004, we sort all sample firms into ten deciles based on IARP2, which is the industryadjusted ratio of bad debt allowance to accounts receivable aged more than 24 months. We then track ROA, cash earnings (CF), size-adjusted returns (SARET), and two measures of market-adjusted returns (MARET1 and MARET2) in three succeeding years. All observations for the same deciles between 2000 and 2004 are pooled together before means are calculated. ***, **, and * represent significance at the 1%, 5%, and 10% levels, respectively.
Table 7 reports ROA and CF from year T to year T+3 and the size-adjusted and market-adjusted returns from year T+1 to year T+3 for the ten deciles sorted based on the IARP2.
In year T, IARP2 is negatively related to ROA. The ROA of the highest IARP2 firms (large allowance firms) is 1.1% lower than that of the lowest IARP2 firms (small allowance firms), and the difference is statistically significant. It appears that the earnings power of large allowance firms is weaker. However, looking at cash earnings (CF in year T), the large allowance firms actually report greater cash earnings by 2.7%. This indicates that firms that are willing to make an allowance are not poorly performing firms.
In year T+1 through year T+3, large allowance firms outperform small allowance ones by a significant margin, whether we use the accruals measure of earnings (ROA) or cash measure of earnings (CF). It is worth noting that the magnitude of outperformance in ROA in years T+1 to T+3 is quite large, and there does not appear to be an automatic reversion of earnings when the low earnings in year T are artificially low because of earnings management through making a greater allowance.
Large allowance firms outperform small allowance ones in year T+1 and year T+2, whether we use size-adjusted or market-adjusted returns, which is consistent with the better earnings performance of these firms. In unreported regressions, IARP2 is positively related to future earnings performance and stock returns even after we control for other firm characteristics.
In summary, the bad debt allowance tests presented in this section also support the notion that trade credit is used by controlling shareholders to expropriate minority shareholders, and that listed firms and minority shareholders suffer as a consequence.
4. Concluding Remarks
In this paper, we study the self-dealing nature of trade credit from listed firms to their controlling shareholders. We posit that given China’s sub par credit history and weak investor protection environment, trade credit could be exploited by controlling shareholders to siphon offbenefits from minority shareholders.
We need to acknowledge that differentiating fair trade credit from self-dealing through trade credit is dif ficult. Trade credit is extended to trade partners through actual transactions, whether or not the transaction is conducted on an arm’s length basis. Outsiders have virtually no way to directly judge whether the trade price and credit terms are reasonable. Similarly, it is dif ficult to judge whether or not receivables will become uncollectible, as trade partners are still solvent. However, one thing is certain: long overdue receivables, even if ultimately repaid, hurt the interests of listed firms, as they serve as interest-free loans to trade partners.
Nevertheless, the institutional analyses and case studies that we present in this paper lead us to believe that a great magnitude of receivables is highly likely to be a manifestation of self-dealing. Indeed, we find that a great magnitude of receivables is negatively related to future earnings and stock returns in both a statistically and an economically significant way, which supports the self-dealing argument.
Loans from listed firms to controlling shareholders have been at the center of investor protection in China. In the past, more attention was given to non-operating loans (eg, those reported as other receivables) from listed firms to controlling shareholders (Jiang et al., 2009). The problem became so severe, however, that the State Council had to intervene in 2005 with both legal and administrative measures. By the end of 2006, direct non-operating loans to controlling shareholders were mostly settled. However, the incentive to engage in self-dealing remains. Hence, it is possible that when one channel of self-dealing is closed, controlling shareholders just find another one. Our paper identifies such an alternative channel and draws the attention of investors and regulators to it.
A number of related questions need to be addressed in future research. First, as financial disclosure improves, we may be able to collect detailed data on trade credit extended to controlling shareholders and the allowance made against it, which would increase the power of the tests. Second, and more importantly, further research is needed to identify the market mechanisms that are required to curtail self-dealing through trade credit. Regulators can prohibit other receivables, but they cannot prohibit trade receivables. Thus, better mechanisms need to be put in place to guarantee fairness in trade, the integrity of the credit terms, and the timely payback of receivables.
Berle, A., Means, G., 1932. The modern corporation and private property. Macmillan, New York.
Bernard, V. L., Thomas, J. K., 1995. Evidence that stock prices do not fully reflect the implications of current earnings for future earnings. Journal of Accounting and Economics 13, 305-340.
Burgstahler, D., Jiambalvo, J., Shevlin, T., 2002. Do stocks fully reflect the implications of special items for future earnings? Journal of Accounting Research 40, 585-613.
Chen, C. J. P., Chen, S., Su, X., Wang, Y., 2004. Incentives for and consequences of initial voluntary asset write-downs in the emerging Chinese market. Journal of International Accounting Research 3, 43-61.
Cheung, Y., Jing, L., Rau, R., Stouraitis, A., 2006. Tunneling, propping, and expropriation: Evidence from connected party transactions in Hong Kong. Journal of Financial Economics 82, 343-386.
Djankov, S., La Porta, R., Lopez-de-Silanes, F., Shleifer, A. 2008. The law and economics of self-dealing. Journal of Financial Economics 88, 430-465.
Elliott, J., Shaw, W., 1988. Write-offs as accounting procedures to manage perceptions. Journal of Accounting Research 26 (Supplement), 91-119.
Eun, C. S., Huang, W., 2007. Asset pricing in China’s domestic stock markets: Is there a logic? Pacific-Basin Finance Journal 15, 452-480.
Jensen, M., Meckling, W., 1976. Theory of the firm: Managerial behavior, agency costs, and ownership structure. Journal of Financial Economics 3, 305-360.
Jian, M., Wong, T. J., 2006. Propping and tunneling through related party transactions. Review of Accounting Studies, Forthcoming.
Jiang, G., Lee, C. M. C., Yue, H., 2009. Tunneling through inter-corporate loans: The China experience. Journal of Financial Economics, Forthcoming.
Johnson, S., Boone, P., Breach, A., Friedman, E., 2000a. Corporate governance in the Asian financial crisis. Journal of Financial Economic 58, 141-186.
Johnson, S., La Porta, R., Shleifer, A., Lopez-de-Silanes, F., 2000b. Tunneling. American Economic Review Papers and Proceedings 90, 22-27.
La Porta, R., Lopez-de-Silanes, F., Shleifer, A., 1999. Corporate ownership around the world. Journal of Finance 54, 471-517.
La Porta, R., Lopez-de-Silanes, F., Shleifer, A., 2000. Investor protection and corporate governance. Journal of Financial Economics 59, 3-27.
La Porta, R., Lopez-de-Silanes, F., Zamarripa, G., 2003. Related lending. Quarterly Journal of Economics 118, 231-268.
McNichols, M., Wilson, G. P., 1988. Evidence of earnings management from the provision for bad debts. Journal of Accounting Research 26 (Supplement), 1-31.
Niu, J., Yue, H., Jiang, G., 2007. The profitability analyses of Chinese listed firms: 1992-2004. China Accounting Review 2, 165-180.
Petersen, M. A., 2009. Estimating standard errors in finance panel data sets: Comparing approaches. Review of Financial Studies 22, 435-481.
Sloan, R. G., 1996. Do stock prices fully reflect information in accruals and cash flows about future earnings? The Accounting Review 71, 289-315.
Wang, H., Li, G., Jiang, G., 2007. Robust regression shrinkage and consistent variable selection via the LAD-Lasso. Journal of Business and Economic Statistics 25, 347-355.
Xie, H., 2001.The mispricing of abnormal accruals. The Accounting Review 76, 357-373.
* The authors are a doctoral student and an Associate Professor, respectively, of the Guanghua School of Management, Peking University. Comments from Jianjun Niu, Donghui Wu, Kangtao Ye, Ran Zhang, an anonymous referee, and the editor are greatly appreciated. We thank the National Natural Science Foundation of China for financial support (grant number 70972010).
** Corresponding author. Jigao Zhu: E-mail address: zhujigao@gsm.pku.edu.cn. Correspondence address: Guanghua School of Management, Peking University, Beijing, China, 100871.
猜你喜欢
杂志排行

China Journal of Accounting Research的其它文章
- Corporate Governance and Accounting Conservatism in China*
- Performance Volatility and Wage Elasticity: An Examination of Listed Chinese A-share Enterprises*
- China-Related Research in Auditing: A Review and Directions for Future Research*
- Institutional Environment, Blockholder Characteristics and Ownership Concentration in China*